Context-driven monitoring
Databricks (2013) and Snowflake (2012) were founded around the same time. Both during the big data craze. The consensus was simple. Data produced by a company’s operations was a massive untapped source of value. But it sat in a multitude of silos and in a multitude of forms. Data warehouses would allow the data to flow to one single bucket. Data scientists would then use that data, combined with some ML magic, to discover powerful insights. But the magic never really came for the vast majority of companies.
Big data as a concept was on a downtrend until very recently.
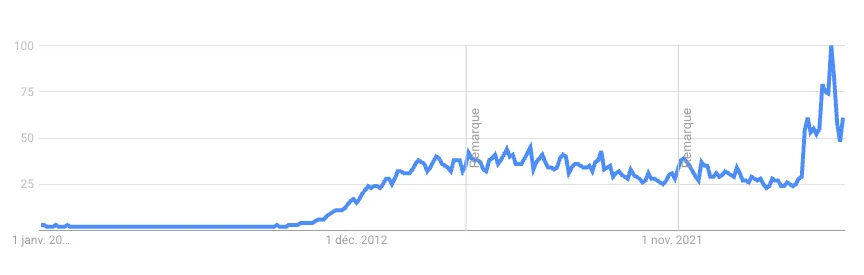
Worldwide search interest for "big data", Google Trends, 2004 to 2026.
What changed?
Things changed with LLMs.
Opinions differ about their real-world capabilities as coders. But they have two things that are undeniable: they are pretty good at writing throwaway code, which is exactly what’s needed for a one-off SQL query. And they are also good at handling context - all frontier models can manage up to 1M token context windows, which is about 750 000 words.
This combination makes them really useful for incident investigation or root cause analysis. None of this is beyond a human, but it’s a powerful boost during incidents when time is critical. The recent OpenAI / Hugging Face incident is a good illustration. They used an LLM to look through 17 000 attack logs, saying that this approach ‘allowed them to do in hours what would usually take days, and match the adversary’s speed’.
Monitoring today shouldn’t only be thought of as “what critical set of alerts I need to keep my services up?” but also as “how can I make my infrastructure easily queryable by humans and LLMs?”. To borrow a term from the LLM lexicon: “where do I store my infrastructure’s context?”
Where to store context?
You might think: just let a team member or an LLM fetch the data manually when an incident happens. SSH into the server, look up the logs with journalctl, tail some NGINX log file, whatever. But it falls apart fast. You’d have to provision access, through dedicated users or credentials. You’d be handing an LLM full access to a production server. And even then you’d be missing context: past metrics you weren’t recording are gone forever.
It’s much easier when context is centralized in a remote store that gathers data from all your servers behind one queryable interface. It solves the access problem and LLMs only access a record of the production environment, not the production itself. Search space becomes bounded, which is great for an LLM since it can’t wander off into useless corners. And the history is there - allowing you to check current values against historical averages.
But this only answers the question of “how does an investigator reach the data?”. The other question - “what data is there to reach?” - matters even more.
Why is context important?
A simple example. Let’s say you run an hourly/daily DB restore test.
Usually you’d have some kind of monitoring set up. If it fails, you get a ping. That’s already good. But it tells you nothing about why it failed. And that could make a huge difference. The restore VM ran out of disk or the network blipped for a minute? Then it’s not critical. But if the error is a corruption message from your DB, then it becomes critical.
So even for a simple cron job, having context about the job itself and the host machine is a huge improvement.
Another example. Let’s say you’re running a website behind an NGINX server.
To catch DDoS attacks or large-scale scraping, you watch the request rate metrics and set alerts around them. When the alert fires, you know something is happening. But that isn’t enough.
Collect the NGINX logs too, and you can figure out what kind of attack it is and which endpoints it’s targeting.
Collect host server metrics like CPU, network or disk usage, and you can figure out if the attacker is just pulling static assets from cache, or if your server is genuinely struggling and at risk.
And you can go one layer deeper. Collect the response times behind NGINX too, and you can figure out if the attack is actually hurting your users, or not making a dent at all.
This is why teams should strive to have as much context as possible when thinking about their monitoring architecture. Alert-driven monitoring is about making sure every alert is worth investigating. Context-driven monitoring on the other hand is making sure every alert can be investigated.