How to monitor your home lab with one command?

You could spend your weekend calculating storage retention for Prometheus and writing alerting rules in YAML, or you could simply run one command.

The Homelab Dilemma

Every homelabber eventually faces a choice: spend the weekend wrestling with YAML, or use a tool that works in seconds.

The DIY Route

The "From Scratch" Stack

Prometheus
+
Grafana

Typically involves spinning up Prometheus for metrics, Grafana for visualization, Alertmanager for notifications, and deploying Node Exporter on every container and VPS.

High Maintenance: You are now the sysadmin for your monitoring stack. Updates, breaking changes, and storage management are on you.
Configuration Heavy: Expect to spend hours writing YAML configuration files and tweaking PromQL queries.
Resource Heavy: Running 5+ execution-hungry containers to monitor a single server is a waste of your homelab's resources.
The Simple Route

Simple Observability

curl -fsSL https://simpleobservability.com/install.sh | sudo bash -s -- <SERVER KEY>

A lightweight, single-binary agent that installs in seconds. It provides unified visibility into your metrics, logs, and cron jobs through a single, intuitive interface—with no complex configuration or inbound ports required.

Zero Maintenance: We handle the backend, storage, and upgrades. You focus on building your lab, not managing your monitoring stack.
Unified Visibility: Metrics, Logs, and Cron jobs in one cohesive UI. No more jumping between different dashboards and tools.
Push-Only Security: No inbound ports to open or firewall rules to manage. The agent sends data securely over HTTPS.

Set up your homelab monitoring in under 2 minutes

01

Install the agent

Install our open-source agent with a single command.
UI install process
02

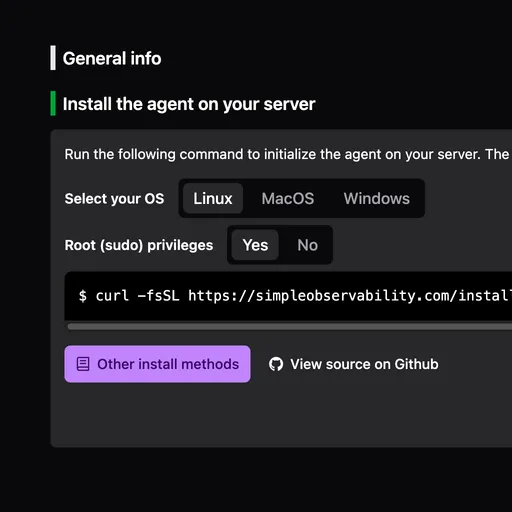
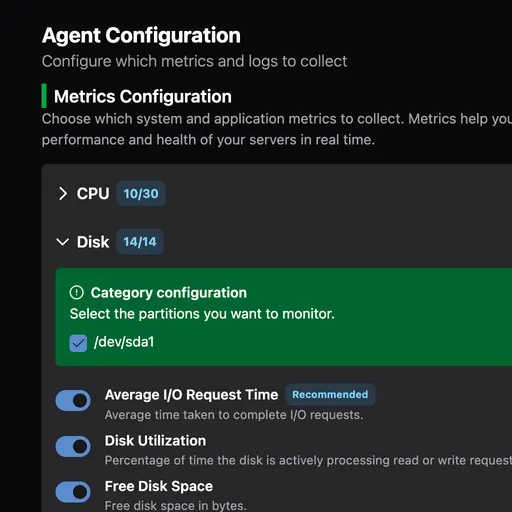
Configure from the UI

Manage everything from the web interface. No config files needed.
UI config process
03

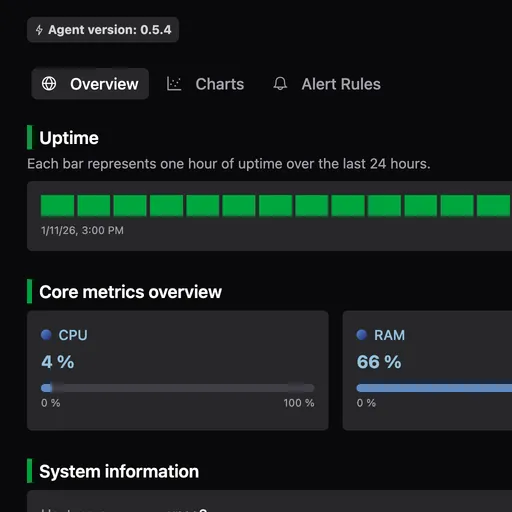
Get instant insights

Access ready-to-use reports and alerts.
UI process done

Everything you need to run your infrastructure

Simple Observability gives you all the essential tools to monitor your servers, logs, and background jobs effectively.

Metrics

Metrics

Track CPU, RAM, disk, and network with minimal overhead.

Logs

Logs

Centralize and search logs without setting up pipelines.

Cron Monitoring

Cron Monitoring

Track execution, duration, and exit codes. Get alerted on failures.

Alerts

Alerts

Set threshold-based alerts. Integrates with Slack, Discord, and other channels.

Why Simple Observability is the best monitoring solution for your servers?

One command install
Deploy our open-source agent with a single command. No complex setup procedures.
Web UI configuration
Configure everything through our intuitive interface. No more editing wrestling with configuration syntax.
Unified monitoring
Get the full picture with metrics and logs in one unified system.
Ready-to-use reports
Access meaningful insights immediately. No need to build complex dashboards. We extract what matters.
Customizable alerting
Set up notifications for critical events like disk space issues or unusual server activity. Stay ahead of problems before they impact your services.
Mobile App
Monitor your infrastructure from anywhere. Access reports and alerts directly from your phone to stay informed on the go.

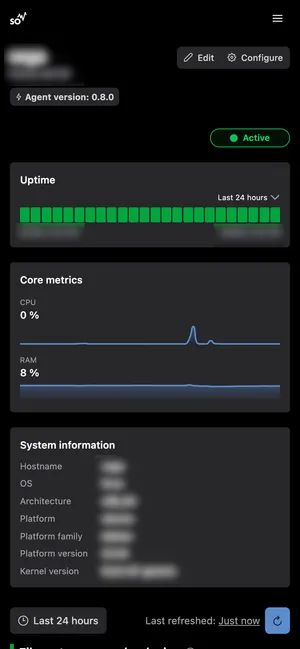
A look inside Simple Observability UI

Instantly see how Simple Observability helps you monitor and troubleshoot, all from a single UI.

Open Source & Transparent Agent

Our open source agent collects logs and metrics from your servers. You can audit the code, see exactly what it collects, and build it from source.

Keep an eye on your servers from anywhere

Mobile-friendly dashboard
Mobile-friendly dashboards
Respond to alerts from your phone
No install needed
Just add to your home screen

Lightweight is a metric,
not an adjective.

“Lightweight” isn’t a promise, it’s something we measure.

simob is built to have a minimal footprint, with close attention to memory usage and CPU consumption, so monitoring stays out of the way of your workloads.

simob-agent.service
CPU Usage
< 0.3 %
1 core utilization
Memory
< 12 MB
Resident Set Size (RSS)
Binary Size
< 10 MB
Static, no deps
Disk I/O
< 0.2 kB/s
Minimal, low-frequency writes

Complete observability, simplified

Simple Observability delivers all essential monitoring capabilities in one streamlined package. We've eliminated the complexity while keeping the powerful features you need to maintain reliable systems.

Stop cobbling together multiple tools and managing complicated stacks.

Customizable Graphs
In addition to ready-to-use reports, create custom visualizations tailored to your specific monitoring needs.
Query Your Data
Powerful search functionality to find specific metrics and logs across your entire infrastructure.
Alerts
Configure precise alert conditions for events that matter to your operations. Get notified when thresholds are crossed.
Webhooks
Connect alerts to your existing workflow. Integrations with Discord, Slack, email, SMS, and more ensure notifications reach you wherever you work.
Mobile App
Progressive Web App to monitor your servers from anywhere. Keep your infrastructure at your fingertips.
Automatic Updates
Our agent automatically updates itself with the latest features and security patches. No maintenance required on your part.
Clear Pricing
Fixed pricing with no surprises. No usage-based charges, no worrying about log volume spikes. What you see is what you pay
Support
Whether you're running mainstream Linux distros or the most esoteric OS variants, our team will help you get monitoring up and running.

Zero Inbound Ports.

Most monitoring agents require you to poke holes in your firewall or manage complex access lists.
We don't. simob strictly pushes data outbound. Your firewall stays completely closed.

Your Server Inbound: CLOSED
Outbound HTTPS
Our Cloud Ingestion API

Built-in Metrics and Log Sources

Choose from a curated set of reliable data sources embedded within the agent. Activate only the metrics and logs relevant to your environment with a simple toggle in the UI. No extra installs needed.

CPU

Collect detailed CPU time spent across all task categories and individual cores.

What it collects

  • CPU time for user, system, idle, and other states
  • Per-core utilization breakdown

Why it matters

  • Detect CPU overloads and unusual usage patterns
  • Understand how workloads distribute across cores

Disk

Monitor disk space, inode statistics, and I/O activity.

What it collects

  • Total, used, and free disk space & inodes
  • Read/write throughput and operations per second
  • Disk utilization

Why it matters

  • Prevent disk full errors or inode exhaustion risks
  • Identify I/O bottlenecks and disk latency

Memory

Collect key memory metrics including available, used, and total memory.

What it collects

  • Available, used, and total memory

Why it matters

  • Detect memory shortages and leaks
  • Prevent OOM errors

Network

Track network traffic, errors, and packet rates.

What it collects

  • Bytes sent and received per second
  • Packets sent and received rates
  • Input/output error and drop rates

Why it matters

  • Detect network bottlenecks and failures
  • Monitor traffic volume and quality

NGINX

Collect metrics from the NGINX web server status endpoint.

What it collects

  • Active, reading, writing, and waiting connections
  • Request rate

Why it matters

  • Detect traffic spikes, overload, or idle states
  • Monitor connection handling efficiency

Swap

Collect key swap metrics including total, used, free, and usage ratio.

What it collects

  • Total, used, and free swap

Why it matters

  • Detect excessive swapping that slows down the system
  • Identify when physical memory is insufficient

Apache

Collect access logs with details on requests, response codes, referrers, and client information.

What it collects

  • Access logs with request paths, status codes, user agents, and referrers

Why it matters

  • Understand traffic sources and request trends

NGINX

Collect detailed HTTP request logs with status codes, response times, client IPs, and user agents.

What it collects

  • Full HTTP request entries including status codes, path, user agent strings, etc.

Why it matters

  • Spot error spikes and latency issues
  • Monitor traffic patterns and client behavior

Systemd Journal

Collect structured log data from the systemd journal.

What it collects

  • System, kernel, and service logs with metadata

Why it matters

  • Centralized view of all low-level system activity and service health
  • Efficiently filter and search logs using systemd metadata

Windows Event Logs

Collect and translate Windows security events into human-readable logs with structured metadata.

What it collects

  • Authentication and system security events from the Security channel
  • Translated event descriptions and extracted field metadata

Why it matters

  • Audit logins, permission changes, and security-relevant activity
  • Simplify Windows event analysis by removing cryptic codes and noise

Runs Anywhere, No Hassle

Our open-source agent works on all major Linux distributions and Windows, and supports a wide range of CPU architectures.
Linux
Windows
Ubuntu
Debian
Archlinux
Alpine

Stop worrying about your monitoring stack.

Get back to building your homelab. We'll handle the observability.

No credit card required