Monitor your servers and websites with one single command.
Keep your infrastructure and endpoints running reliably without wasting hours maintaining complex monitoring setups or paying for multiple fragmented SaaS subscriptions.
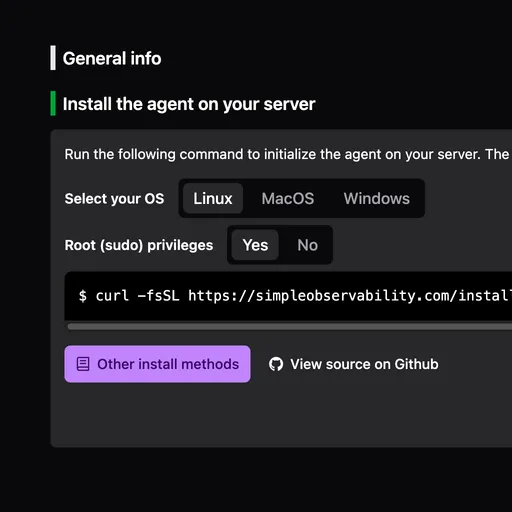
curl -fsSL https://simpleobservability.com/install.sh | sudo bash -s -- <SERVER KEY>Native support for Windows and all major Linux distributions
Set up monitoring in under 2 minutes
Install the agent in one command, configure everything from the web UI, and start receiving metrics and logs instantly.
Install the agent
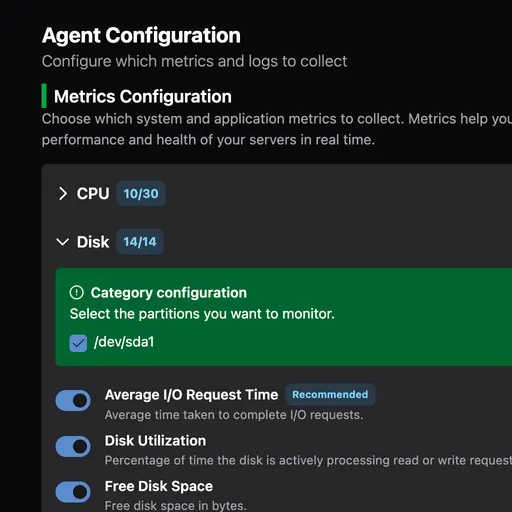
Configure from the UI
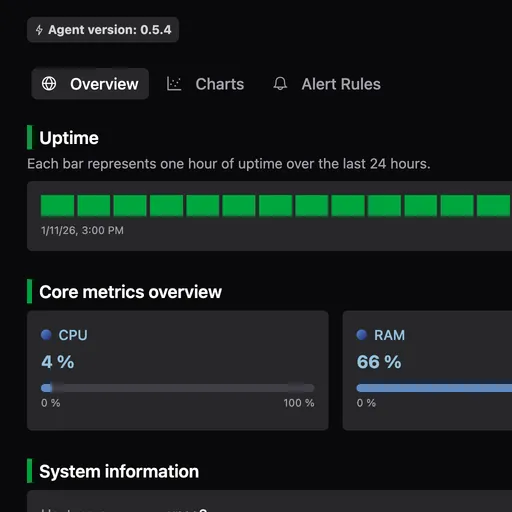
Get instant insights
Infrastructure OS
A unified platform to monitor your entire infrastructure, from servers to websites.
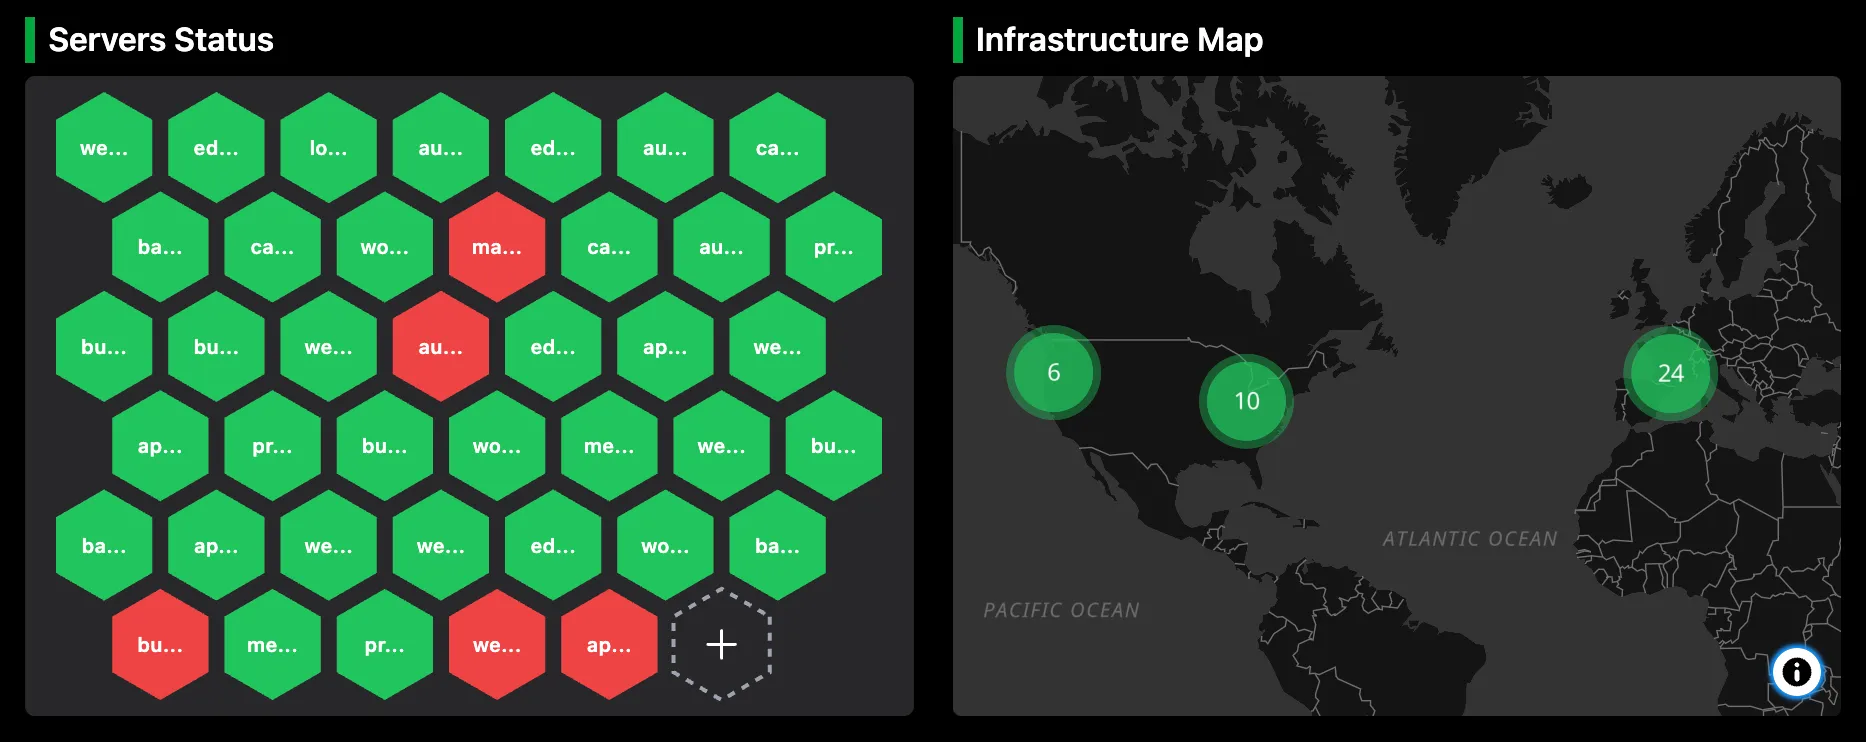
Monitor all your servers in one place
Track your entire fleet across cloud providers and on-premise servers from a single dashboard. The lightweight agent installs in seconds and supports both Linux and Windows with zero dependencies.
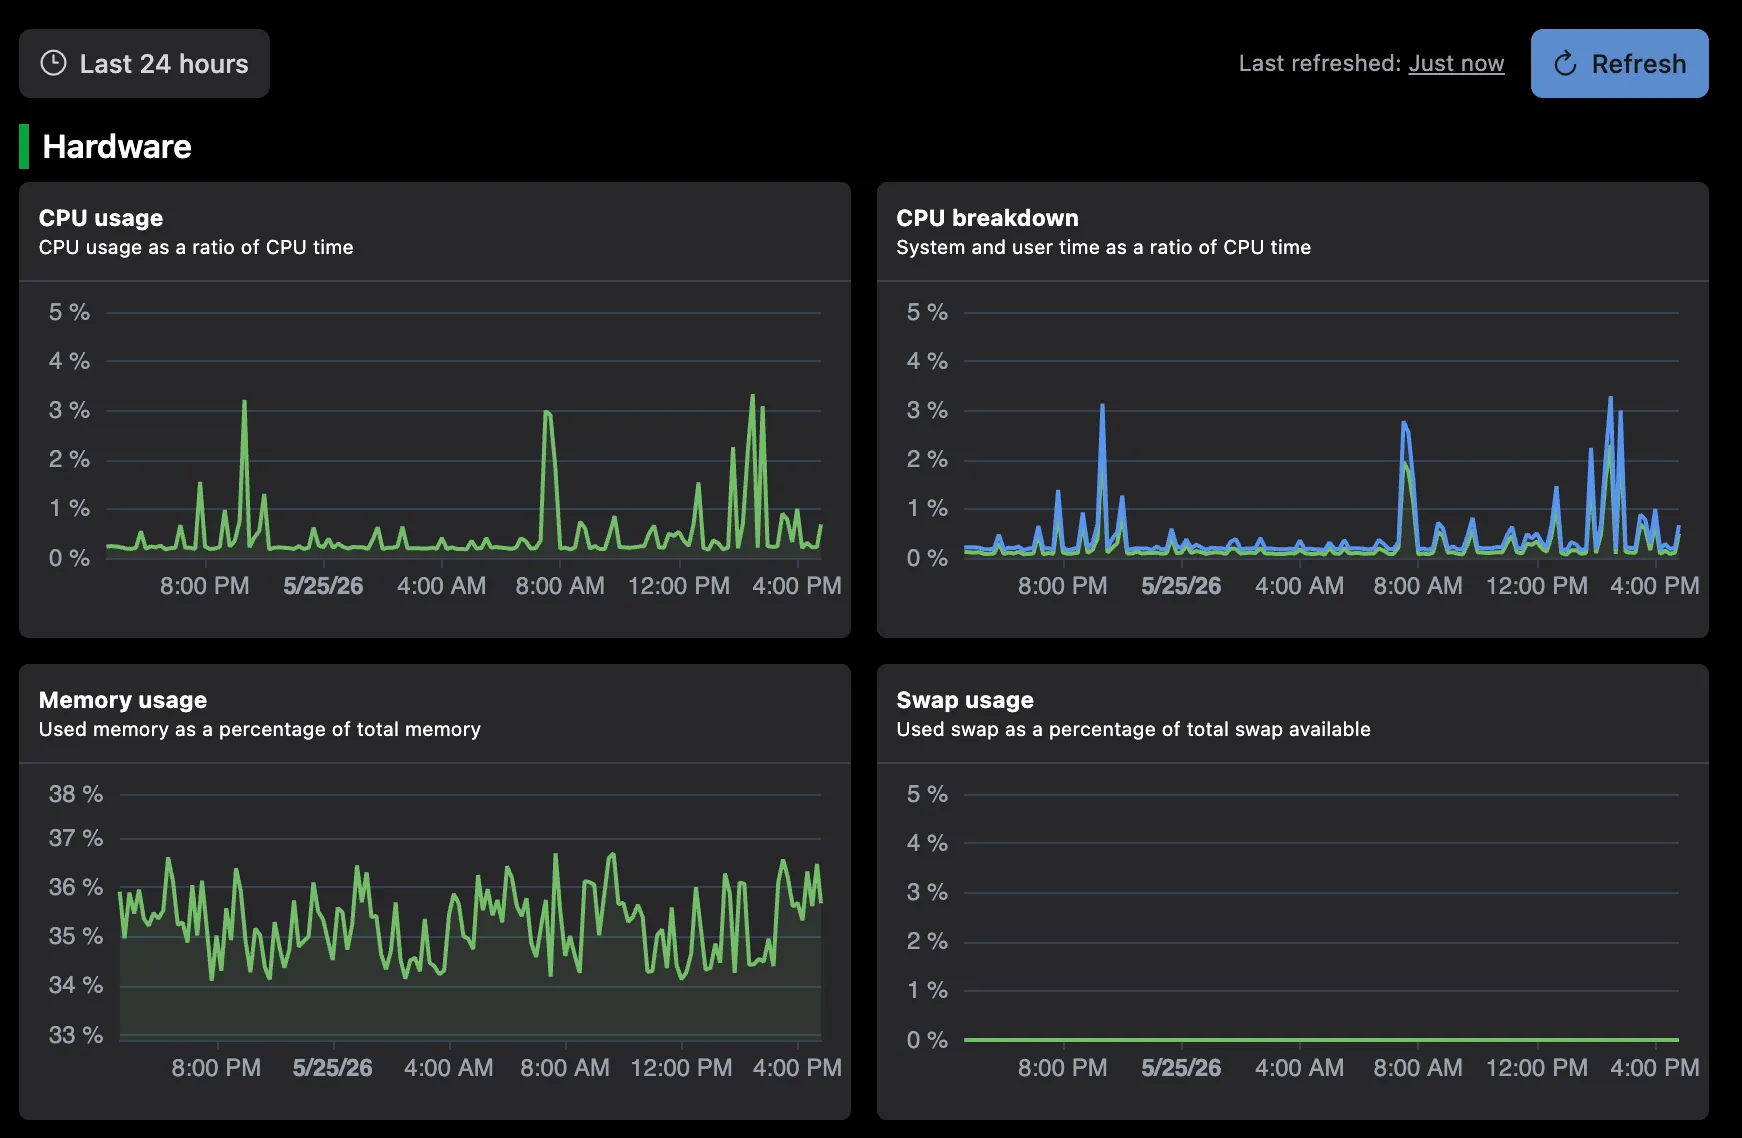
Automatic metrics and dashboards
Get instant visibility into CPU, memory, and disk usage. The agent automatically detects services like NGINX or Docker and populates your dashboard with predefined charts so you never have to build them yourself.
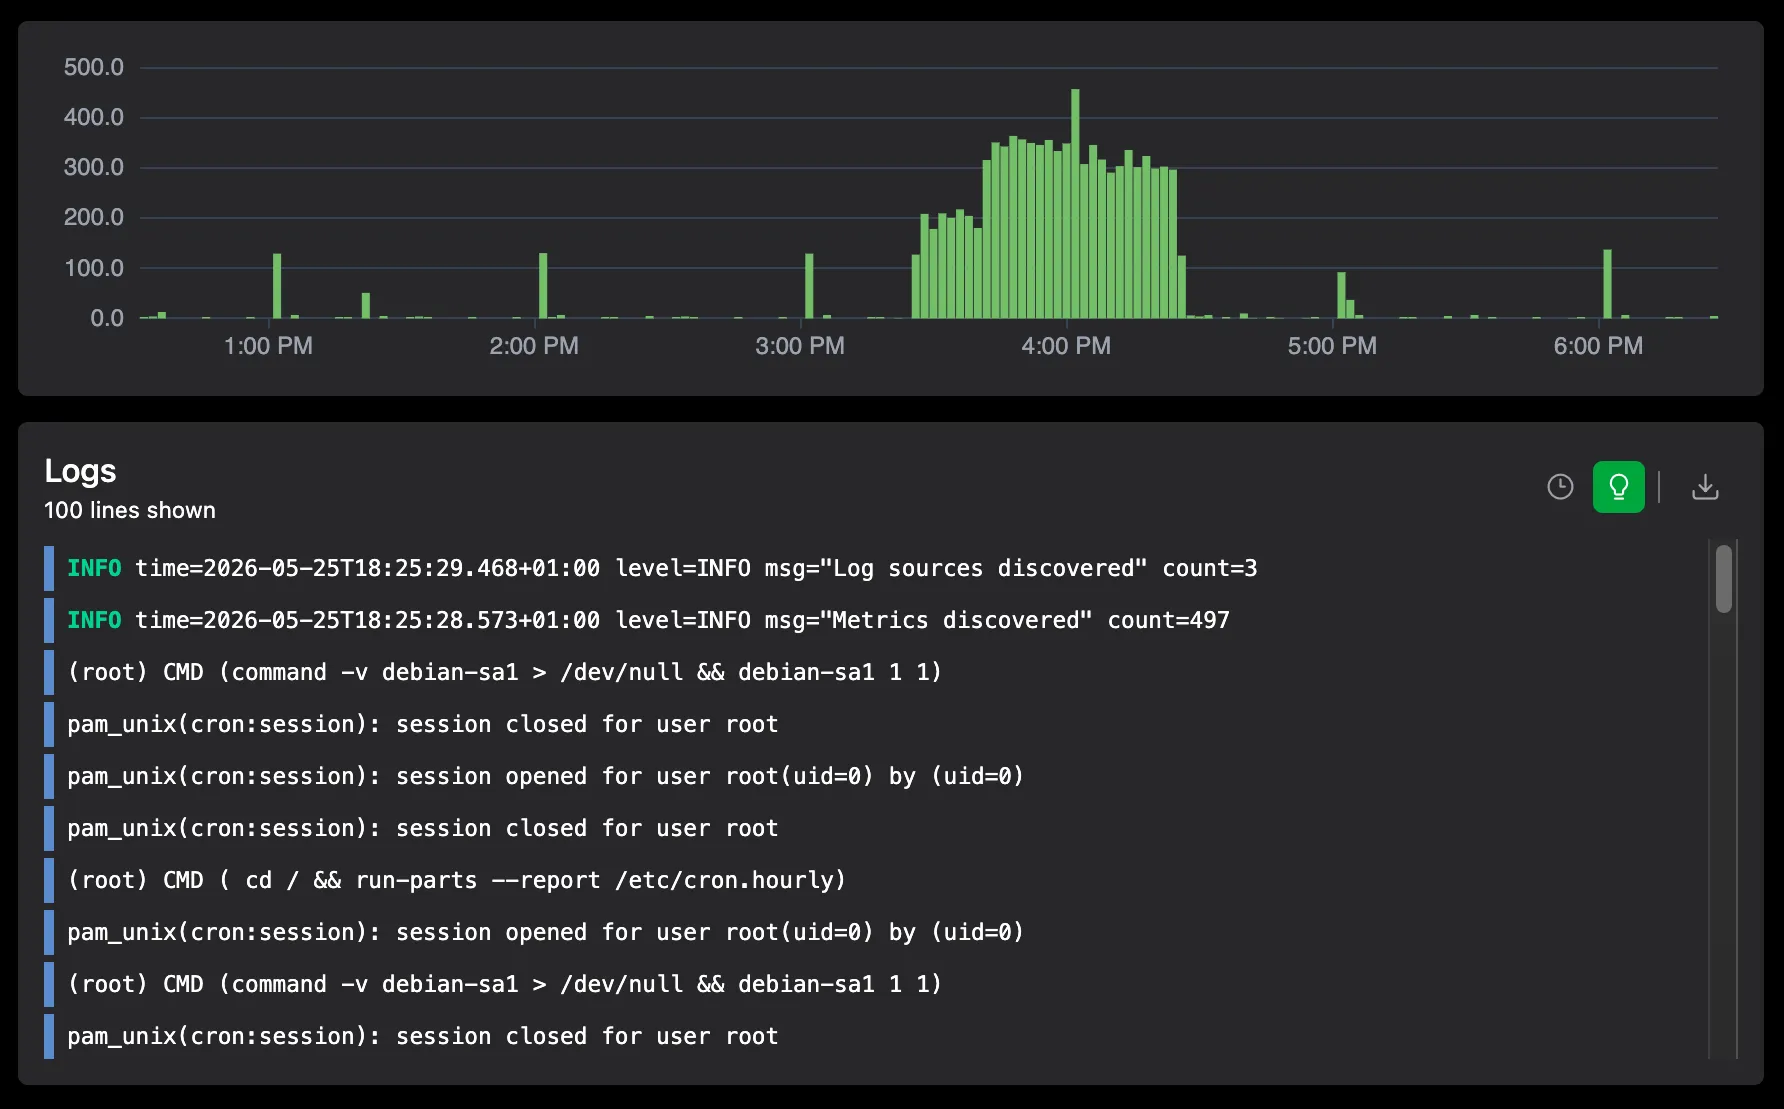
System and server logs
Search through Linux and Windows system logs in a single web interface. Access and filter logs across your entire infrastructure to find exactly what you need.
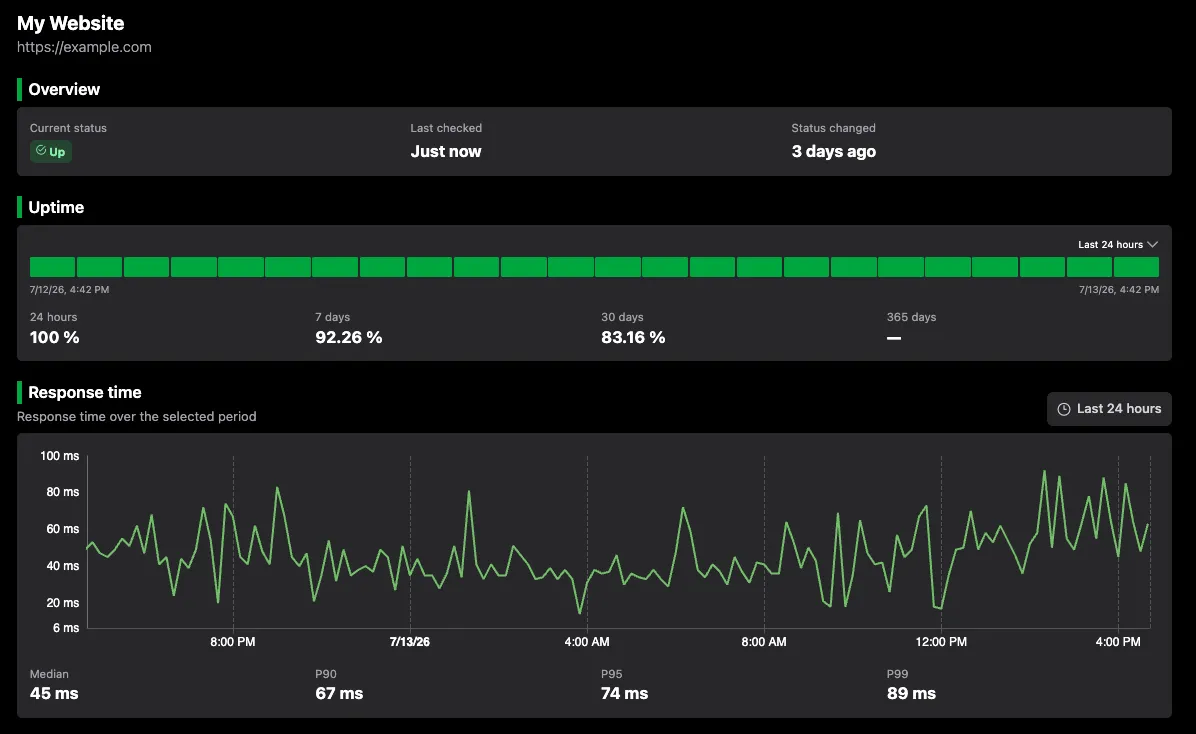
Monitor your websites and APIs
Check the uptime and response time of your websites and API endpoints from the same dashboard as your servers. Get alerted the moment a check fails, with no extra tool to configure.
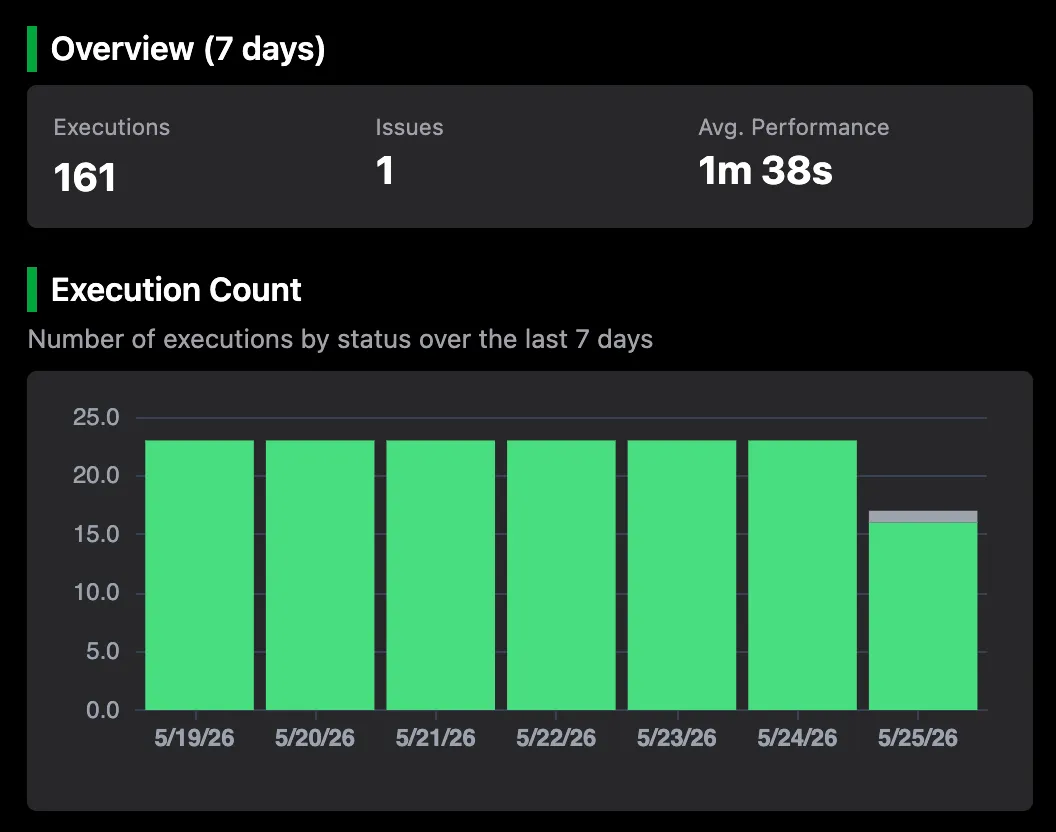
Reliable cron job tracking
Monitor scheduled tasks and background workers with ease. See execution status, run duration, and capture output logs for every job to ensure your processes are running as expected.
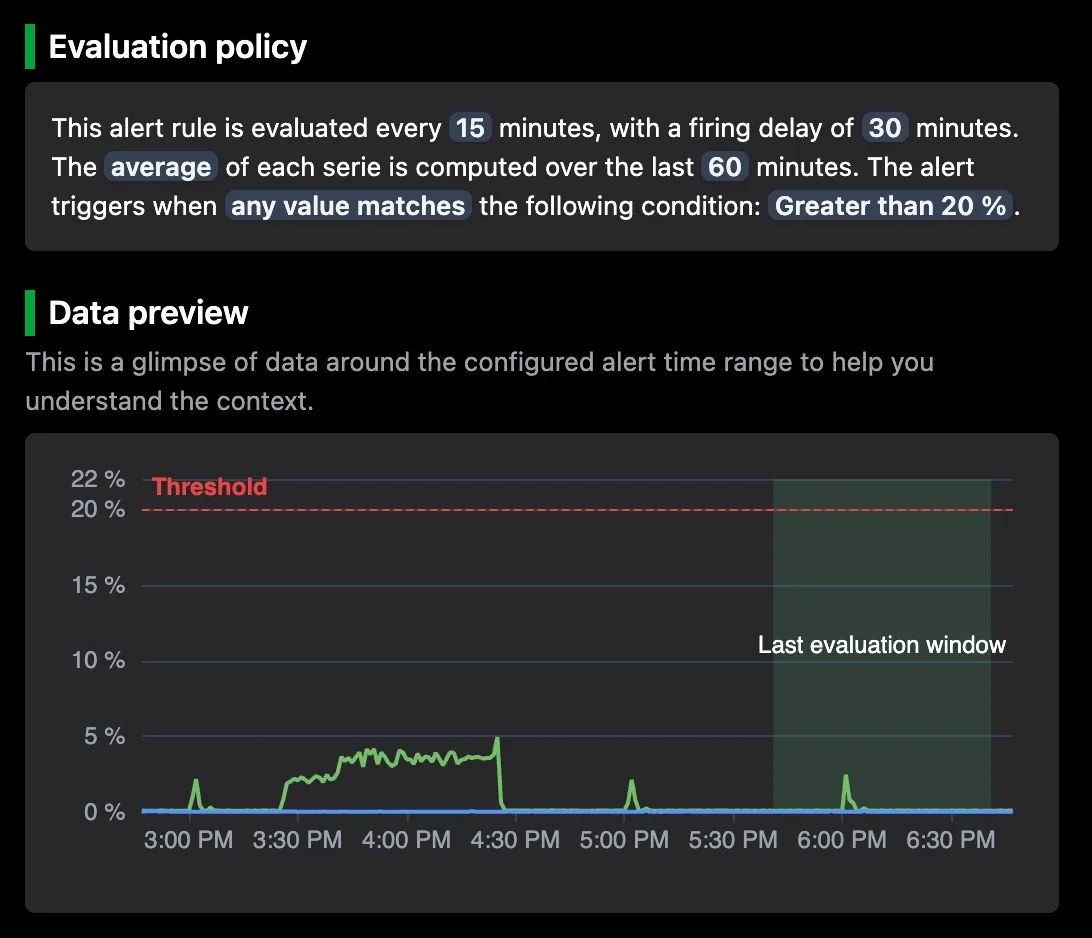
Alert rules
Get notified via Slack, Discord, or email before your users notice a problem. Use our catalog of pre-configured alert templates to protect your systems without building a complex alerting stack.
A look inside Simple Observability UI
Instantly see how Simple Observability helps you monitor and troubleshoot, all from a single UI.


Using your own Prometheus or Loki?
Maintain full data ownership with our BYOS plan.
Works with your entire stack
Simple Observability comes with dozens of built-in integrations for your favourite tools. Zero configuration required, just toggle and go.


Simple Monitoring. Simple Pricing.
Frequently Asked Questions
Get a professional monitoring stack in seconds
Stop maintaining complex setups or paying for fragmented subscriptions. Simple Observability delivers an instant, out-of-the-box solution.