Your monitoring dashboards in one single command.
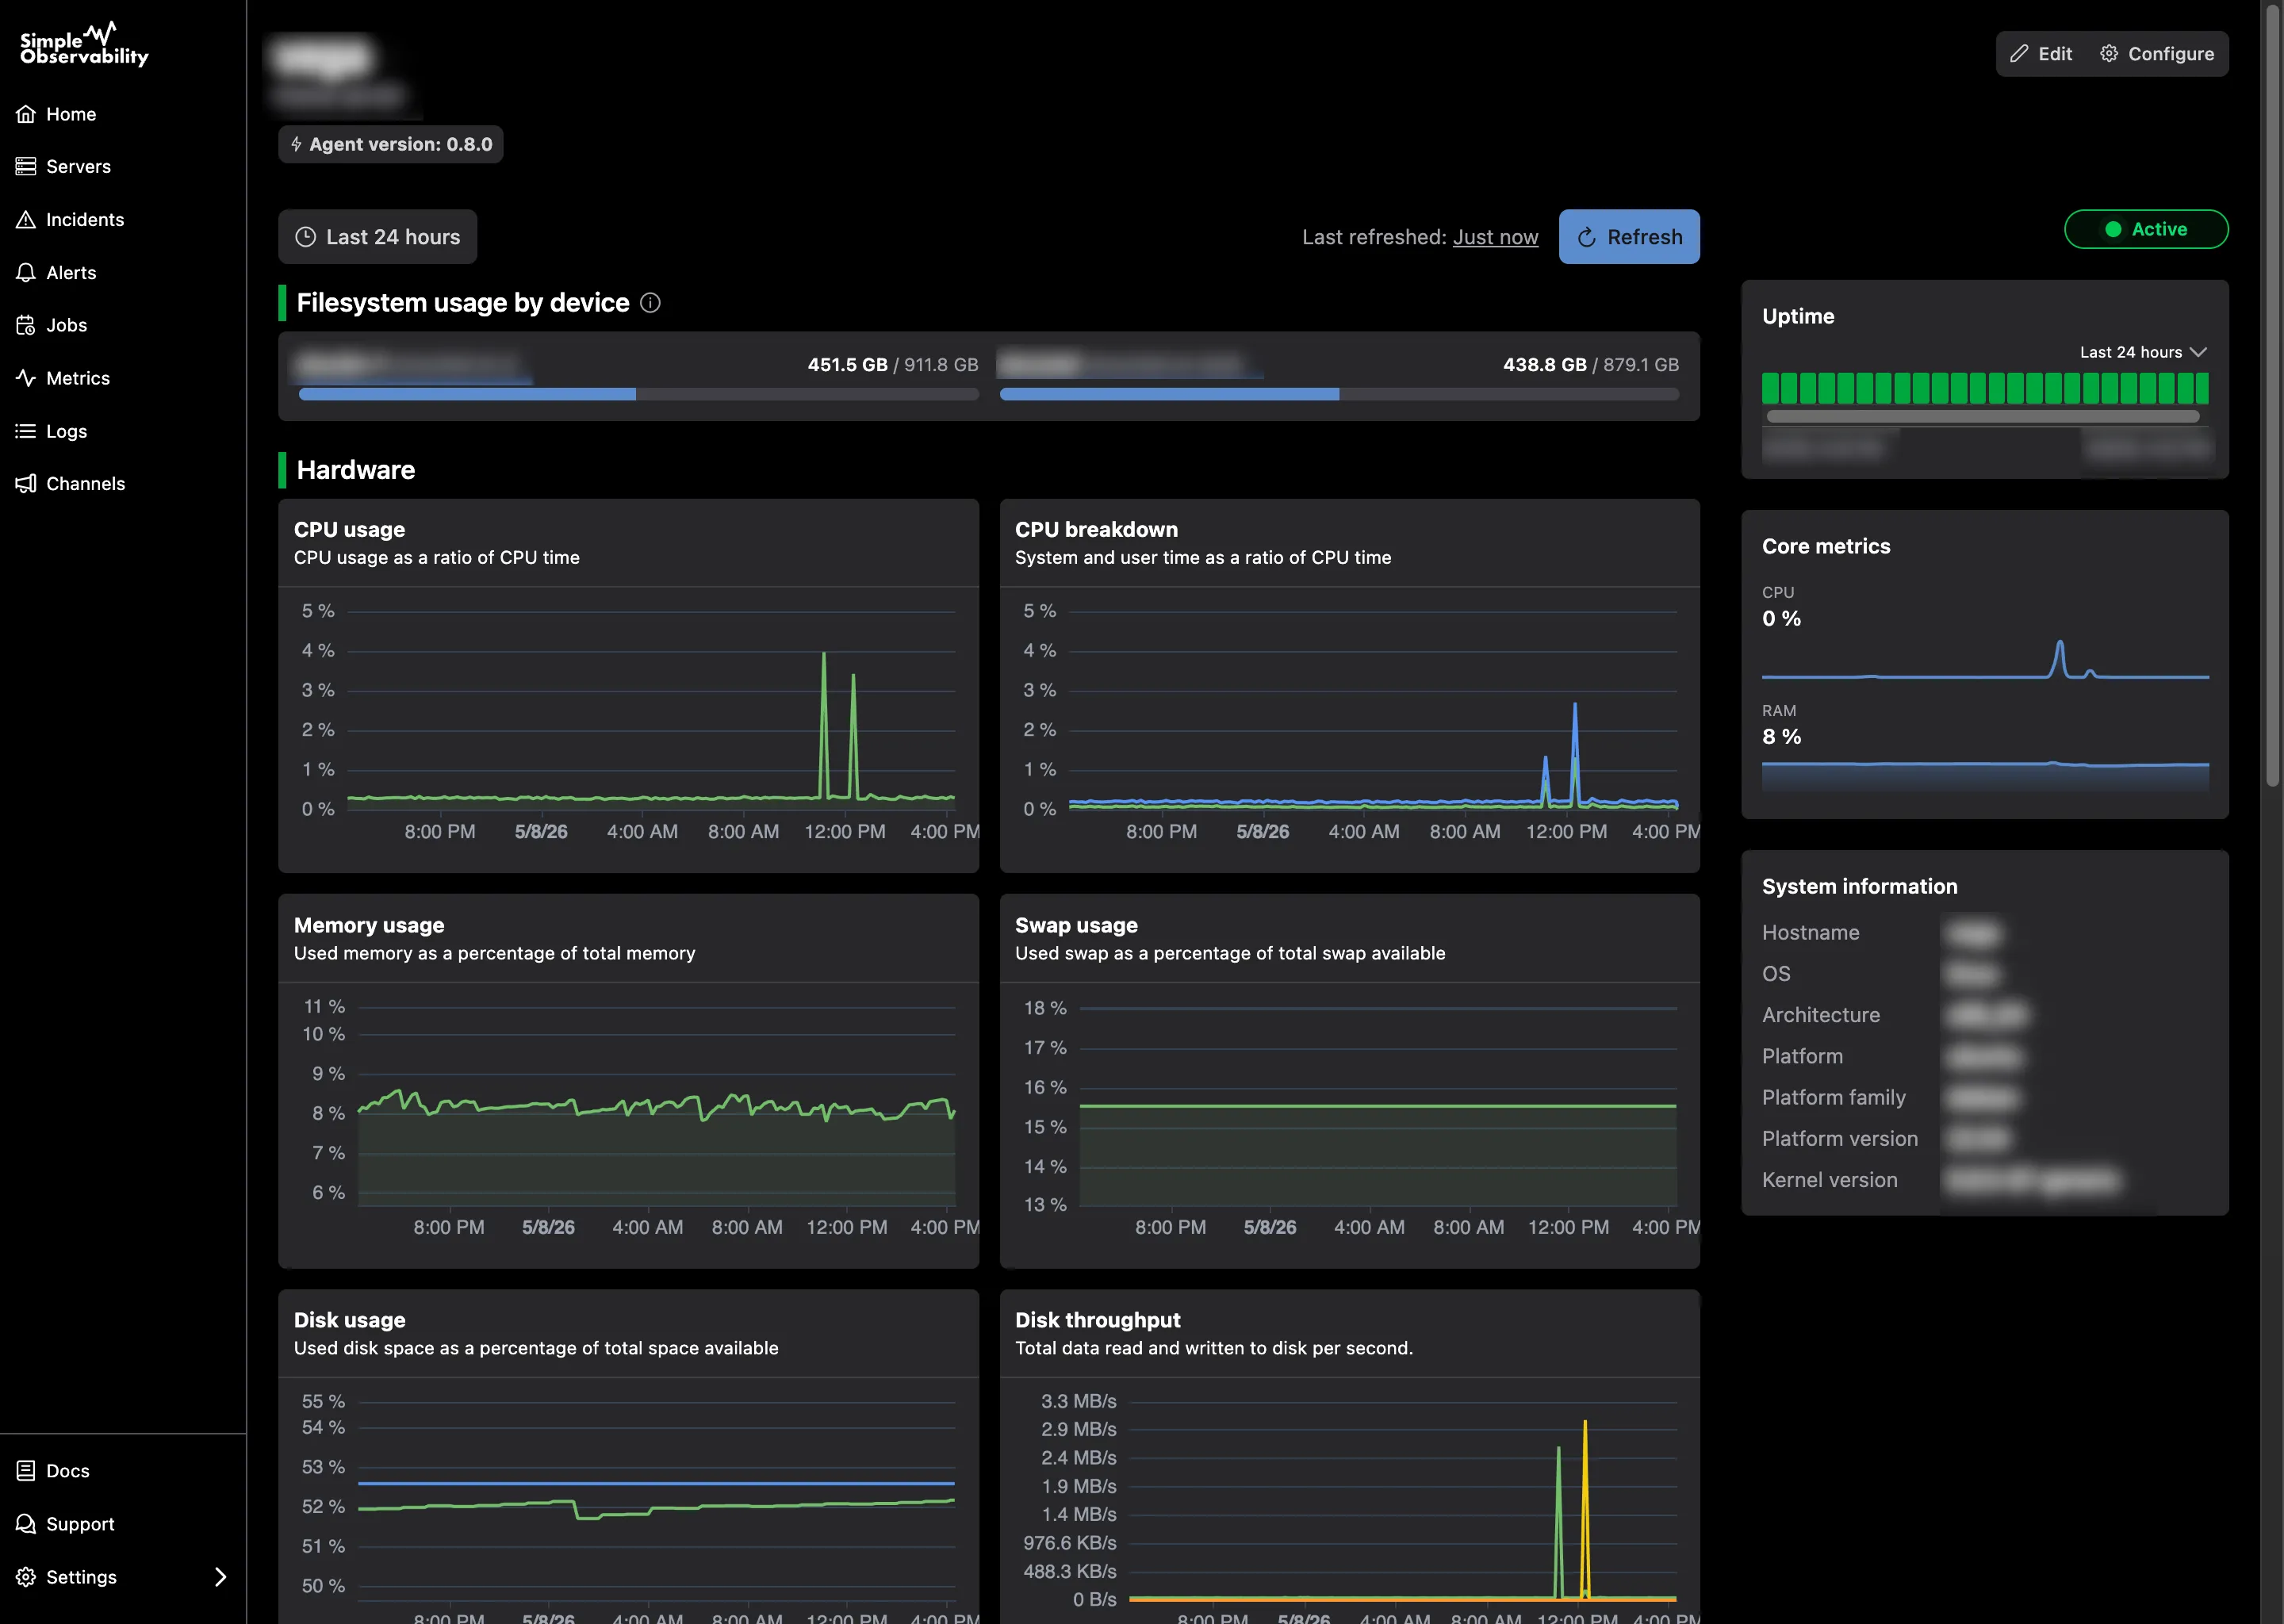
Metrics without the setup
Everything you need to understand a server's load, collected automatically and ready the moment you open a host.
Works with your entire stack
Simple Observability comes with dozens of built-in integrations for your favourite tools. Zero configuration required, just toggle and go.


Install in one command
Run a single command on each server. The agent registers itself and starts sending metrics over HTTPS. CPU, memory, disk, and network charts appear within the first minute, with nothing to configure.
curl -fsSL https://simpleobservability.com/install.sh | sudo bash -s -- <SERVER KEY>.\install.ps1 -ApiKey <SERVER KEY>Beyond metrics and dashboards
Everything below comes bundled in the same platform, no extra setup required.
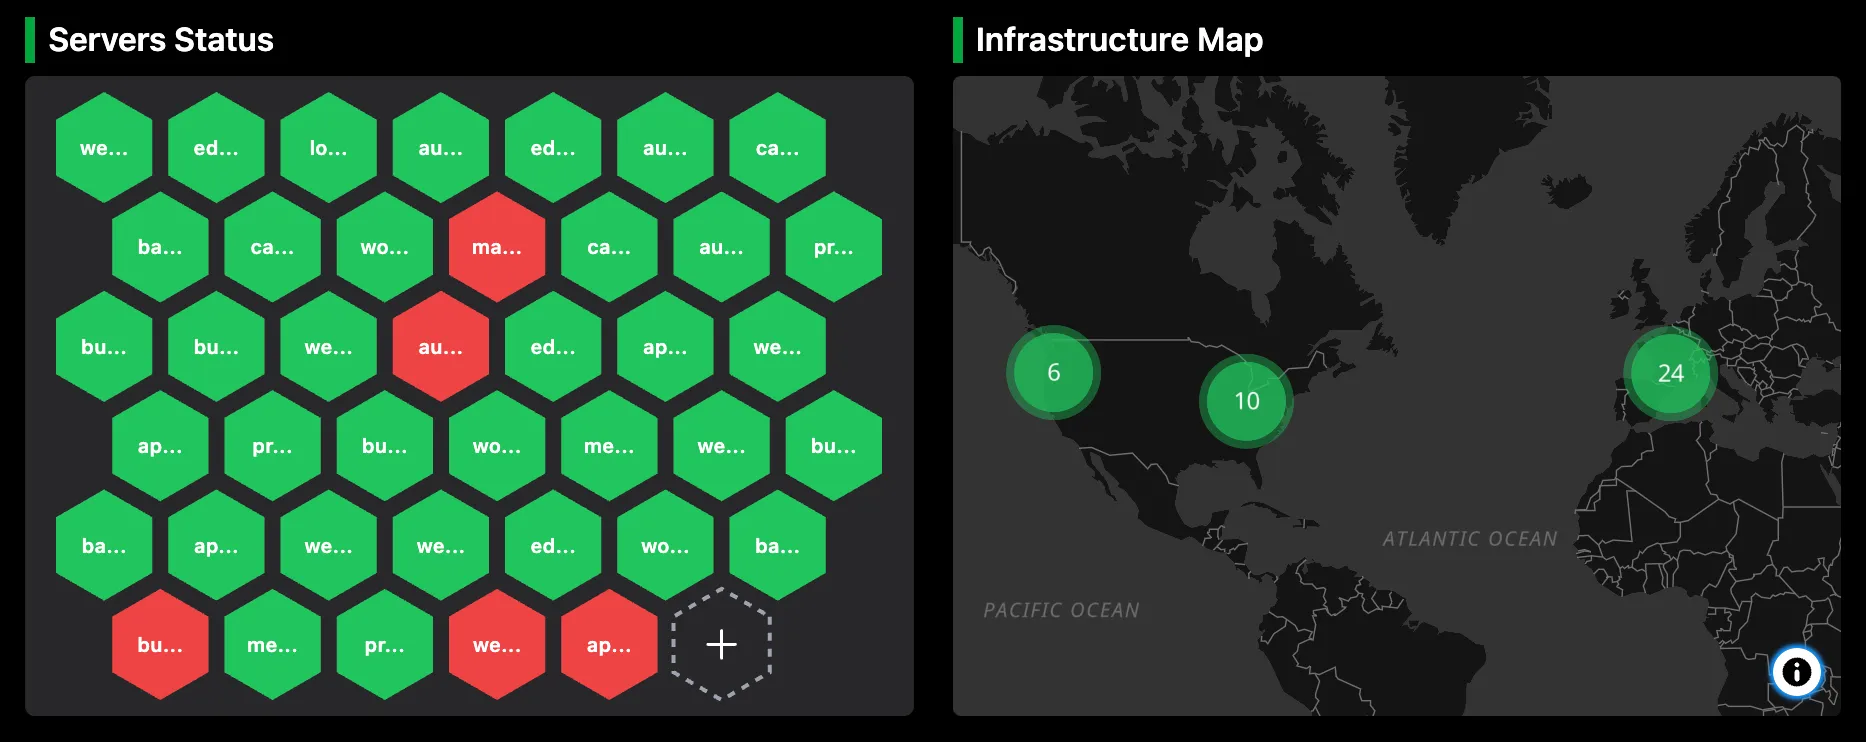
Server monitoring
Every server across cloud providers, VPS hosts, and on-premise hardware in a single dashboard.
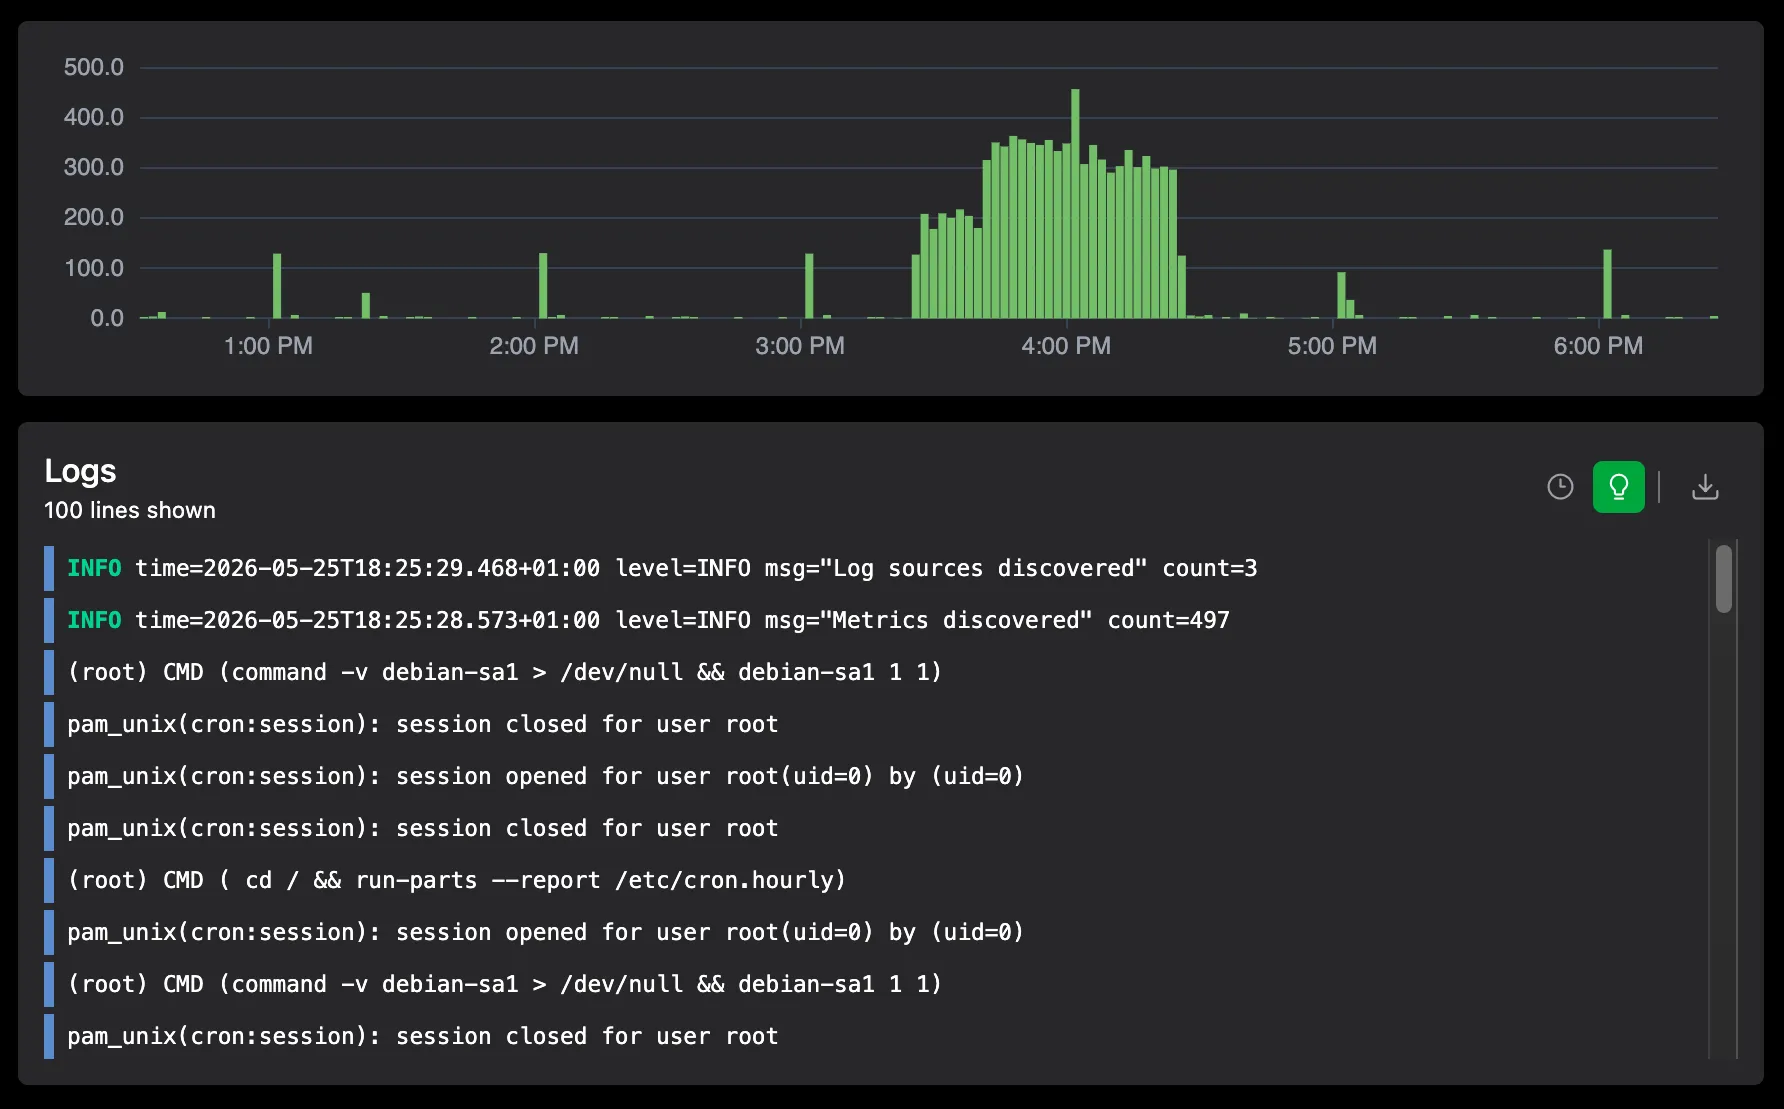
Logs
Search Linux and Windows system logs across your entire fleet in one place.
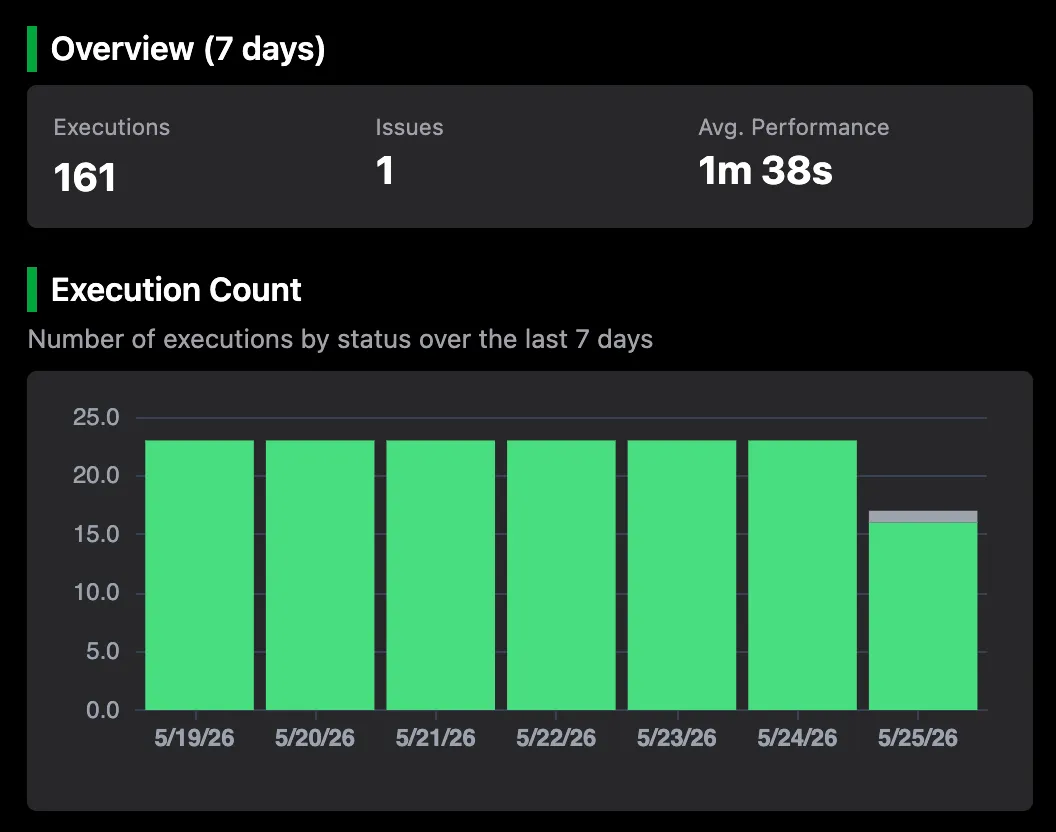
Cron monitoring
Track scheduled jobs with execution status, duration, and output logs.
Frequently Asked Questions
See your metrics in minutes
Install the agent on each server and get prebuilt dashboards for CPU, memory, disk, and any service you enable. No charts to build, no config to maintain.