Monitor your VPS with one single command.

Powerful monitoring, without the setup complexity. Without the configuration headaches. Just install and get insights instantly.
curl -fsSL https://simpleobservability.com/install.sh | sudo bash -s -- <SERVER KEY>
Get Started
No credit card required

With us, server monitoring is easy

01

Install the agent

Download and install our open-source agent with a single command.
02

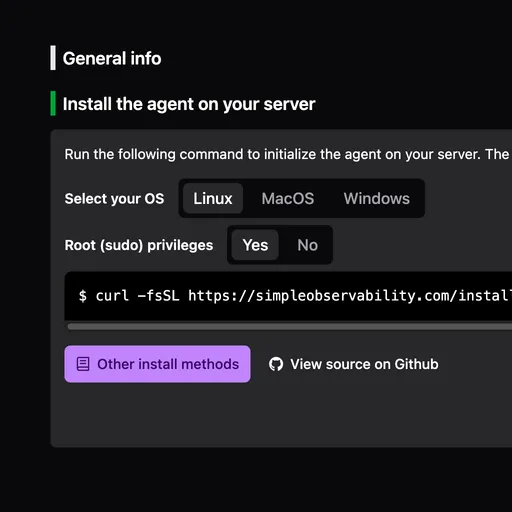
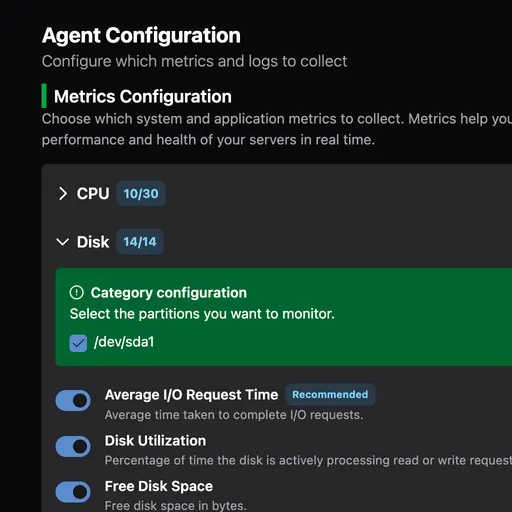
Configure from the UI

Manage everything from the web interface. No config files needed.
03

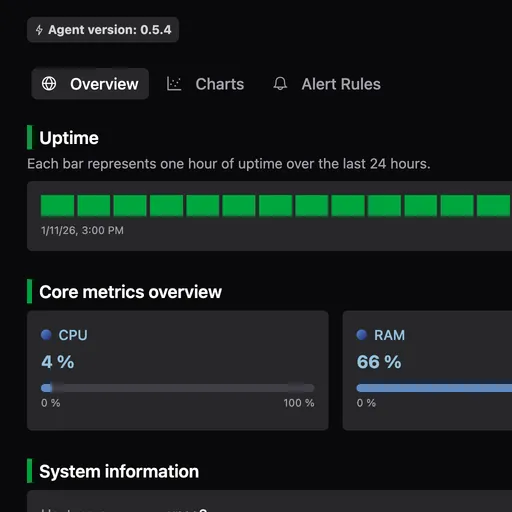
Get instant insights

Access ready-to-use reports and alerts that show exactly what’s going on with your servers, in real time.
Metrics and logs illustration

Your VPS full picture: metrics and logs in one place.

Store, search, explore, and visualize all your server metrics and logs in one unified platform.
Alerts illustration

Get alerted before things break.

Define alerts in seconds based on metrics or logs. Choose your thresholds, get notified instantly, and never miss something critical again.

Why Simple Observability is the best monitoring solution for your VPS?

One command install
Deploy our open-source agent with a single command. No complex setup procedures.
Web UI configuration
Configure everything through our intuitive interface. No more editing wrestling with configuration syntax.
Unified monitoring
Get the full picture with metrics and logs in one unified system.
Ready-to-use reports
Access meaningful insights immediately. No need to build complex dashboards. We extract what matters.
Customizable alerting
Set up notifications for critical events like disk space issues or unusual server activity. Stay ahead of problems before they impact your services.
Mobile App
Monitor your infrastructure from anywhere. Access reports and alerts directly from your phone to stay informed on the go.

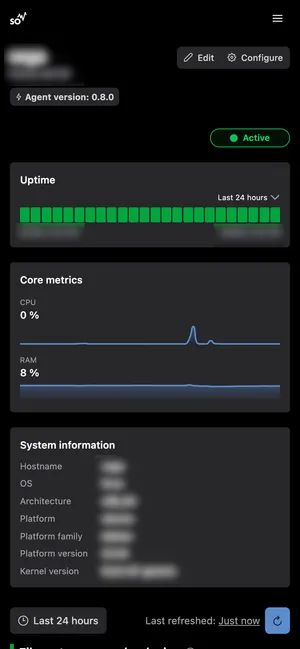
A look inside Simple Observability UI

Instantly see how Simple Observability helps you monitor and troubleshoot, all from a single UI.
Server dashboard
UI showing configuration interface
Metrics viewer
Logs viewer

Open Source & Transparent Agent

Our open source agent collects logs and metrics from your servers. You can audit the code, see exactly what it collects, and build it from source.

Keep an eye on your VPS from anywhere

Alerting UI on mobile
Mobile-friendly dashboards
Respond to alerts from your phone
No install needed
Just add to your home screen

Complete observability, simplified

Simple Observability delivers all essential monitoring capabilities in one streamlined package. We've eliminated the complexity while keeping the powerful features you need to maintain reliable systems.

Stop cobbling together multiple tools and managing complicated stacks.

Customizable Graphs
In addition to ready-to-use reports, create custom visualizations tailored to your specific monitoring needs.
Query Your Data
Powerful search functionality to find specific metrics and logs across your entire infrastructure.
Alerts
Configure precise alert conditions for events that matter to your operations. Get notified when thresholds are crossed.
Webhooks
Connect alerts to your existing workflow. Integrations with Discord, Slack, email, SMS, and more ensure notifications reach you wherever you work.
Mobile App
Progressive Web App to monitor your servers from anywhere. Keep your infrastructure at your fingertips.
Automatic Updates
Our agent automatically updates itself with the latest features and security patches. No maintenance required on your part.
Clear Pricing
Fixed pricing with no surprises. No usage-based charges, no worrying about log volume spikes. What you see is what you pay
Support
Whether you're running mainstream Linux distros or the most esoteric OS variants, our team will help you get monitoring up and running.

Built-in Metrics and Log Sources

Choose from a curated set of reliable data sources embedded within the agent. Activate only the metrics and logs relevant to your environment with a simple toggle in the UI. No extra installs needed.

CPU

Collect detailed CPU time spent across all task categories and individual cores.

What it collects

  • CPU time for user, system, idle, and other states
  • Per-core utilization breakdown

Why it matters

  • Detect CPU overloads and unusual usage patterns
  • Understand how workloads distribute across cores

Memory

Collect key memory metrics including available, used, and total memory.

What it collects

  • Available, used, and total memory

Why it matters

  • Detect memory shortages and leaks
  • Prevent OOM errors

Network

Track network traffic, errors, and packet rates.

What it collects

  • Bytes sent and received per second
  • Packets sent and received rates
  • Input/output error and drop rates

Why it matters

  • Detect network bottlenecks and failures
  • Monitor traffic volume and quality

Disk

Monitor disk space usage and inode statistics.

What it collects

  • Total, used, and free disk space
  • Total, used, and free inodes

Why it matters

  • Prevent disk full errors and slowdowns
  • Track inode exhaustion risks for large file systems

NGINX

Collect detailed HTTP request logs with status codes, response times, client IPs, and user agents.

What it collects

  • Full HTTP request entries including status codes, path, user agent strings, etc.

Why it matters

  • Spot error spikes and latency issues
  • Monitor traffic patterns and client behavior

Runs Anywhere, No Hassle

Our open source agent works on all major Linux distributions and supports a wide range of CPU architectures.
Linux
Ubuntu
Debian
Archlinux
Alpine
Docker

Simple Monitoring with a Simple Pricing

Lite
Free
for 1 server
Free tier for a single server. Ideal for personal projects and home NAS setups.
Start For Free
Standard
9 $
per month for 3 servers
For more advanced use. Supports unlimited servers, billed from 3 servers minimum.
Get started

Frequently Asked Questions

What are the requirements to run the collection agent?
The Simple Observability agent is distributed as a single, self-contained binary with zero external dependencies. There’s no need for Docker, Java, or any other runtime.
Because it’s fully open-source, you can also clone our repository and build the binary yourself.
Do I need to have ports open?
No inbound ports are required on your servers. The agent uses a push-only model, sending metrics and logs outbound over HTTPS (port 443) to *.simpleobservability.com.
If you operate behind a corporate proxy or firewall, just allow outbound HTTPS traffic to our domain.
The agent will locally buffer data if connectivity is lost and replay it once the network is restored.
What we do with your data?
Metrics and logs collected by your agent are used only to power your monitoring dashboards.
This data is securely stored with our cloud provider and is never sold or shared. Thanks to our open-source agent, you remain fully in control of what is collected and sent.
How long data is retained?
Data retention depends on your plan. This applies to both metrics and logs collected from your servers.
What payment method do you accept?
We accept all major credit cards (Visa, Mastercard, American Express) and PayPal.
Can I cancel anytime?
Yes. You can cancel your subscription at any time with no questions asked. You'll continue to have access until the end of your current billing period.
Do you offer discounts on large number of servers?
Yes! For businesses monitoring more than 10 servers, please contact our sales us to discuss custom enterprise pricing options.