Cron monitoring with full server context.
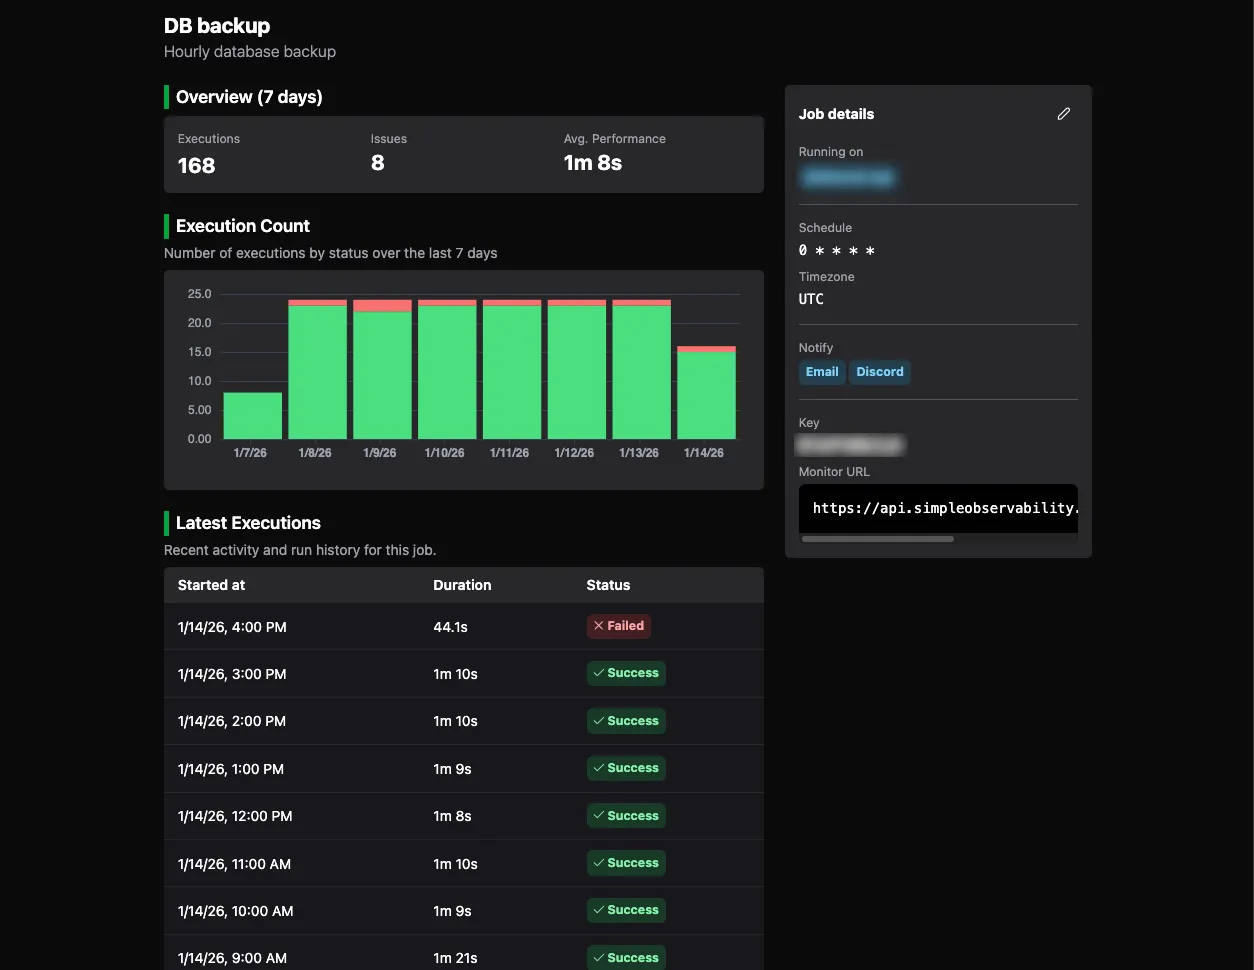
Cron monitoring with real context
Everything you need to track scheduled jobs, capture their output, and tie failures back to what was happening on the server at the time.
Integrate in 30 seconds
Two ways to integrate. If the agent is already on the server, wrap
your command with simob run
to get status reporting and output capture automatically. Prefer to
keep things HTTP-only? Add a few curl calls to your scripts. Both
approaches work with any scheduler.
# Wraps your script, reports status, and captures output0 0 * * * simob run <JOB KEY> --capture-output -- /path/to/backup.shMONITOR_URL=<MONITOR URL>set -etrap 'curl "$MONITOR_URL?state=fail"' ERRcurl "$MONITOR_URL?state=run"# Your existing script logic here...curl "$MONITOR_URL?state=complete"Beyond cron monitoring
Everything below comes bundled in the same platform, no extra setup required.
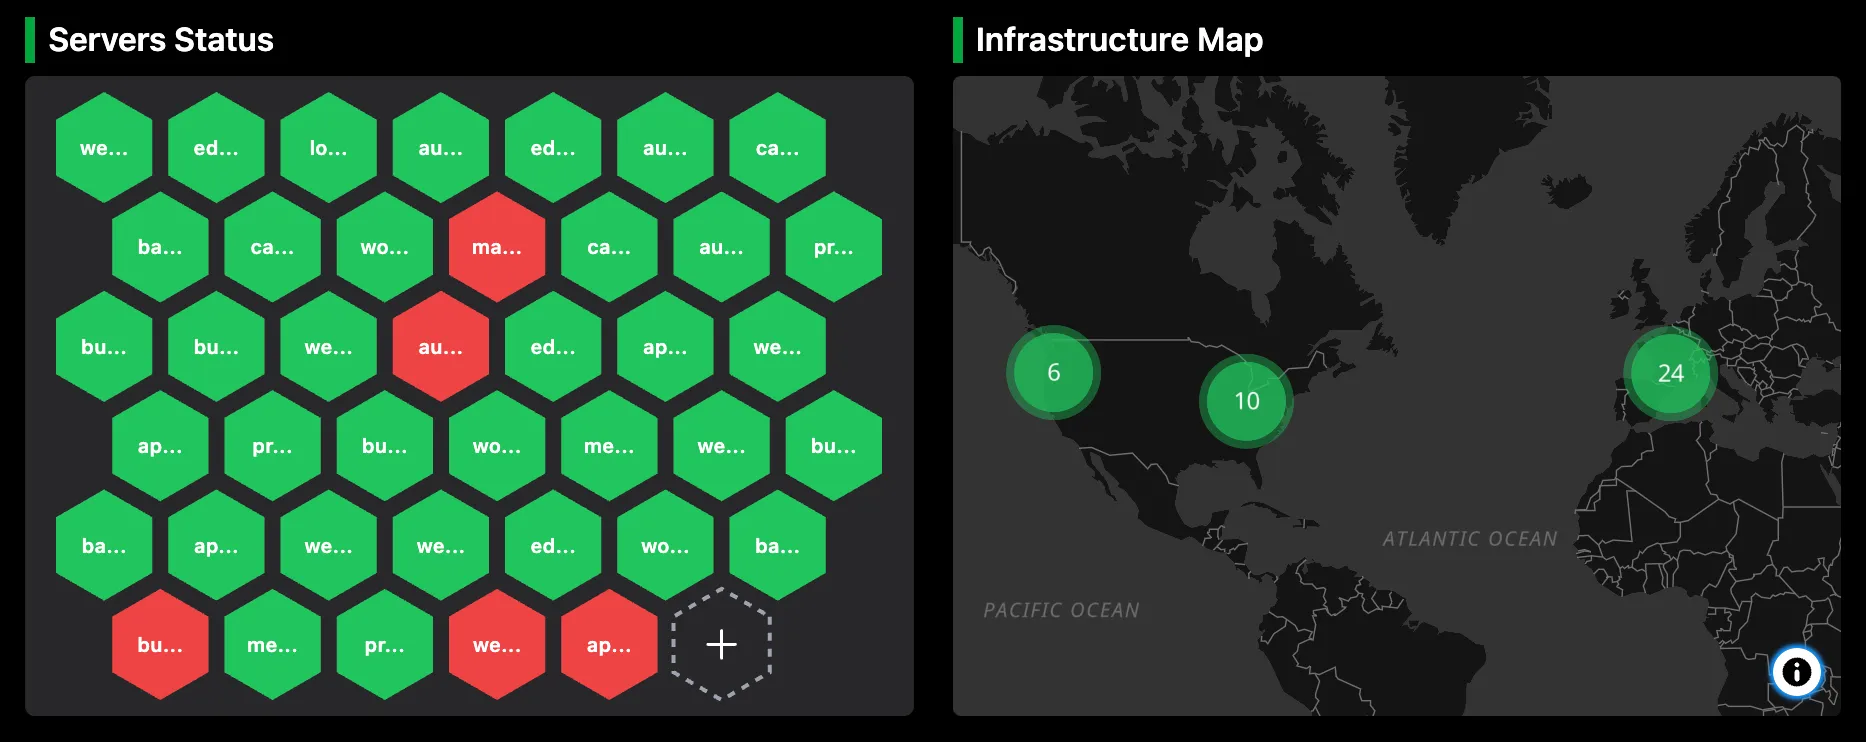
Server monitoring
Every server across cloud providers, VPS hosts, and on-premise hardware in a single dashboard.
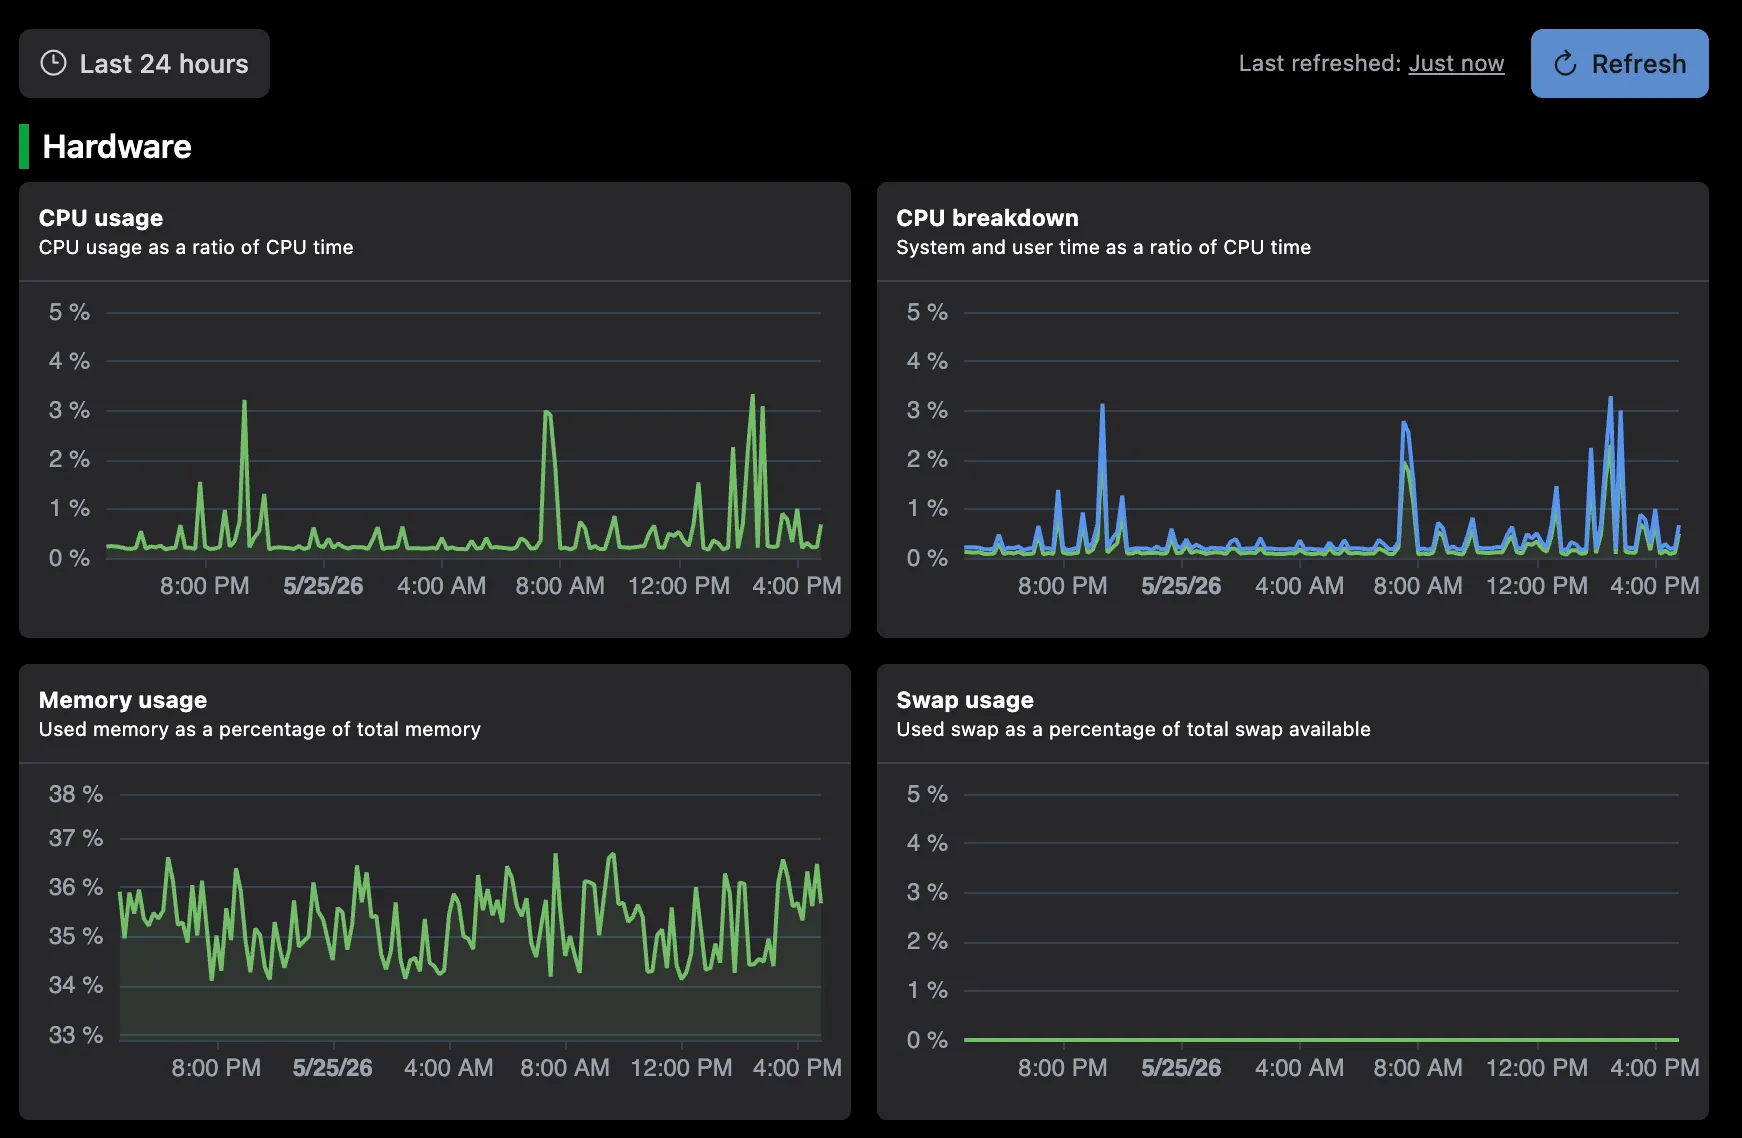
Metrics & dashboards
CPU, memory, disk, and network with ready-to-use charts for every server.
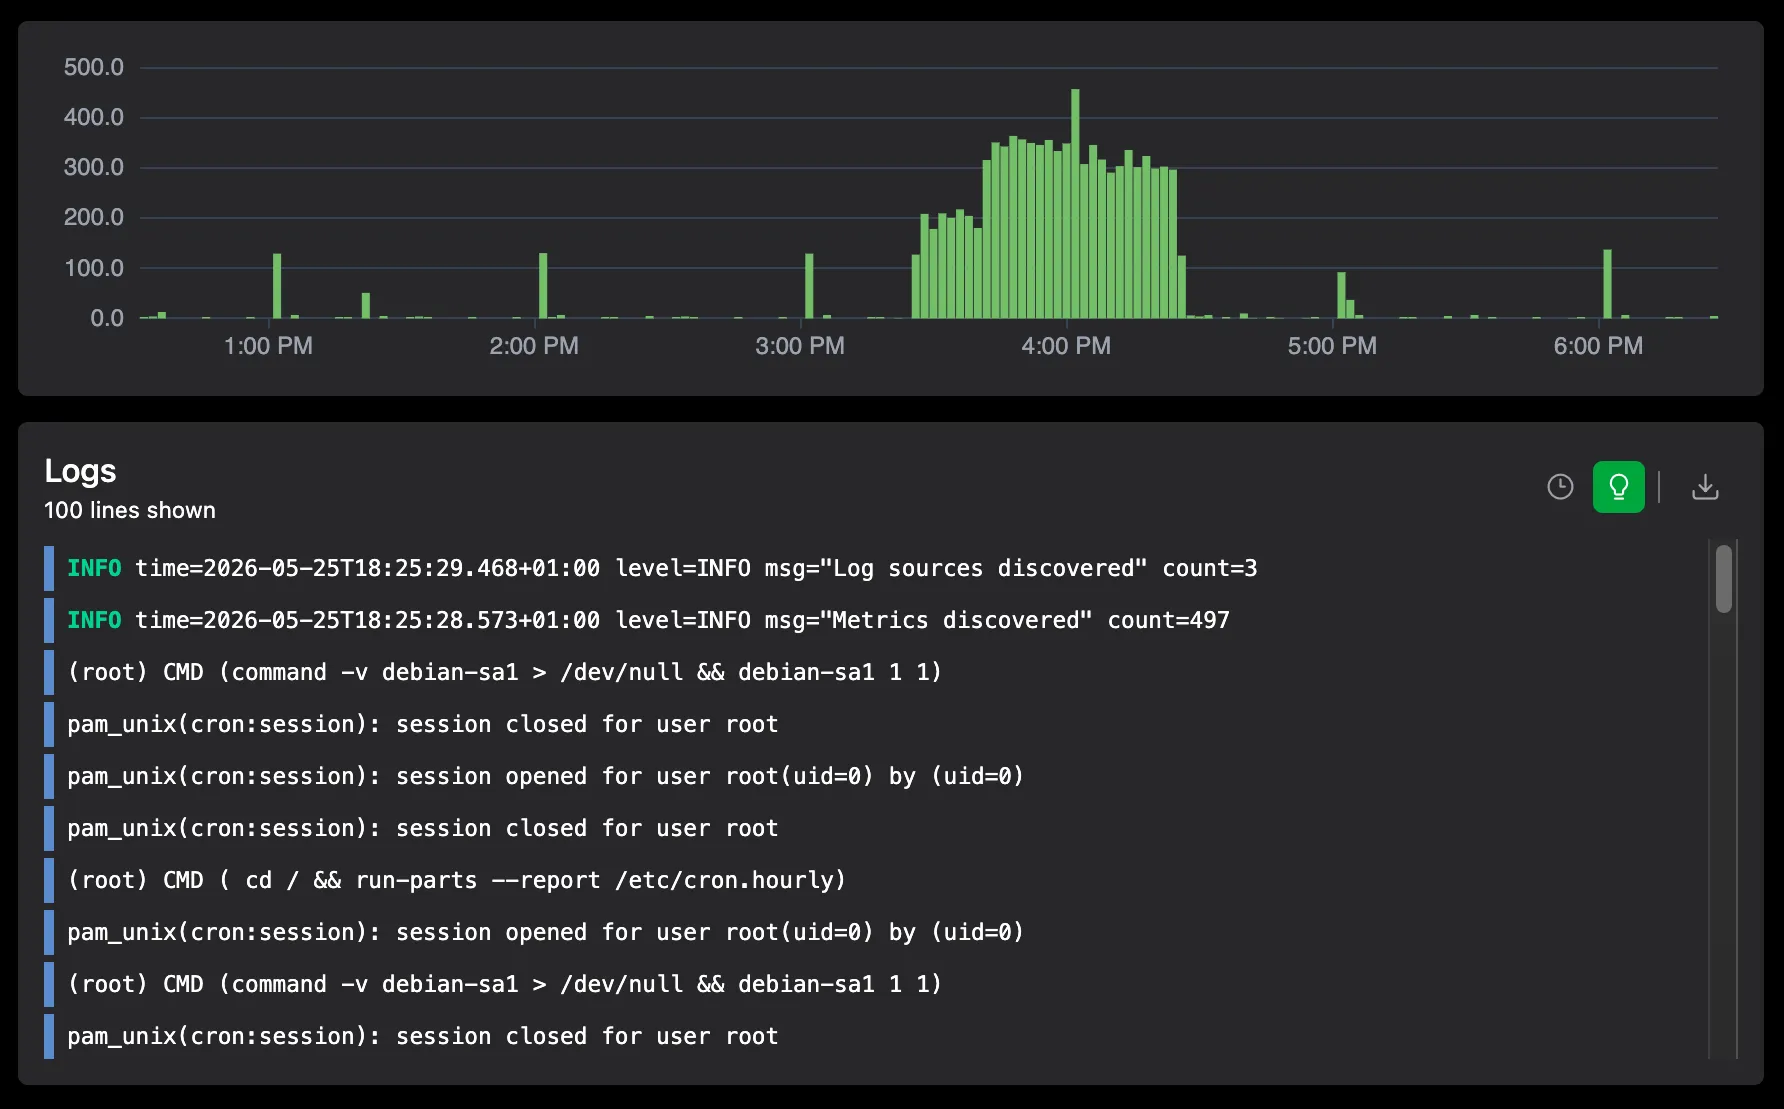
Logs
Search Linux and Windows system logs across your entire fleet in one place.
Frequently Asked Questions
Start monitoring your cron jobs in minutes
Wrap your commands with simob run or add a few curl calls, and get execution status, duration, and output logs alongside your server metrics. No SDK, no daemon, no extra tool to run.