Search system logs across your entire fleet.
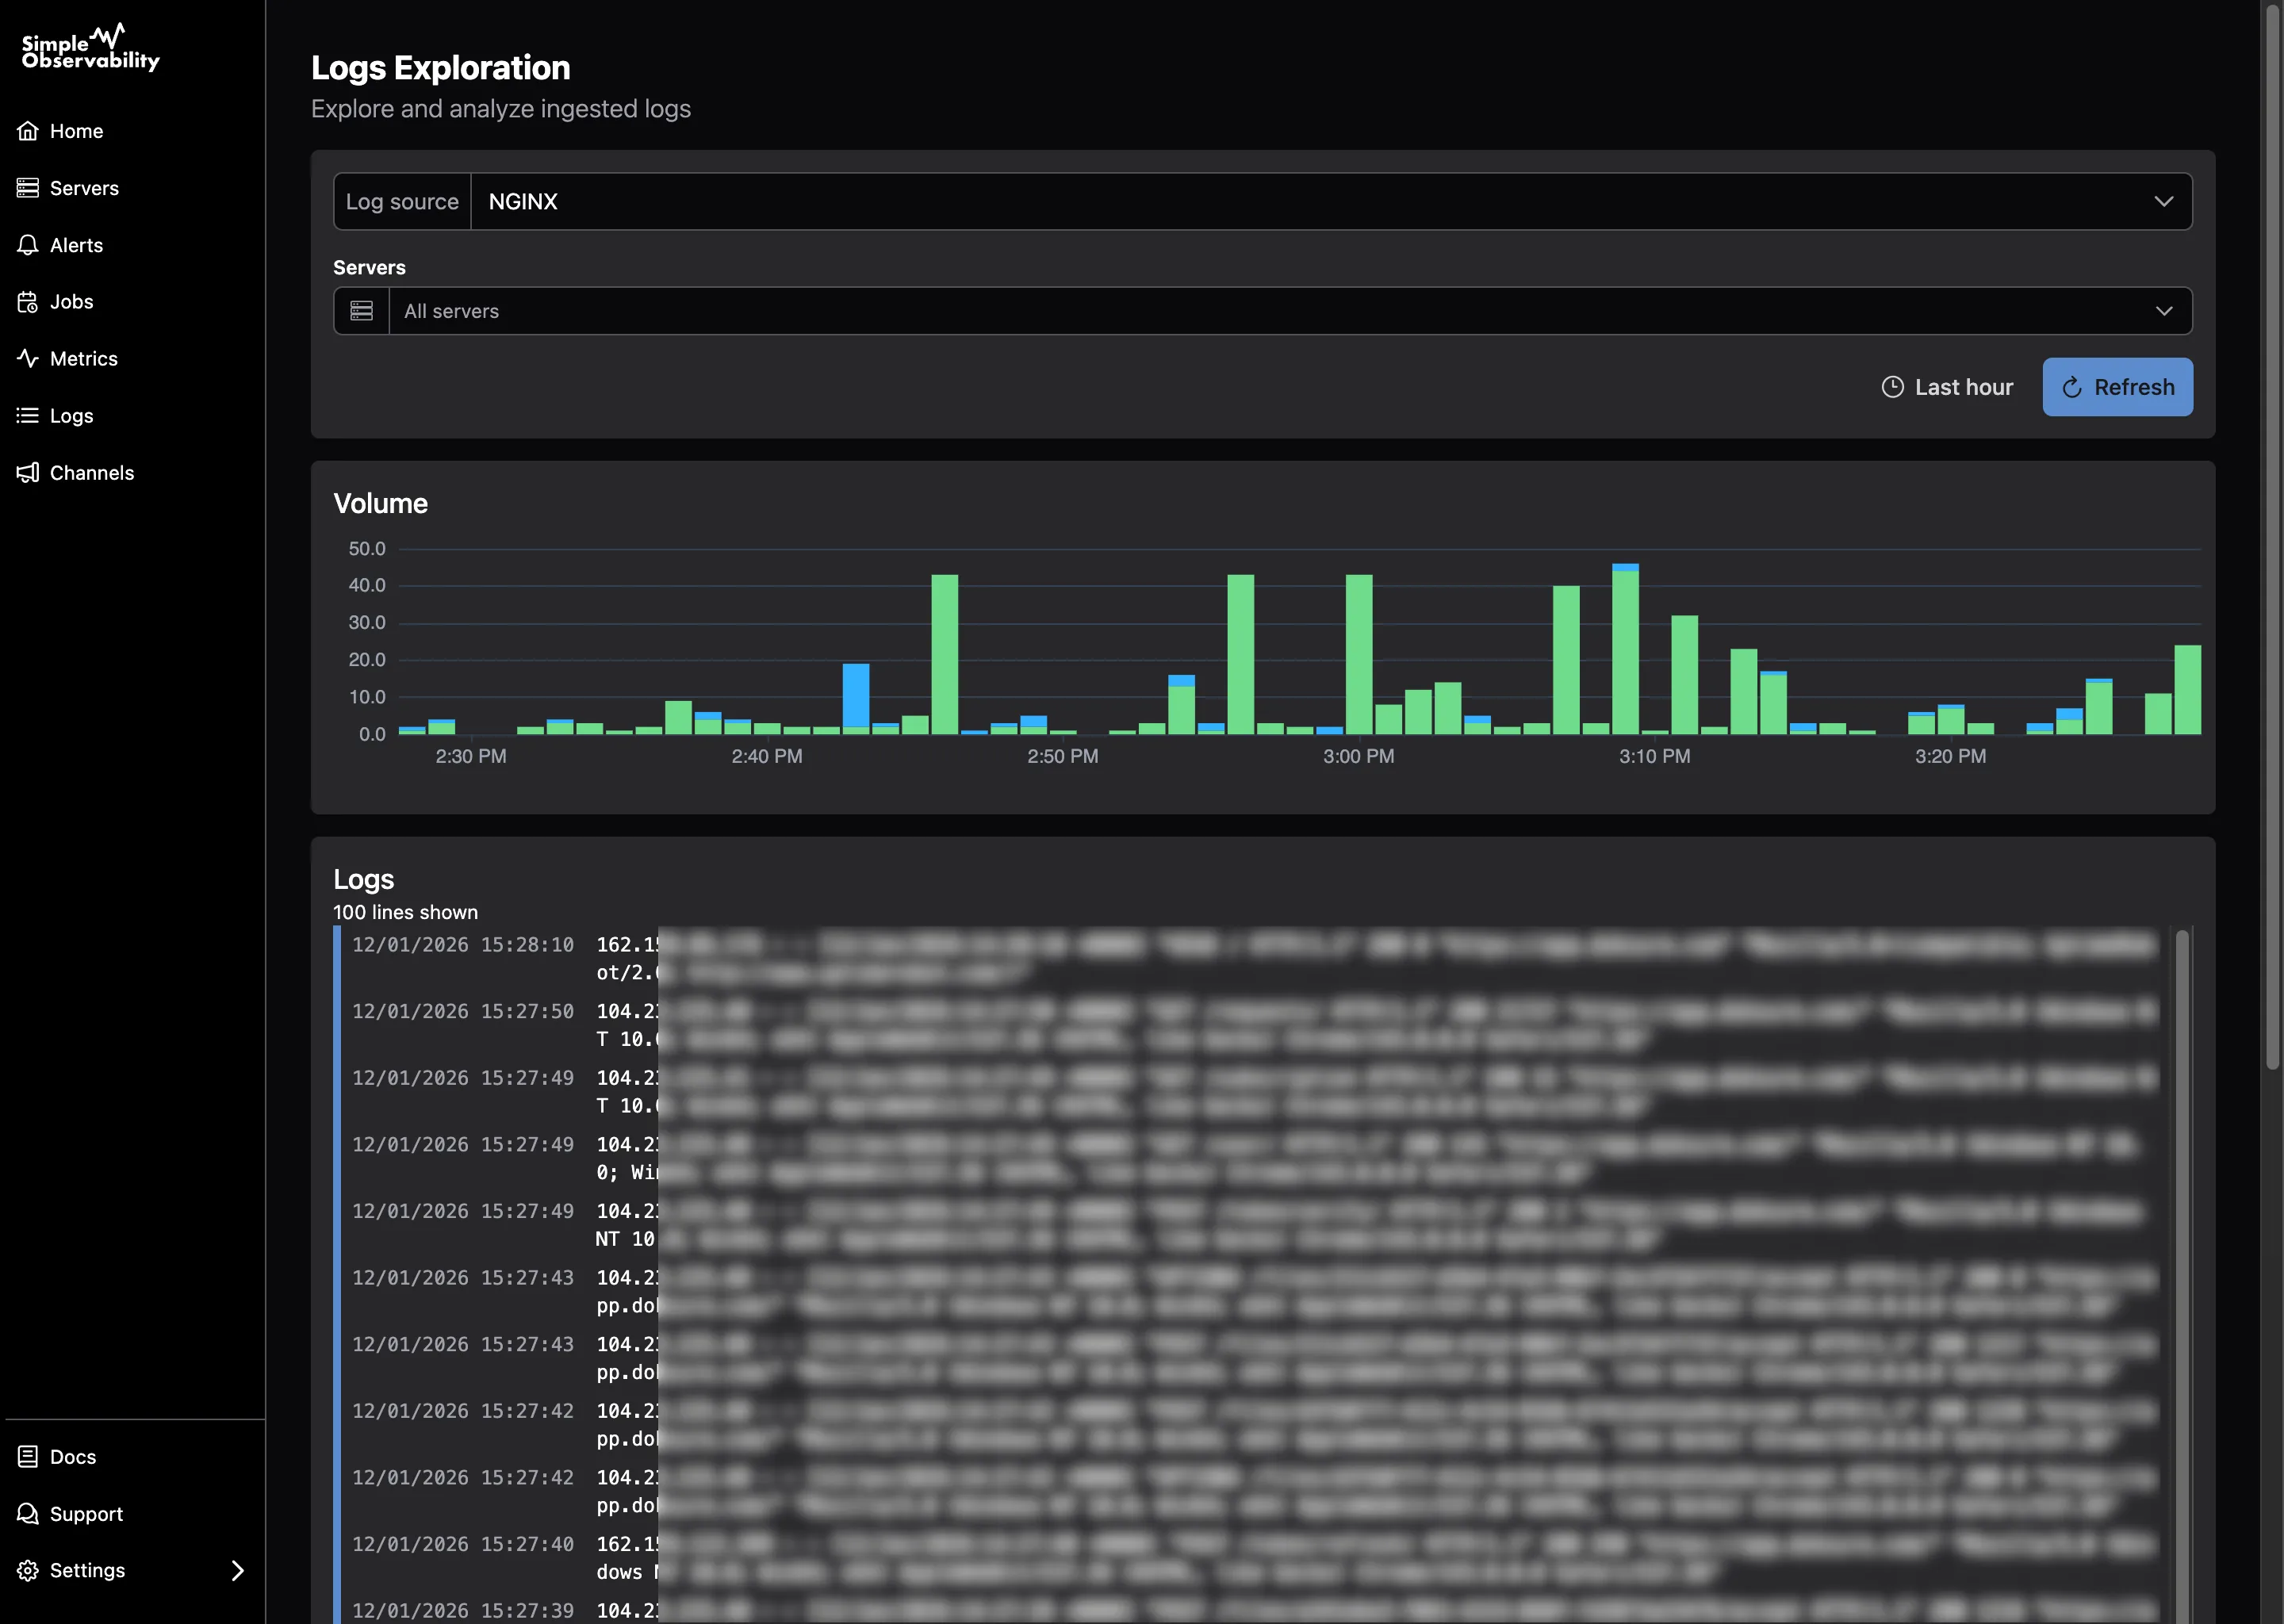
System logs without the pipeline
Everything you need to read, search, and filter Journalctl and Windows Events across every server, with nothing to set up.
Start collecting logs in one command
Run a single command on each server. The agent registers itself and starts forwarding Journalctl and Windows Events over HTTPS. Logs become searchable within the first minute, with nothing to configure.
curl -fsSL https://simpleobservability.com/install.sh | sudo bash -s -- <SERVER KEY>.\install.ps1 -ApiKey <SERVER KEY>Beyond system logs
Everything below comes bundled in the same platform, no extra setup required.
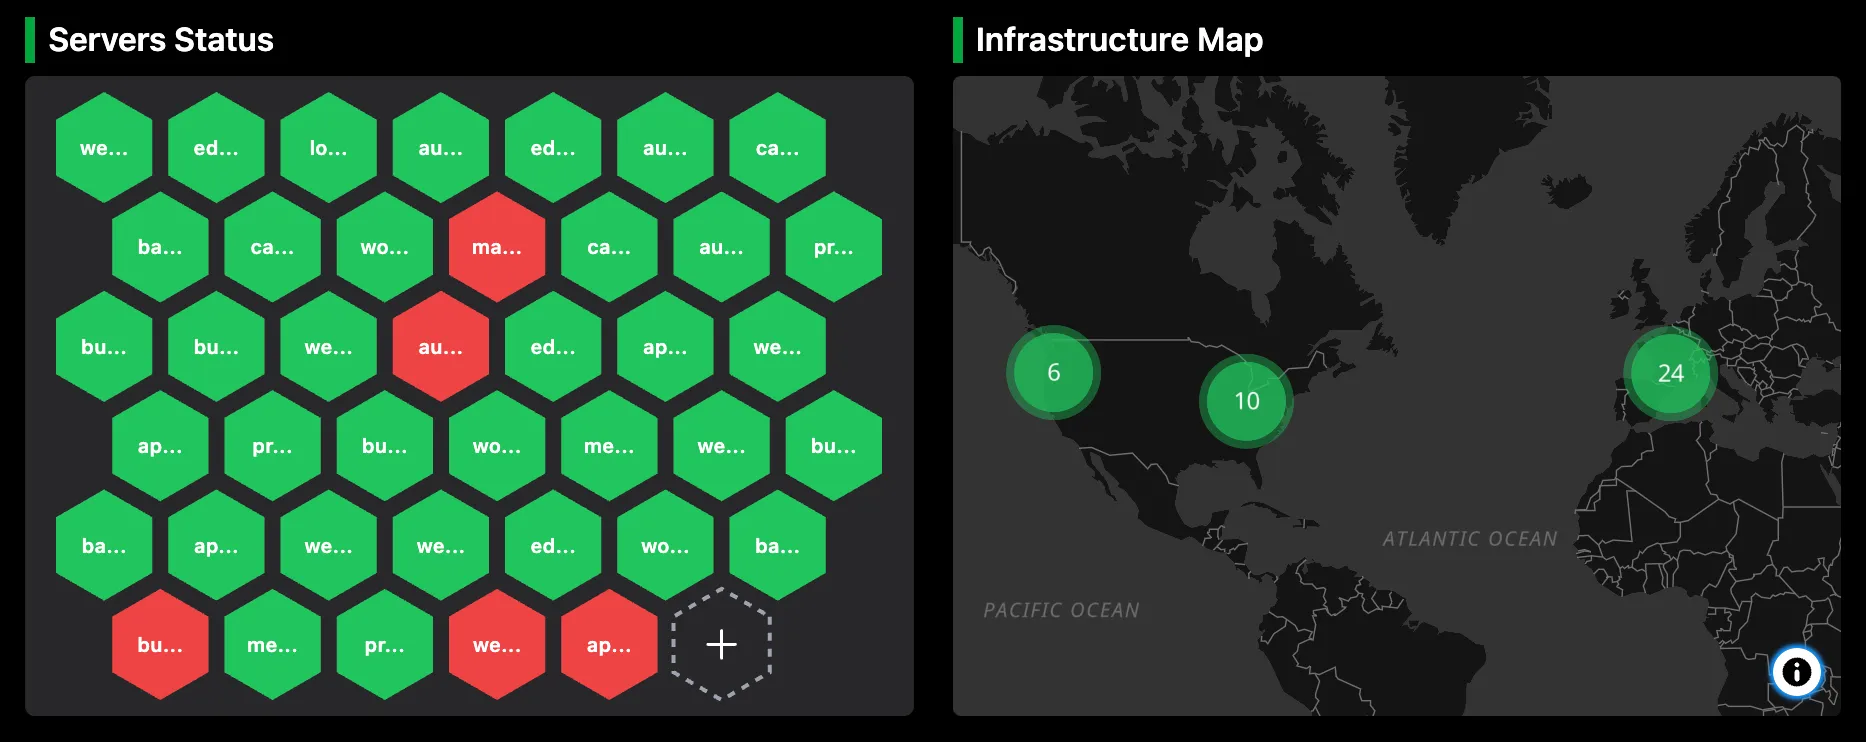
Server monitoring
Every server across cloud providers, VPS hosts, and on-premise hardware in a single dashboard.
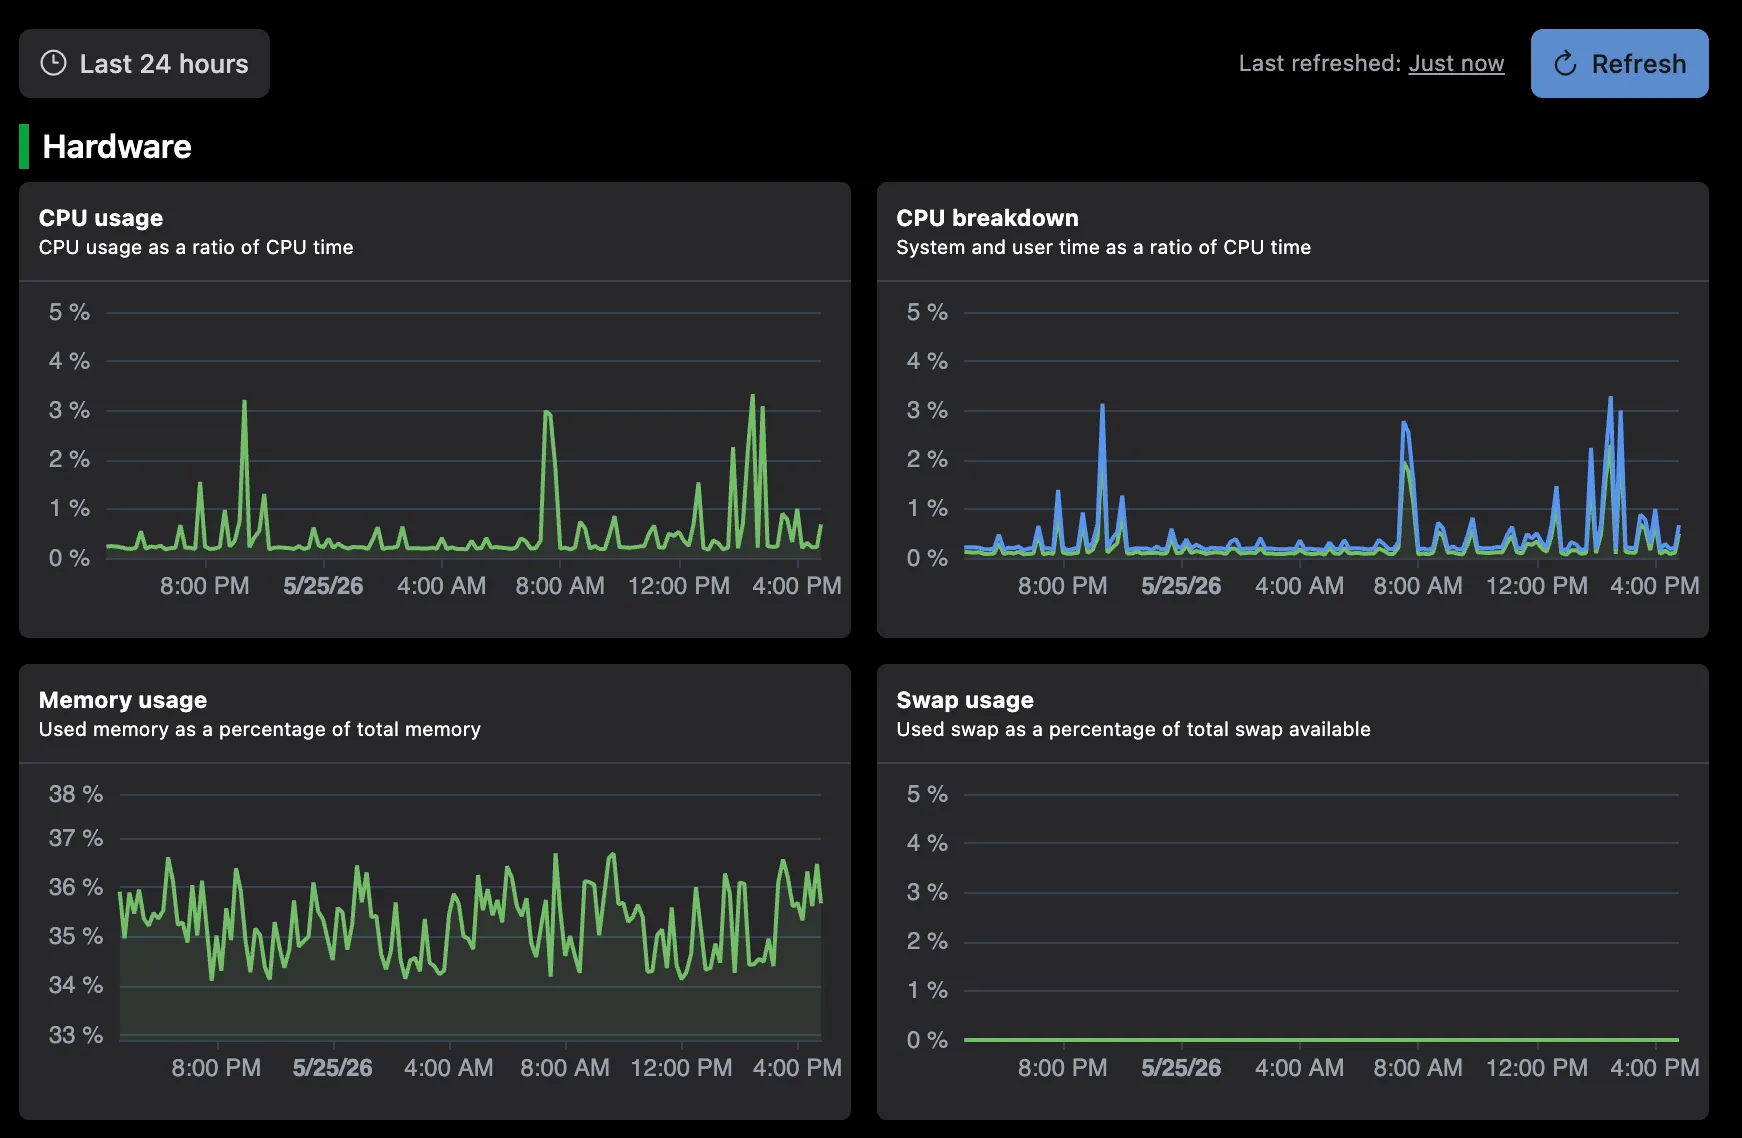
Metrics & dashboards
CPU, memory, disk, and network with ready-to-use charts for every server.
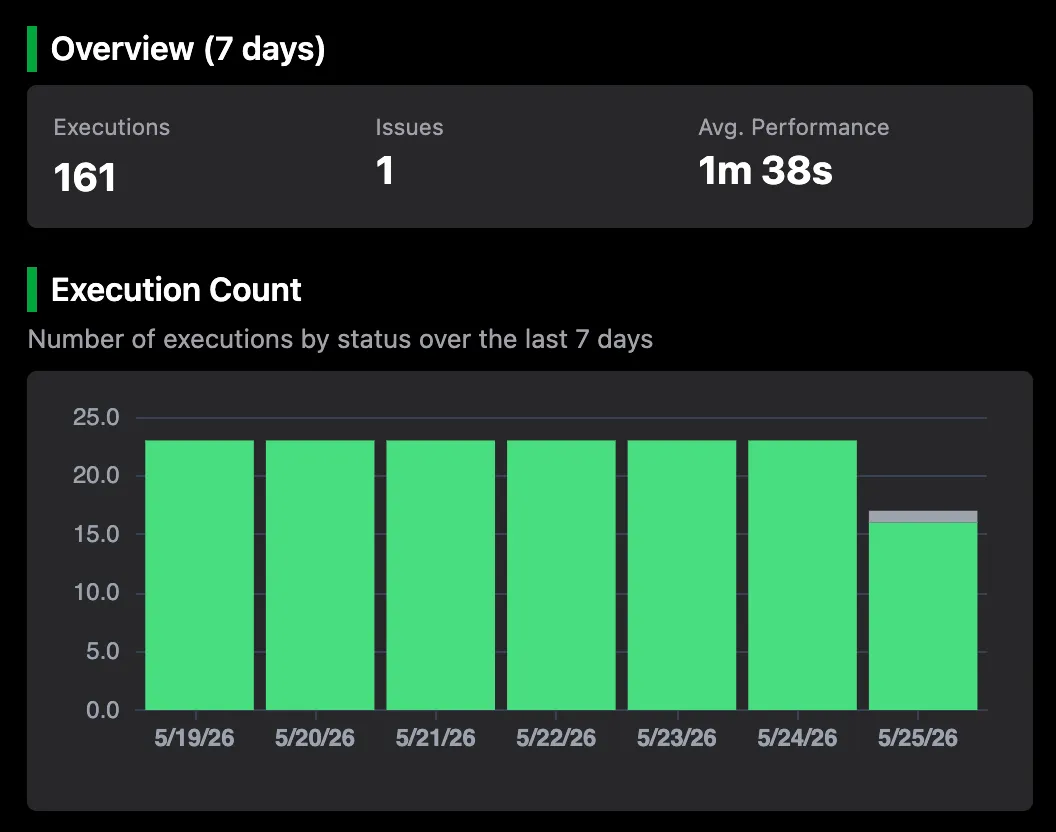
Cron monitoring
Track scheduled jobs with execution status, duration, and output logs.
Frequently Asked Questions
Search your fleet's logs in minutes
Install the agent on each server and start searching Journalctl and Windows Events from one place. No pipelines, no extra storage, no config files.