
PRTG Network Monitor is a long-standing choice for Windows-centric IT departments. It runs on a Windows server, uses a sensor-based model, and covers network, server, and application monitoring in a single product. For small environments with a Microsoft stack, it is approachable.
The friction shows up as you scale. PRTG counts everything in “sensors”, and a single host can easily consume 50 or more, so the per-sensor licensing gets expensive fast. Running the core on a Windows server is a constraint for Linux-heavy or cloud-native shops, and the sensor-by-sensor configuration model gets tedious across a real fleet. If you want a cloud-native platform with predefined defaults instead of a self-hosted Windows install, Simple Observability gives you metrics, logs, and alerts out of the box at a fixed per-server price.
This article covers the best alternatives to PRTG in 2026. We start with what PRTG does well and where it falls short, then the criteria for evaluating a replacement, and finally a comparison of each option. If you are comparing other tools, see our Checkmk alternative and Zabbix alternatives guides.
Quick summary
| Tool | Best For | Price Model |
|---|---|---|
| Simple Observability | Cloud-native, zero-config | $3 / mo / server |
| Zabbix | Large on-prem fleets | Free (OSS) / €50/mo (Cloud) |
| Checkmk | Complex IT / Hybrid | ~$6 / host / month |
| Nagios | Legacy stability | $2,495+ (XI License) |
| Icinga | Flexible configuration | Free (OSS) |
| Datadog | Enterprise / full APM | $15+ / host / month |
| ManageEngine OpManager | Windows / network IT | $245/yr (25 devices) |
| Site24x7 | All-in-one suite | Usage based |
PRTG Overview
Known for
PRTG is best known for being an all-in-one, Windows-based network monitor with a sensor model. One installer covers network, server, bandwidth, and application monitoring, which makes it approachable for small IT teams that want a single product.
Key features
- Sensor-based: Each metric you track is a sensor, covering a huge range of types.
- All-in-one: Network, server, and app monitoring in a single product.
- Auto-discovery: Scans the network to suggest sensors automatically.
- Windows core: Runs on a Windows server, which suits Microsoft-heavy shops.
Why look for a PRTG alternative?
While PRTG is approachable, several limits push teams to look elsewhere.
1. Sensor-based pricing gets expensive
PRTG licenses by the number of sensors, and a single host can easily generate 50 to 100+ sensors. As your fleet grows, you either buy more sensor packs or stop monitoring things to stay under your limit, which is the wrong incentive.
2. Windows server requirement
The core runs on Windows. For Linux-heavy or cloud-native shops, standing up a Windows server just to run monitoring is an odd constraint, and it adds licensing cost of its own.
3. Sensor-by-sensor configuration
Configuring each sensor individually gets tedious across a real fleet. Modern tools auto-configure checks based on what is running, while PRTG leans on manual sensor setup.
4. Cloud-native limits
PRTG is built around an on-prem core and a polling model. Cloud-native and container environments are not its natural home, and the experience reflects that.
How to choose an alternative?
When comparing PRTG competitors, focus on what actually shapes your cost and workflow.
- Pricing unit: Decide whether per-sensor, per-host, or per-server pricing fits your fleet. Per-sensor models add up fast.
- Platform: Do you need a Windows server, or is a cross-platform agent or SaaS acceptable?
- Configuration model: Look for auto-discovery and predefined defaults over manual sensor setup.
- Cloud-native fit: If you run containers or cloud infrastructure, check whether the tool is built for it.
8 Best PRTG Alternatives
1. Simple Observability
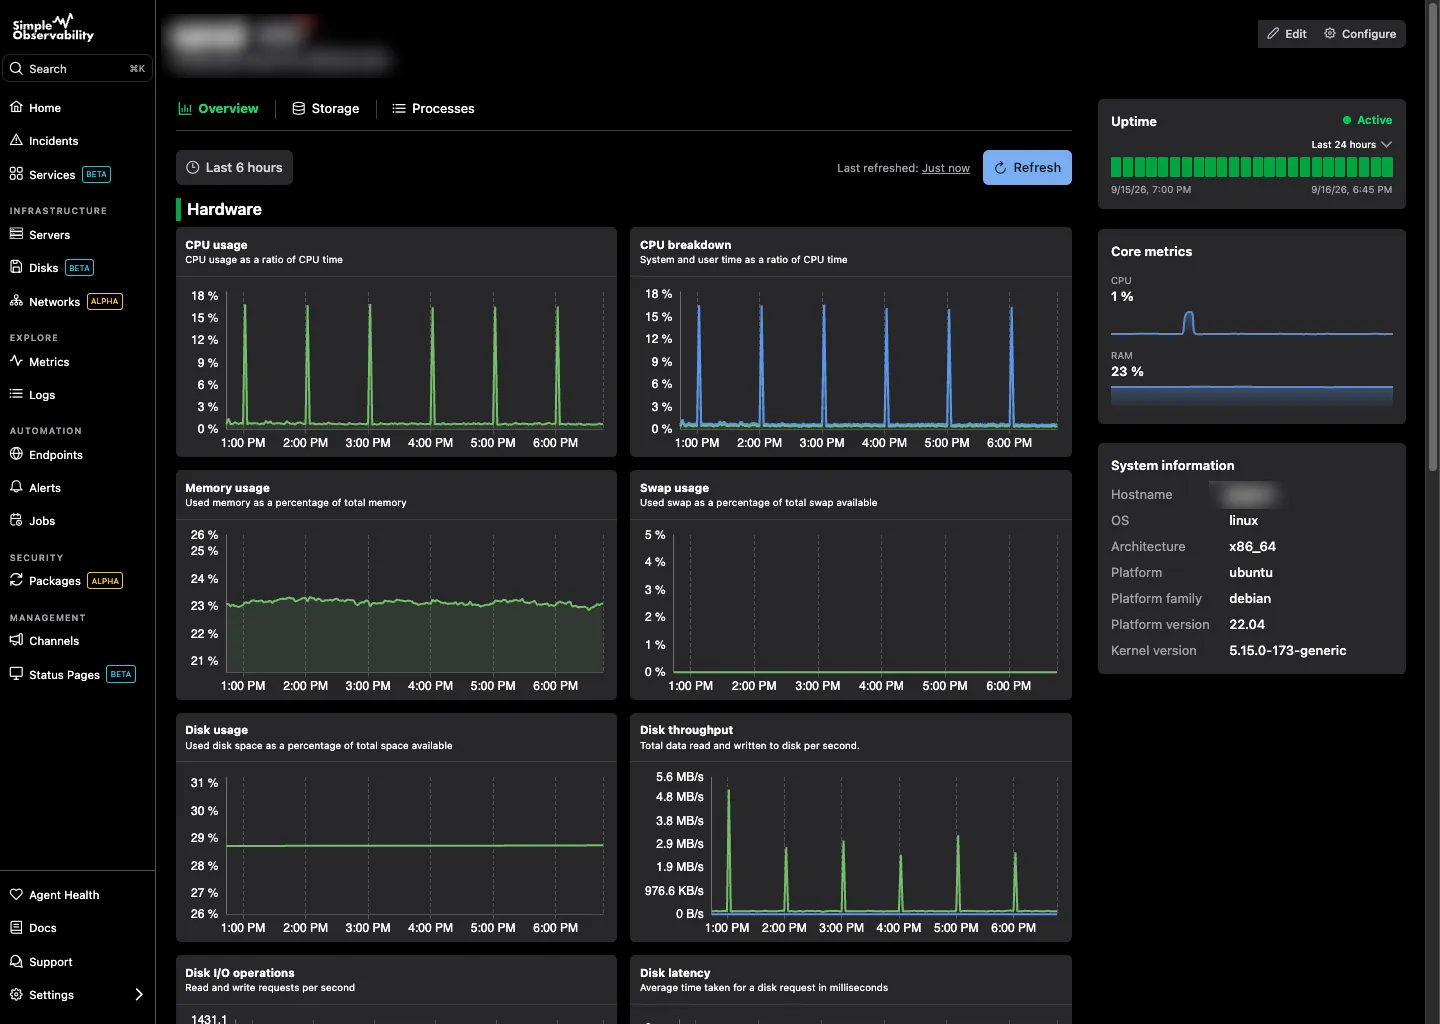
Simple Observability is built for teams that want a cloud-native platform with predefined defaults instead of a self-hosted Windows install. It combines metrics, logs, and alerts in one dashboard, installed with a single command on any Linux server, at a fixed per-server price.
Key features
- Unified dashboard: CPU, memory, disk, and network alongside logs.
- Zero-config alerts: Sensible defaults from day one, no per-sensor setup.
- Cross-platform agent: A lightweight open-source agent, no Windows core required.
- Cloud-native: The agent pushes data out over HTTPS, no inbound ports.
Simple Observability vs PRTG Where PRTG licenses by the sensor and runs on a Windows server, Simple Observability charges a flat fee per server and installs on Linux in one command. You stop counting sensors and stop maintaining a Windows monitoring box.
Pros
- Predictable pricing: Flat fee per server. No sensor counting.
- No Windows dependency: Runs anywhere, fully managed.
- Zero-config: Defaults work out of the box.
Cons
- Less network-device focus: It is infrastructure-first, not a deep SNMP network monitor like PRTG.
- No native Windows core: If you specifically want a Windows-hosted monitor, this is not it.
Best for: Teams running Linux servers and cloud infrastructure that want zero-config monitoring without a Windows server.
Price
- Free: $0 for 1 server.
- Paid: $3/mo per server for unlimited servers.
- Custom: Volume discounts for large fleets.
2. Zabbix
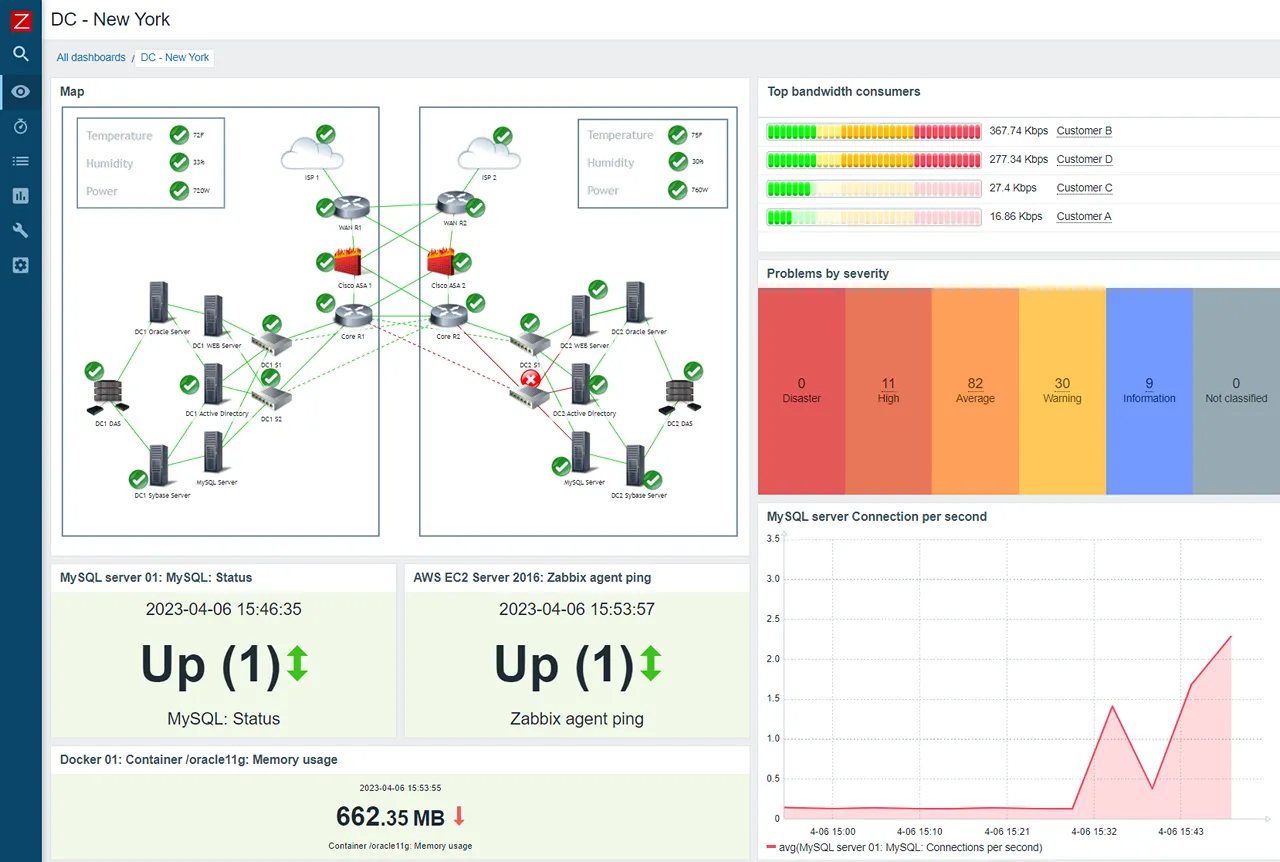
Zabbix is the closest open-source competitor to PRTG in scope. It covers network, server, and application monitoring, runs on Linux, and is free to self-host with no sensor licensing.
Key features
- Agent and agentless: SNMP, JMX, IPMI, or its own agent.
- Push and pull: Polling and trapping.
- Granular permissions: Strong multi-tenancy.
Pros
- No sensor limits: Free and open source, no per-sensor licensing.
- Linux native: No Windows server requirement.
- Strong network coverage: SNMP and network gear are a strength.
Cons
- Complexity: Verbose XML templates and a steep learning curve.
- Self-hosted: You run the server and database.
Best for: Large on-prem environments with dedicated monitoring teams.
Price Free to self-host. Zabbix Cloud starts at €50/month.
3. Checkmk
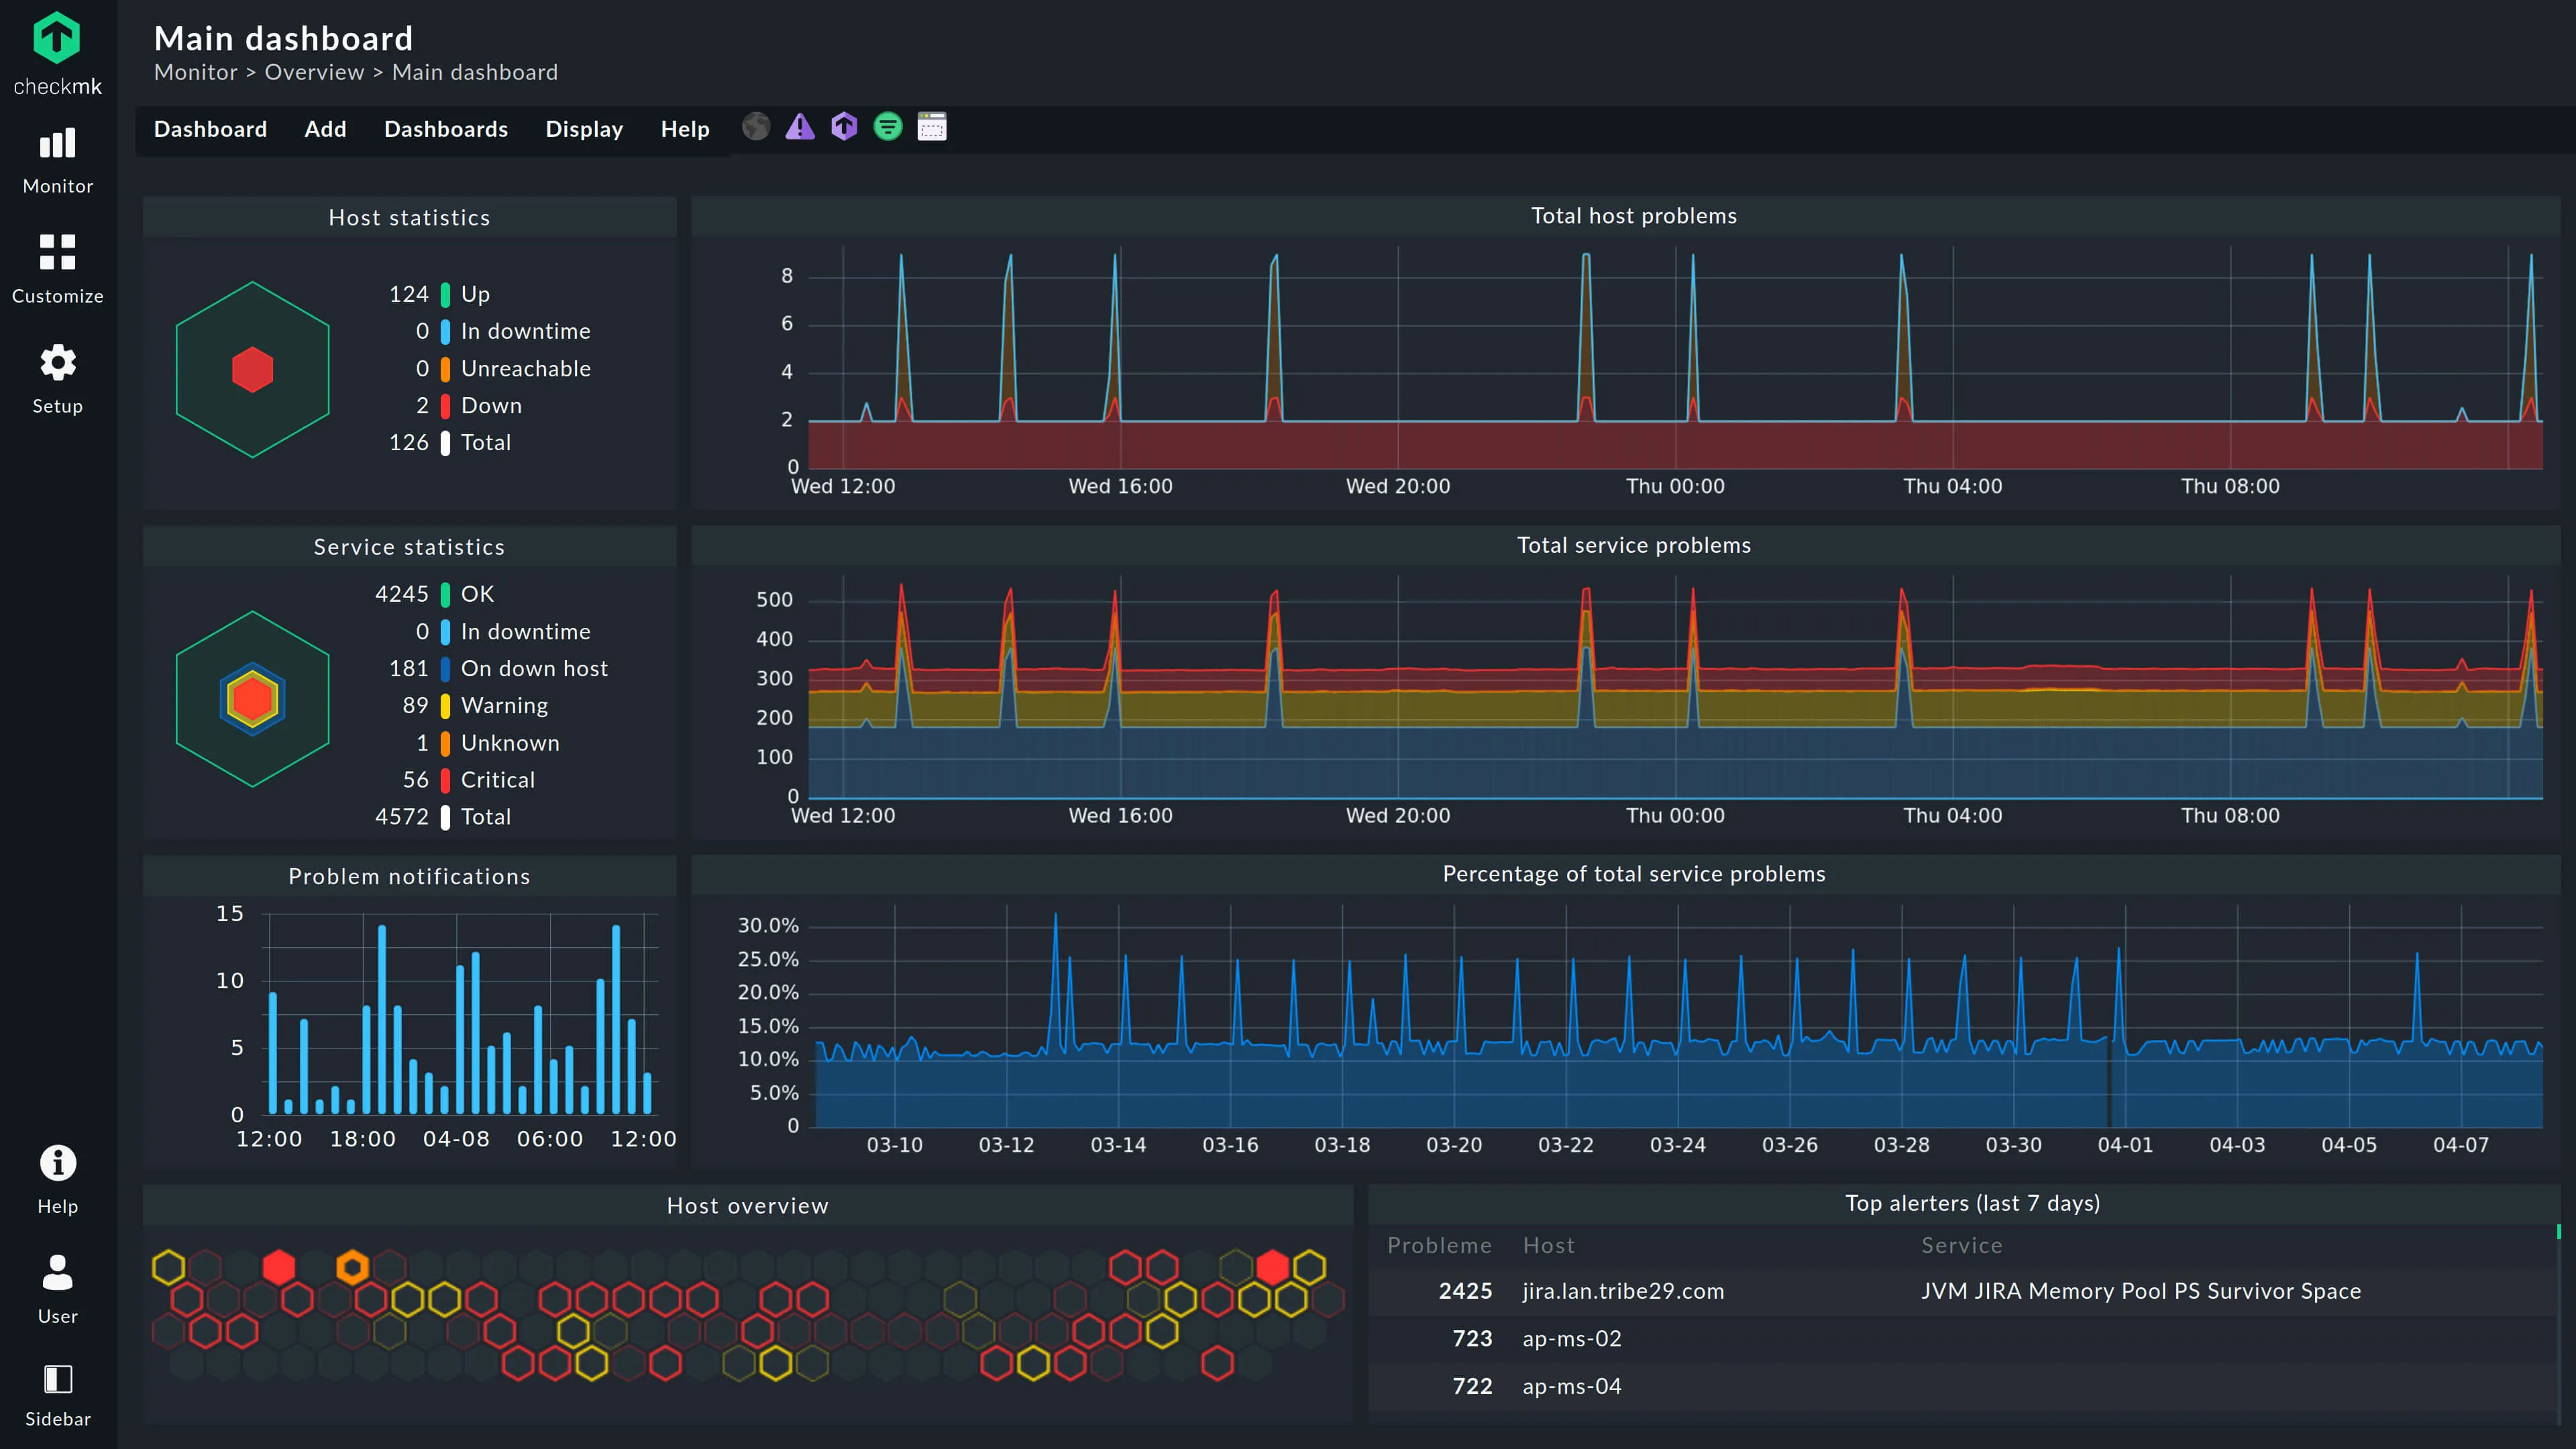
Checkmk is a comprehensive monitoring tool that excels in hybrid IT. It bridges Nagios-style checks and modern metric collection, and runs on Linux.
Key features
- Hybrid monitoring: Bare metal, switches, and Docker containers.
- Automatic service discovery: Scans hosts and configures checks.
- 2,000+ plugins: A massive library of integrations.
Pros
- All-in-one: State checks and metric performance.
- Auto-discovery: Far less manual setup than PRTG’s sensor model.
Cons
- UI feels dated: Functional but cluttered.
- Service-based pricing: Like PRTG’s sensors, pricing by services can be hard to predict.
Best for: Sysadmins managing a mix of legacy hardware, on-prem servers, and cloud instances.
Price Open Source edition is free. Enterprise starts at ~$2,100/yr for 3,000 services. SaaS starts at ~$6 per host/month.
4. Nagios
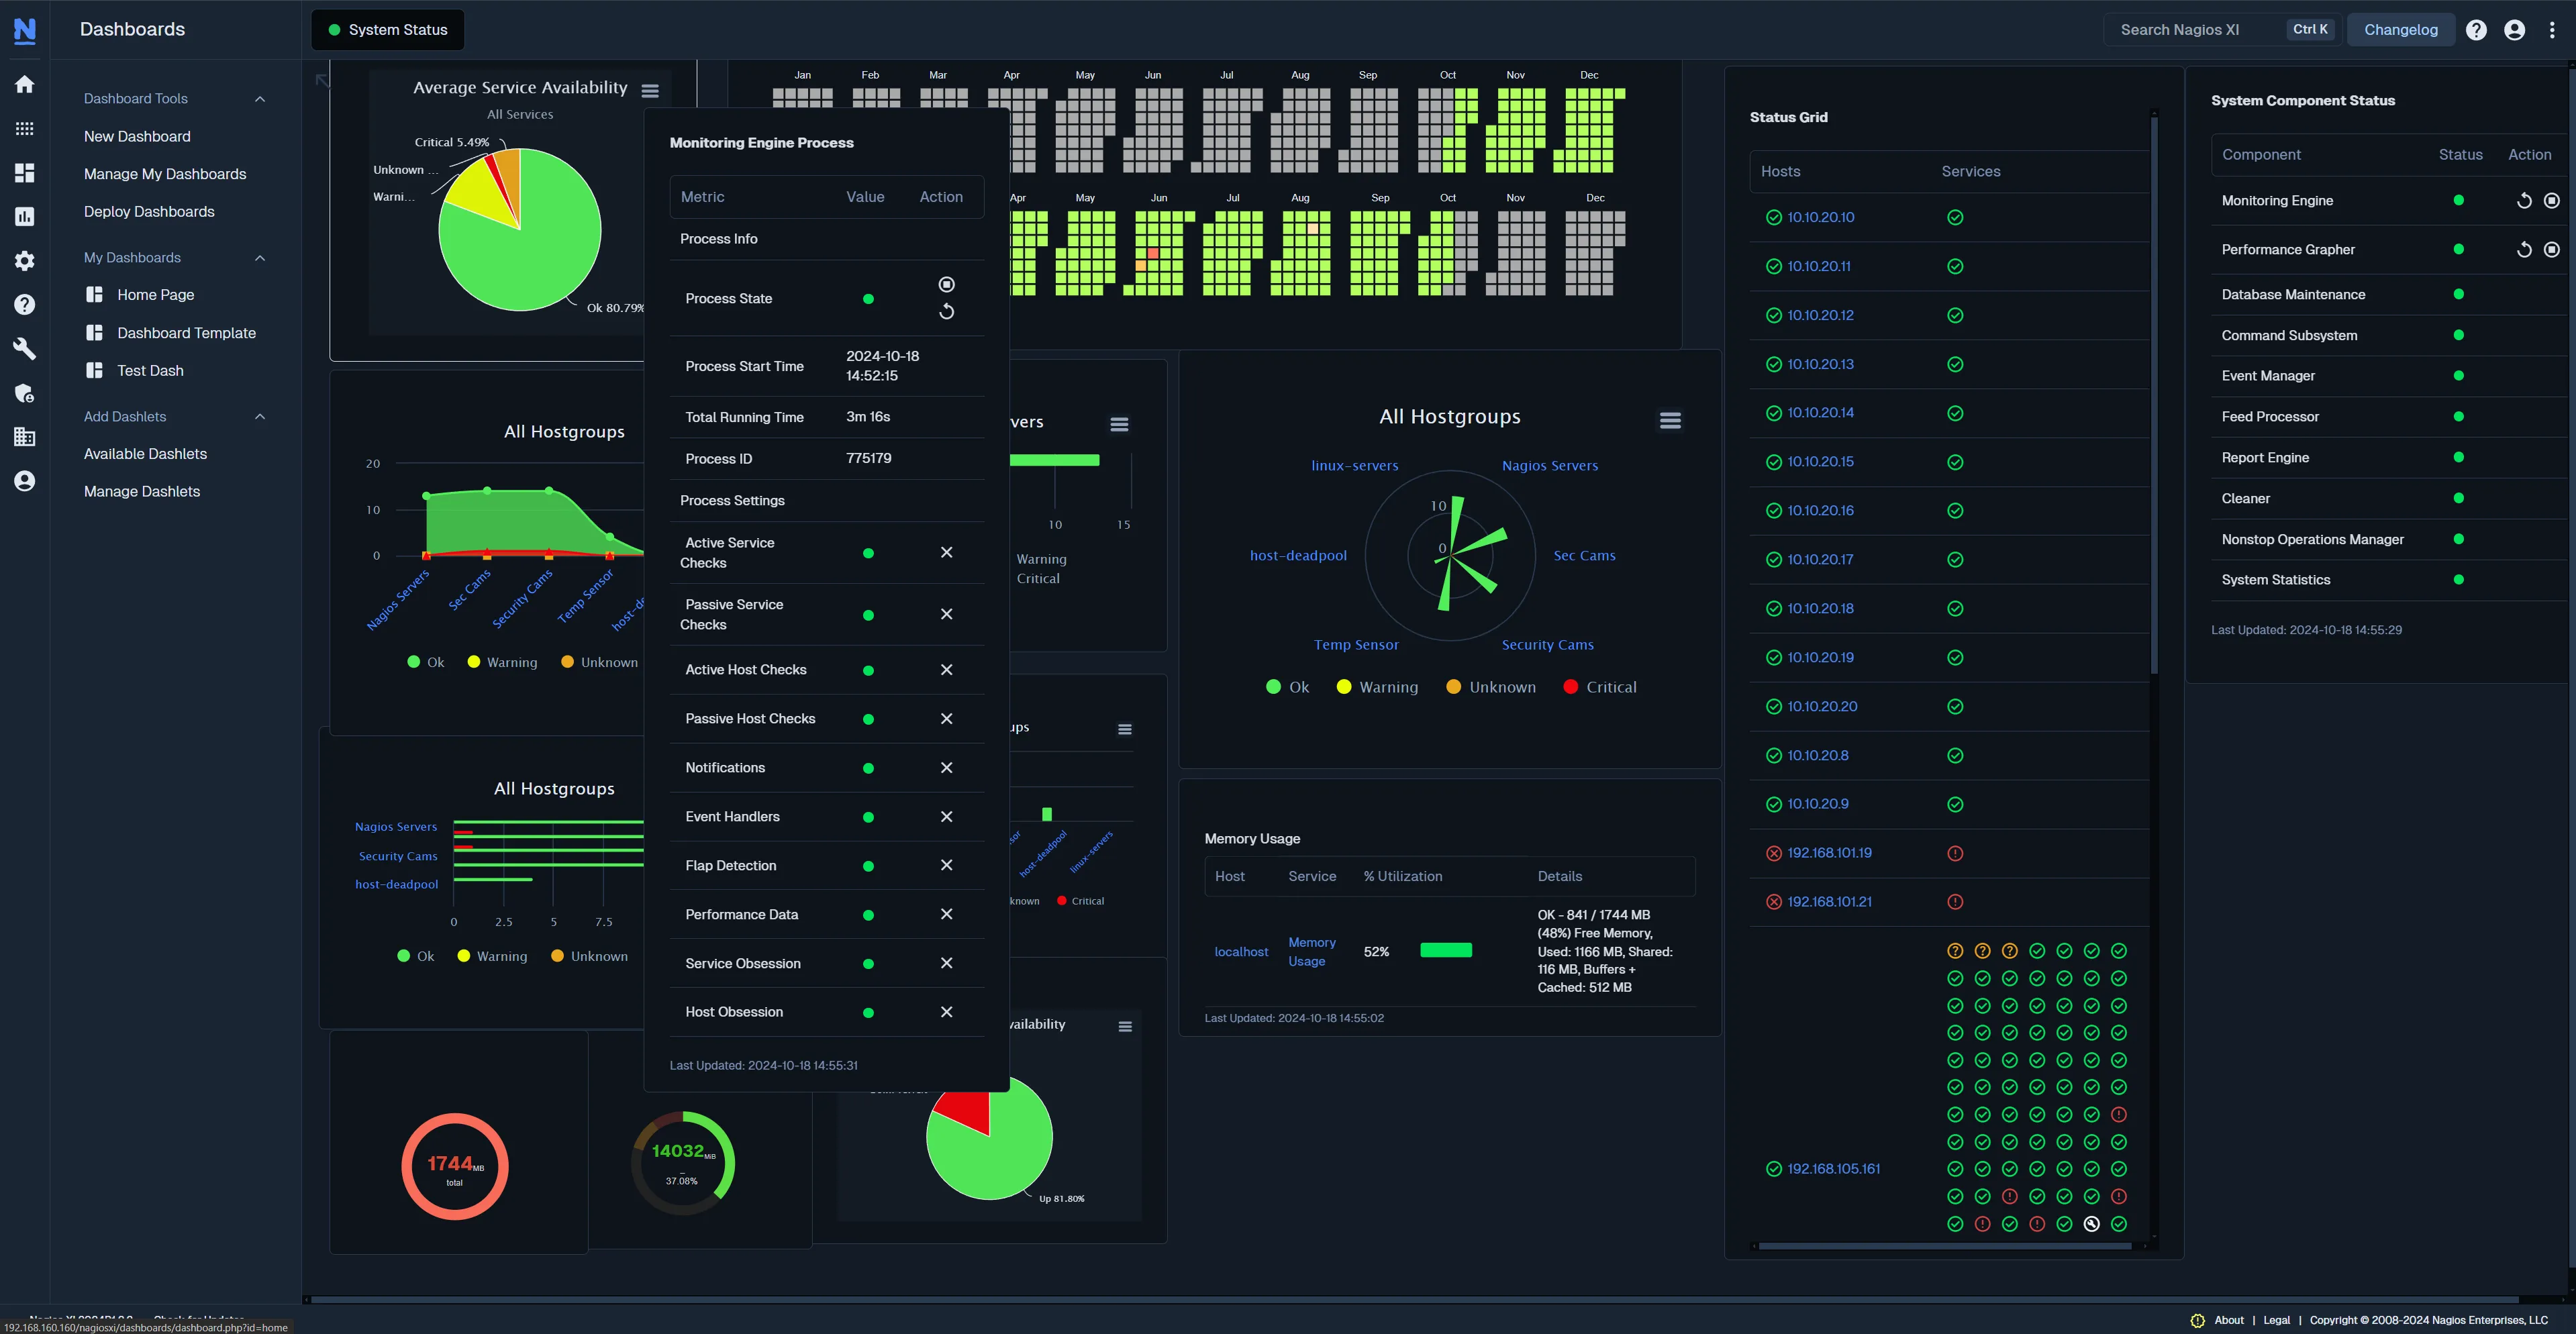
Nagios is the grandfather of monitoring. It is legacy by modern standards, but still widely deployed for its stability and vast ecosystem of check scripts.
Key features
- Plugin ecosystem: A script exists for almost any device.
- Binary state focus: Excellent for definitive OK/CRITICAL alerting.
Pros
- Reliability: Extremely stable and simple in its logic.
- Universal: Almost every sysadmin knows how to read a Nagios alert.
Cons
- Outdated: File-based config and a dated UI.
- Metrics: Fundamentally a status check tool, not a metrics tool.
Best for: Legacy environments or specific hardware checks only Nagios plugins support.
Price Nagios Core is free. Nagios XI starts at $2,495 for a standard license (up to 100 nodes).
5. Icinga
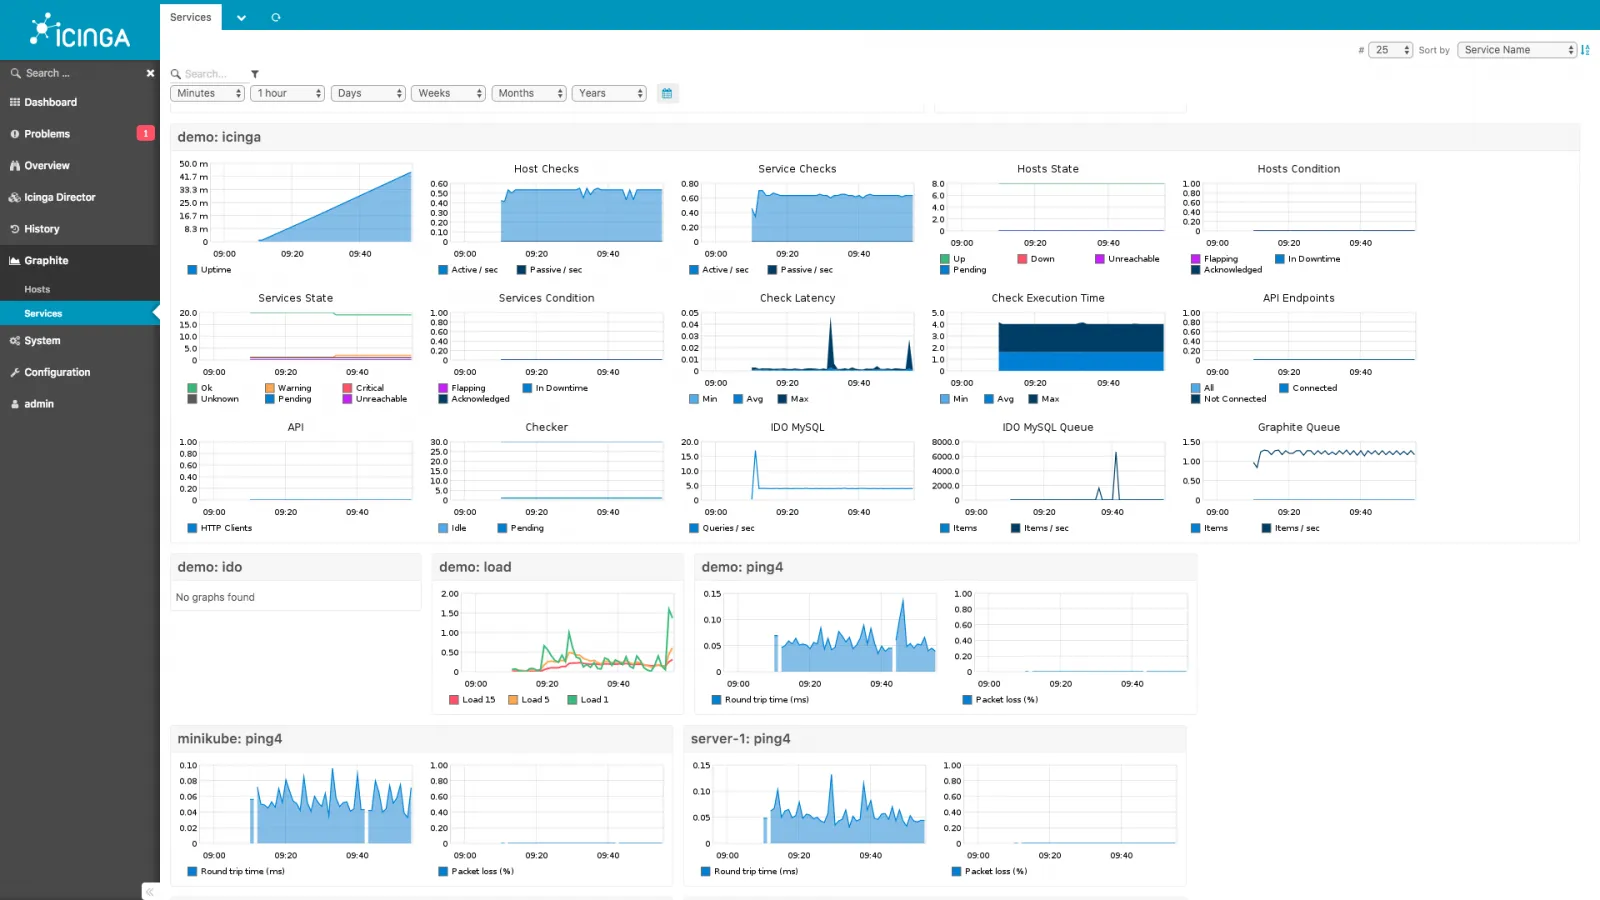
Icinga is a Nagios fork that modernized the classic approach. It keeps Nagios plugin compatibility and adds a modern web interface, an API, and distributed monitoring.
Key features
- Icinga Director: Web-based configuration management.
- Distributed monitoring: Built-in HA and distributed setups.
- Plugin compatibility: Works with thousands of Nagios plugins.
Pros
- Modernized classic: Nagios reliability with a better UI and API.
- Open source: No sensor or per-host licensing.
Cons
- Setup effort: Still requires significant configuration.
- Learning curve: The config DSL and object model take time.
Best for: Sysadmins who want Nagios flexibility with a more modern interface.
Price Free (open source). Commercial support available.
6. Datadog
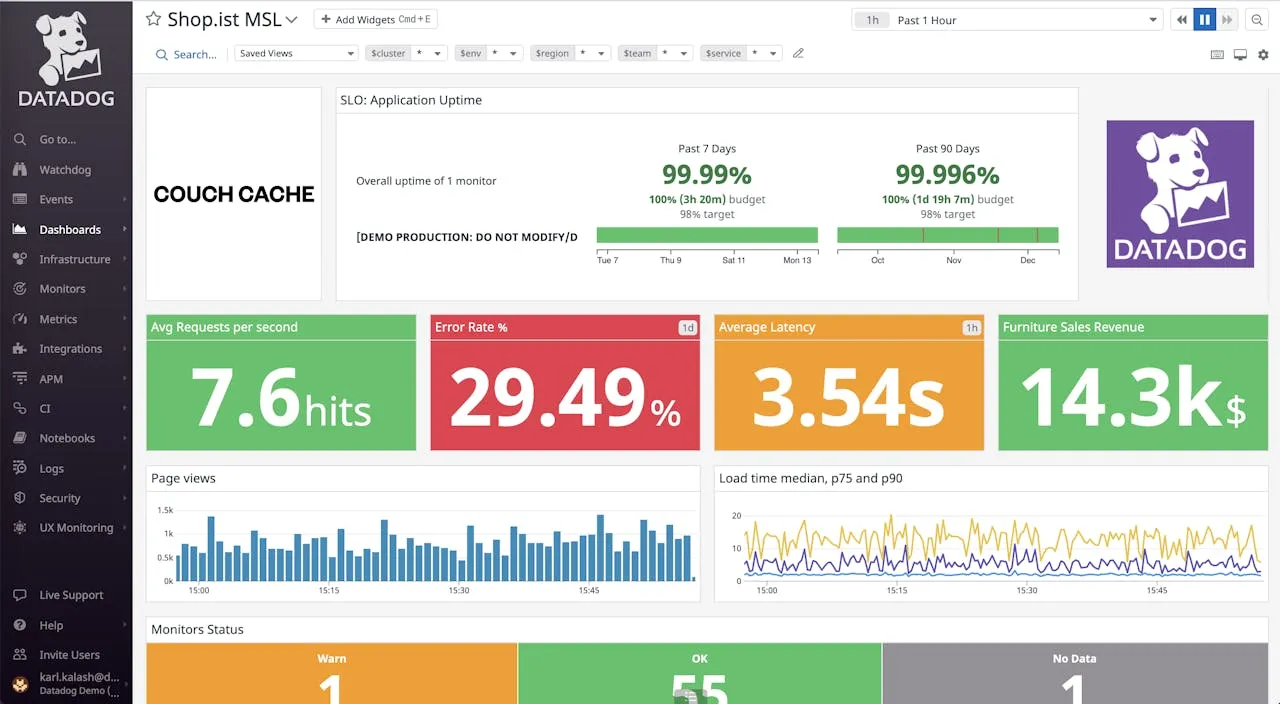
Datadog is the full observability platform on this list. It is the cloud-native end of the spectrum from PRTG’s on-prem Windows model.
Key features
- Full-stack observability: Metrics, logs, and traces in one place.
- 400+ integrations: Broad cloud and SaaS coverage.
- Synthetic monitoring: Uptime checks similar to PRTG.
Pros
- Polished UI: Fast, intuitive, and cloud-native.
- Deep metrics: Far richer than PRTG.
Cons
- Expensive: Per-host plus per-feature billing.
- Not network-device first: Less SNMP depth than PRTG or Zabbix.
Best for: Large teams that need full observability, not network-first monitoring.
Price Infrastructure starts at $15/host/mo. Logs, APM, and custom metrics billed separately.
7. ManageEngine OpManager
ManageEngine OpManager is a commercial monitoring platform popular in Windows-heavy and network-centric environments. It is a direct competitor to PRTG in audience.
Key features
- Auto-discovery: For network devices and Windows servers.
- Flow analysis: NetFlow, sFlow, jFlow for network traffic.
- Perpetual licensing: Available alongside subscription.
Pros
- Good fit for Windows and network IT: Same audience as PRTG.
- Flow analysis: Built-in traffic analysis that PRTG also offers.
Cons
- Cluttered UI: Feels enterprise-heavy and dated.
- Device-based licensing: Scales quickly for larger environments, similar friction to PRTG’s sensors.
- Weak cloud-native: Container and cloud monitoring are not its strength.
Best for: IT departments with heavy Windows and Active Directory environments plus network monitoring needs.
Price Free for up to 3 devices. Standard Edition starts at $245/year for 25 devices.
8. Site24x7
Site24x7 is an all-in-one monitoring suite from ManageEngine that covers uptime, server, network, application, and cloud monitoring in one product.
Key features
- Broad suite: Uptime, server, network, app, and cloud in one product.
- Monitors by type: A large catalog of monitor types.
- Status pages: Included.
Pros
- Wide coverage: One vendor for many monitoring needs.
- MSP-friendly: Multi-tenancy and client portals.
Cons
- Legacy bloat: The UI is dated and feature-dense.
- Add-on pricing: Many capabilities are billed as add-ons.
Best for: Organizations that want a single suite covering many monitoring types and accept a dated UI.
Price Free tier available. Paid plans are usage-based and stack with monitor types.
Conclusion
PRTG is a solid choice for small, Windows-centric environments that fit within the sensor limits. But as fleets grow, the per-sensor licensing, Windows server requirement, and manual sensor setup become real friction.
- For cloud-native and zero-config: Try Simple Observability. Fixed per-server price, no Windows core, no sensor counting.
- For large on-prem and network gear: Zabbix is the free, Linux-native heavyweight.
- For hybrid IT with auto-discovery: Checkmk is the closest spiritual successor.
Pick the tool that matches your platform and pricing tolerance. For a head-to-head breakdown, see our PRTG comparison page, and for another angle, our Icinga alternatives guide covers the Nagios-family side.