

Zabbix is a titan in the world of IT monitoring. For over two decades, it has been the go-to open-source solution for network engineers and sysadmins who need to monitor everything from switches to servers without paying licensing fees.
But power comes at a price. Zabbix is notoriously difficult to learn, complex to configure, and heavy to maintain. For many modern teams, the “free” price tag is outweighed by the hundreds of engineering hours spent managing templates, database schemas, and XML configurations.
If you are reading this, you probably already know that. You are looking for something that just works, without requiring a dedicated Ph.D. in Zabbix configuration.
In this article, we’ll explore the best Zabbix alternatives in 2026. We will focus on tools that reduce operational complexity, whether you are looking for a simplified SaaS solution or a more modern self-hosted platform.
Why do teams look for Zabbix alternatives?
While Zabbix is undeniably powerful, it often becomes a bottleneck for fast-moving teams. Here are the most common reasons organizations migrate away from it:
1. Steep learning curve & usability
Zabbix looks and feels like enterprise software from the mid-2000s. Its hierarchy of Hosts, Templates, Items, Triggers, and Actions is logical but extremely verbose. Onboarding new team members is slow, and non-experts often struggle to create even basic dashboards.
2. High maintenance overhead
Self-hosting Zabbix isn’t just about installing it. It involves managing a large database (usually PostgreSQL or MySQL) that grows rapidly. Configuring partitioning, tuning performance, and handling upgrades can become a full-time job. For smaller teams, this operational burden distracts from building their actual product.
3. Limited cloud-native support
Zabbix was born in the era of static racks and bare-metal servers. While it has added support for containers and clouds, it doesn’t feel native. Auto-scaling groups, ephemeral pods, and microservices often require complex discovery rules that are cumbersome to set up compared to modern observability standards.
How to evaluate alternatives?
When moving away from Zabbix, “simplicity” is usually the primary goal. However, you should also evaluate tools based on:
- Deployment Mode (SaaS vs. Self-Hosted): Do you want to offload the maintenance entirely (SaaS), or do you need to keep data on-premise for compliance (Self-Hosted)?
- Modern UI/UX: Can a developer or junior admin figure it out without reading a 500-page manual?
- Unified Observability: Does the tool combine metrics, logs, and alerts? Zabbix is primarily metrics-based; modern teams often want logs in the same view.
- Pricing Predictability: Zabbix is free. Moving to a tool with complex, usage-based billing (like Datadog) can lead to massive sticker shock.
Quick Summary: Top Alternatives
| Tool | Type | Best For | Complexity |
|---|---|---|---|
| Simple Observability | SaaS | Simplicity & Zero Ops | Low |
| Prometheus | Self-Hosted | Kubernetes & Cloud Native | High |
| Checkmk | Self-Hosted | Hybrid / Legacy IT | High |
| Datadog | SaaS | Enterprise / Deep Features | Medium |
| Better Stack | SaaS | Modern UI & Uptime | Low |
| PRTG | Self-Hosted | Windows / Networking | Medium |
8 Best Zabbix Alternatives
1. Simple Observability
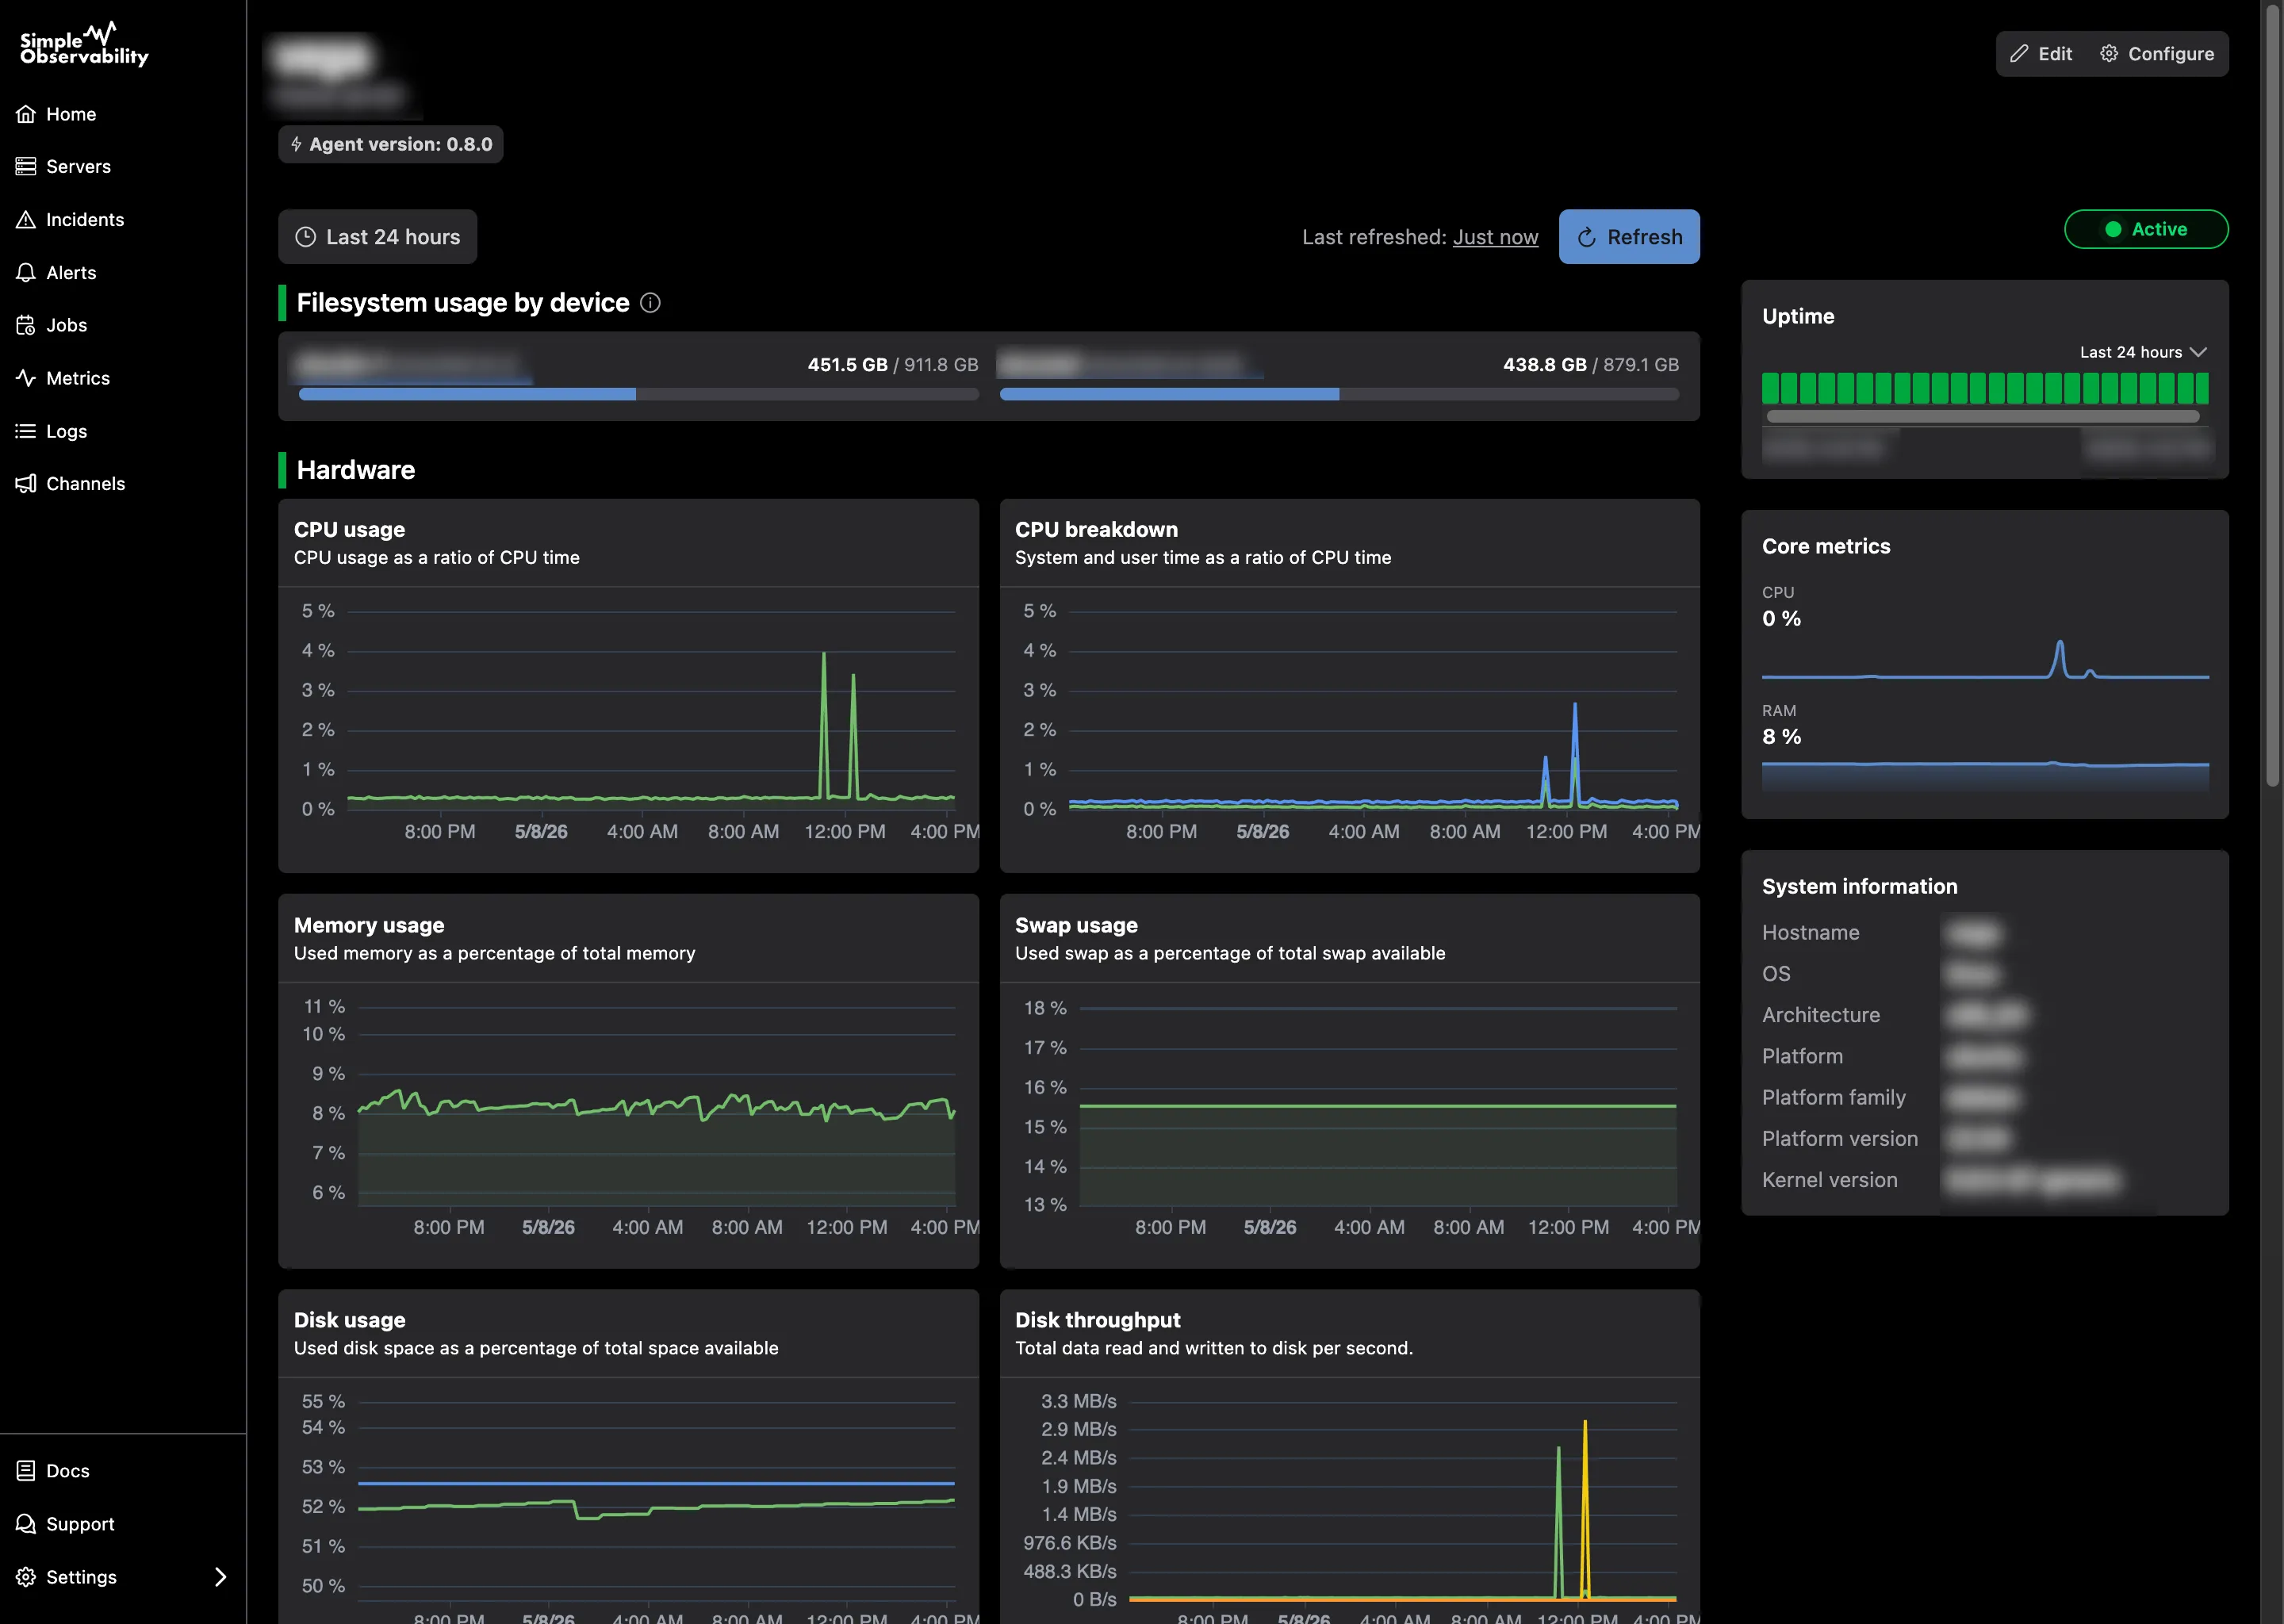
Simple Observability is the strongest alternative for teams that want to stop managing their monitoring stack and start using it. It is designed to be the exact opposite of Zabbix in terms of complexity: minimal setup, zero configuration, and a modern, intuitive interface.
Key features
- One-command install: No complex agent configuration. One command gives you CPU, memory, disk, and uptime monitoring instantly.
- Unified Logs & Metrics: Unlike Zabbix, which treats logs as a second-class citizen, Simple Observability integrates them seamlessly alongside metrics.
- SaaS convenience: We try to keep the costs low while removing the burden of database management and backups.
Why choose it over Zabbix? If you are tired of debugging Zabbix templates and maintaining a PostgreSQL database just to know if your servers are up, Simple Observability is the answer. It’s a “set and forget” solution for small to mid-sized teams.
Pros
- Zero maintenance: No server to manage, update, or patch.
- Modern UI: Clean, responsive, and mobile-friendly.
- Flat pricing: Predictable costs per server, unlike the complex custom metrics billing of enterprise tools.
Cons
- Less granular control: You can’t tweak every single polling interval down to the millisecond like in Zabbix.
- SaaS only: Not suitable for air-gapped environments.
Price
- Lite: Free for 1 server.
- Standard: $9/mo for 3 servers.
- Enterprise: Custom plans for larger fleets.
2. Prometheus & Grafana
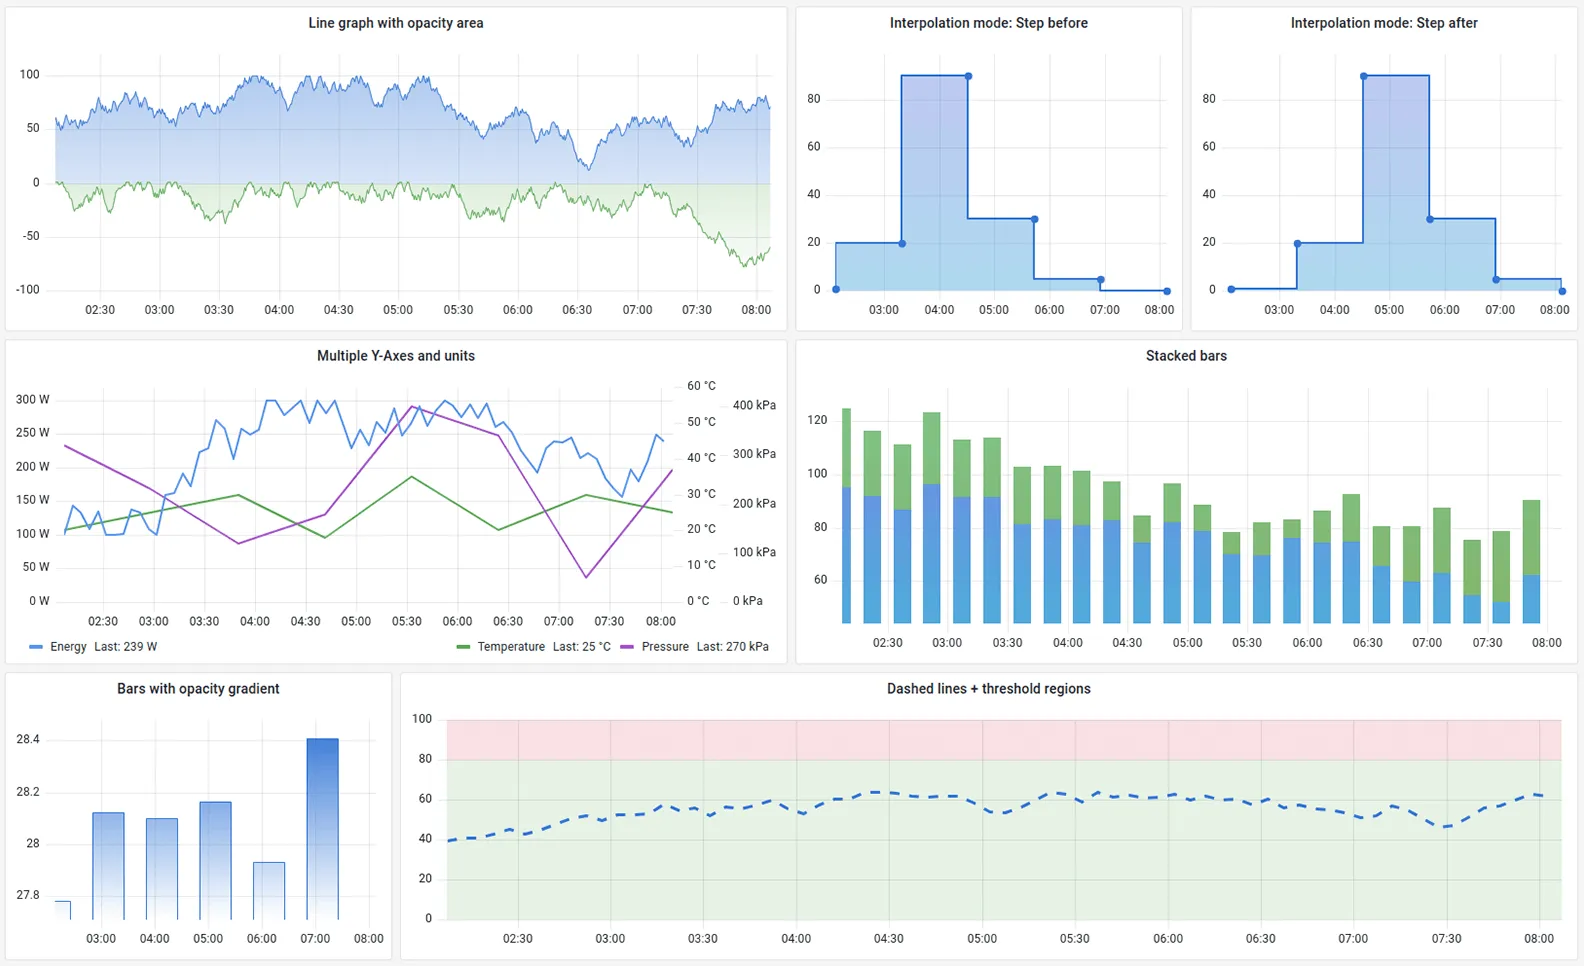
For modern engineering teams, Prometheus paired with Grafana has largely replaced Zabbix as the open-source standard. It uses a pull-based model and is the native language of Kubernetes.
Key features
- PromQL: A powerful query language that is far more flexible than Zabbix’s trigger expressions.
- Service Discovery: Native integration with Kubernetes, AWS, and other dynamic environments.
- Grafana Visualization: The industry’s best visualization tool, capable of creating stunning dashboards.
Why choose it over Zabbix? It is the standard for modern, cloud-native infrastructure. If you are running Kubernetes, Prometheus is effectively mandatory.
Pros
- Open Source: Free to use (if self-hosted).
- Huge Community: Massive ecosystem of exporters and dashboards.
- Scalable: Built for high-churn, dynamic environments.
Cons
- Complexity: You are still managing infrastructure. Setting up long-term storage (Thanos/Cortex) and high availability is non-trivial.
- Steep Learning Curve: PromQL is powerful but difficult to master.
Price Free (Self-Hosted). Managed versions available (Amazon Managed Prometheus, Grafana Cloud).
3. Checkmk
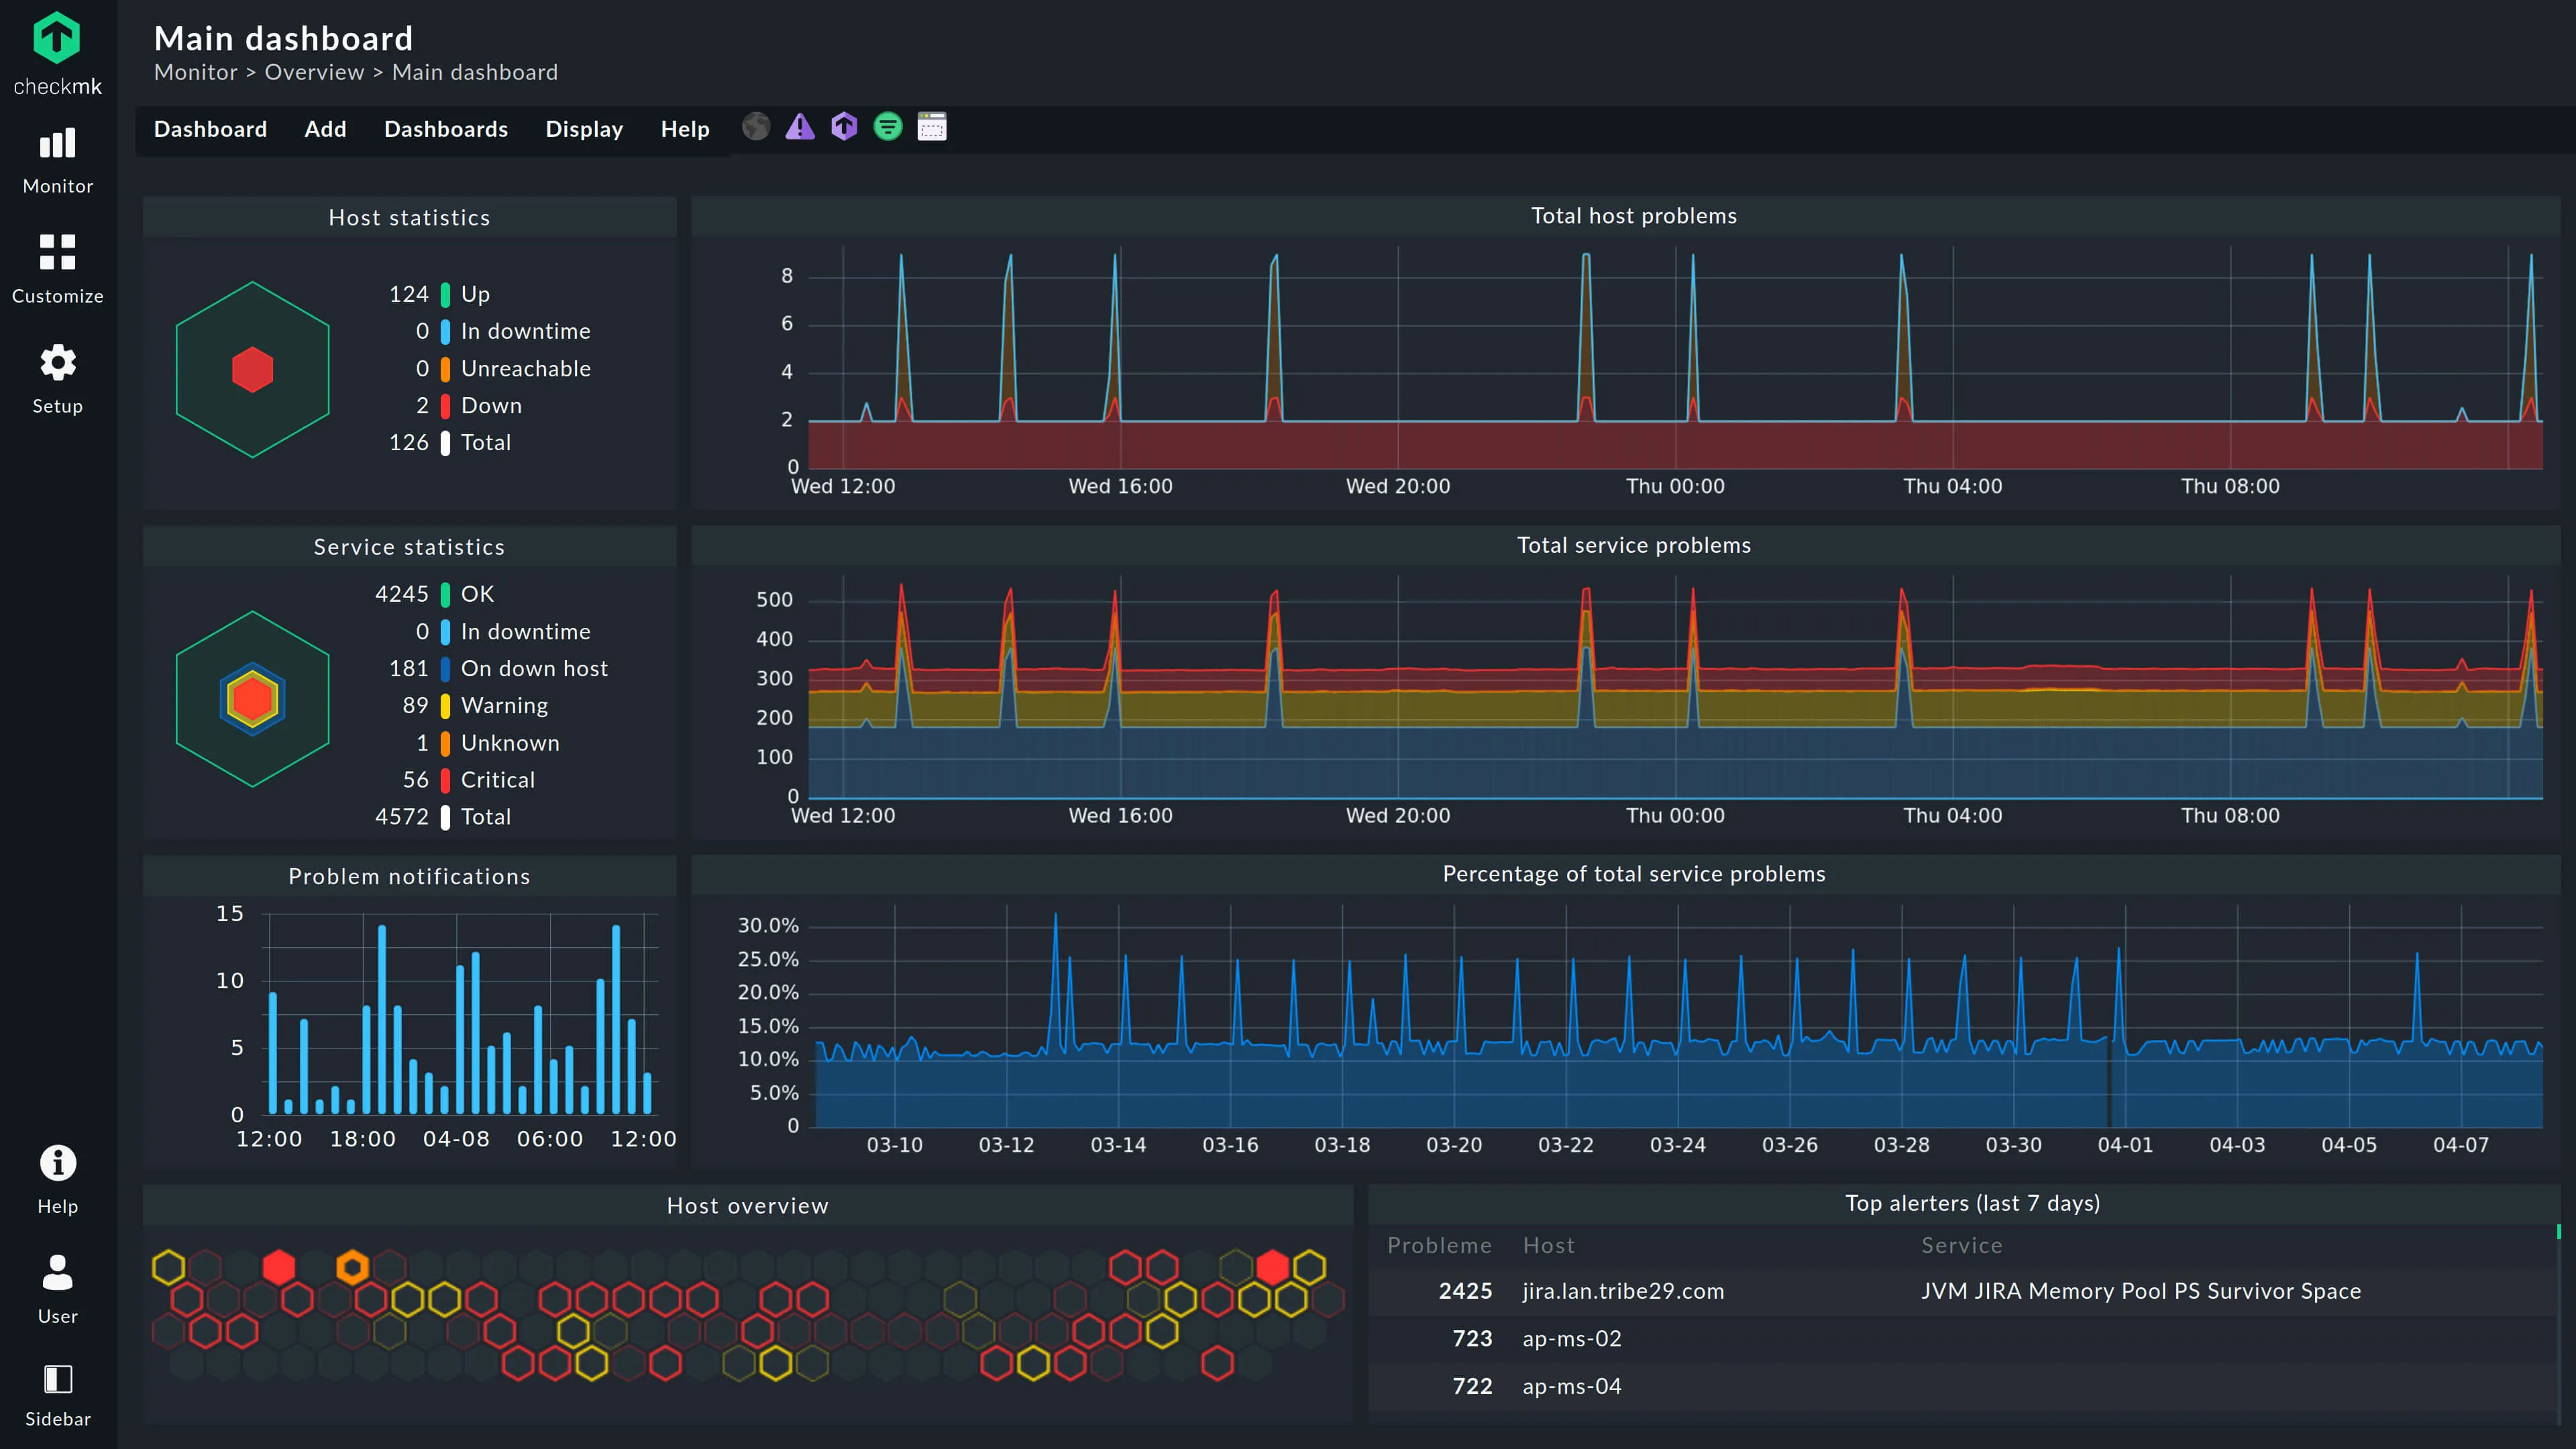
If you love the “monitoring everything” philosophy of Zabbix but want something slightly more polished and efficient, Checkmk is the spiritual successor. It handles both metrics and states extremely well and is very popular in the DACH region.
Key features
- Automated Setup: Outstanding auto-discovery of services (far better than Zabbix’s).
- Efficiency: optimized core can handle thousands of services on modest hardware.
- Hybrid Monitoring: Excellent for both legacy servers and modern containers.
Why choose it over Zabbix? Checkmk is often called “Nagios on steroids” or “Zabbix done right.” It requires less manual configuration than Zabbix to get the same level of depth.
Pros
- Performance: Extremely efficient agent and core.
- Depth: Can monitor hardware, switch ports, and SAP systems out of the box.
Cons
- UI: While better than Zabbix, it still feels utilitarian and dated compared to modern SaaS tools.
- Configuration: Still requires a significant learning curve.
Price Raw Edition is Open Source (Free). Enterprise Edition starts around ~$6/host/mo.
4. Datadog
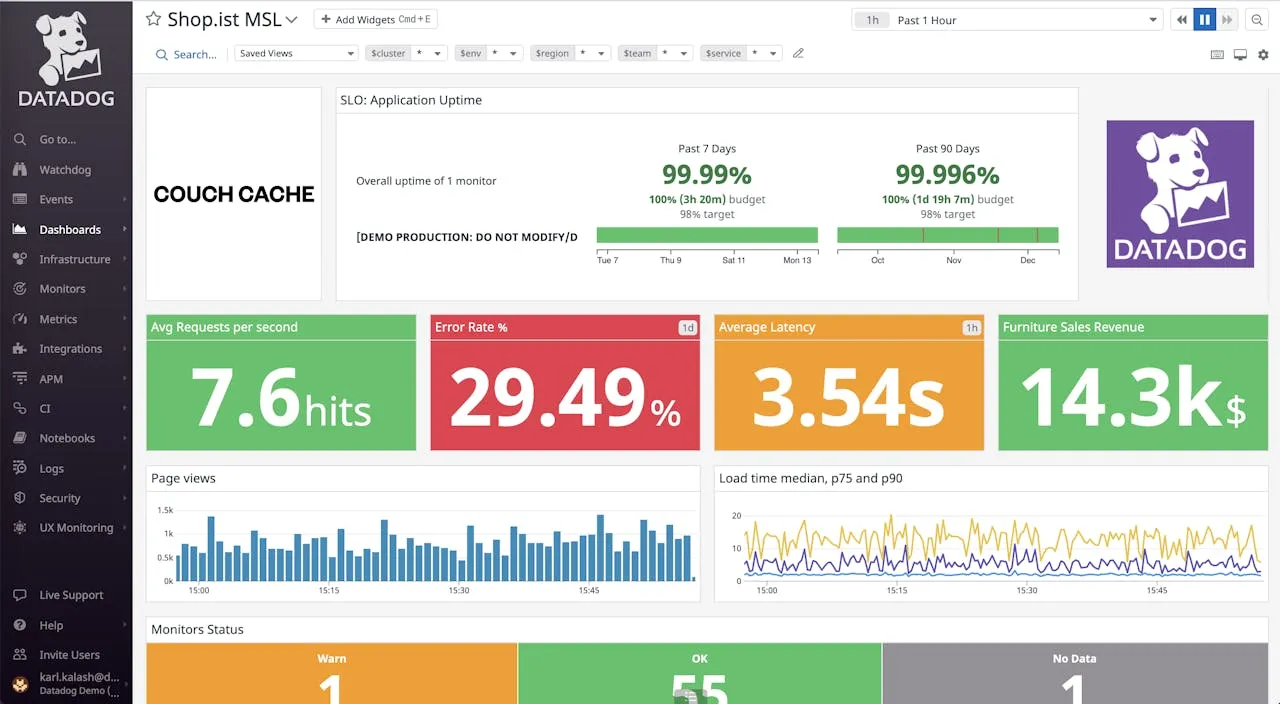
Datadog is the leader in the commercial observability space. It offers a comprehensive, all-in-one platform that covers infrastructure, APM, security, and logs.
Key features
- Full-Stack Observability: Seamless correlation between metrics, traces, and logs.
- AI/ML: Automated anomaly detection and watchdog alerts.
- Integrations: 500+ one-click integrations.
Why choose it over Zabbix? If you have the budget and want the best possible experience with zero maintenance, Datadog is the clear winner. It’s powerful, fast, and beautiful.
Pros
- Experience: Best-in-class UI and UX.
- Capability: Does everything (APM, CI/CD, Security, RUM).
Cons
- Cost: Extremely expensive. The billing is complex, and costs can spiral out of control if not carefully managed.
- Vendor Lock-in: Proprietary agent and data formats.
Price Starts at $15/host/mo, but real-world costs are often much higher due to custom metrics and log ingestion fees.
5. Better Stack
Better Stack (formerly Better Uptime + Logtail) is a modern challenger that focuses heavily on design and user experience. It started as an incident management tool but has grown into a monitoring platform.
Key features
- Beautiful Dashboards: Distinctive dark-mode UI that looks great on marketing screens.
- Incident Management: Built-in on-call scheduling and status pages.
- SQL-based Logs: Query your logs using standard SQL.
Why choose it over Zabbix? If you value aesthetics and want your monitoring system to double as your status page and on-call paging system (“PageDuty alternative”), Better Stack is a great fit.
Pros
- Design: Arguably the best-looking tool on the market.
- Integrated On-Call: Saves you from paying for a separate PagerDuty subscription.
Cons
- Younger Platform: Less mature than Zabbix or Datadog in terms of deep infrastructure metrics.
Price Free tier available. Paid plans start around $25/month/user.
6. PRTG Network Monitor
PRTG by Paessler is a classic Windows-based monitoring tool. It is widely used in environments that are predominantly Microsoft-based or focused on networking gear.
Key features
- Sensor-based licensing: You pay for “sensors” (metrics), not hosts.
- Windows Native: Runs on Windows Server, which is rare in this space.
- Auto-Discovery: Scans network ranges to find devices automatically.
Why choose it over Zabbix? If your team is comfortable with Windows and wants a tool that is easier to configure than Zabbix (drag-and-drop interface), PRTG is a solid choice.
Pros
- Ease of Setup: Much easier to install and configure than Zabbix on Windows.
- Visuals: Famous for its hierarchical “sunburst” map.
Cons
- Windows Dependency: The core server must run on Windows.
- Licensing: The sensor-based pricing can get expensive if you monitor many metrics per switch/server.
Price Perpetual license model (starting ~$1,900) or subscription. Free for up to 100 sensors.
7. New Relic
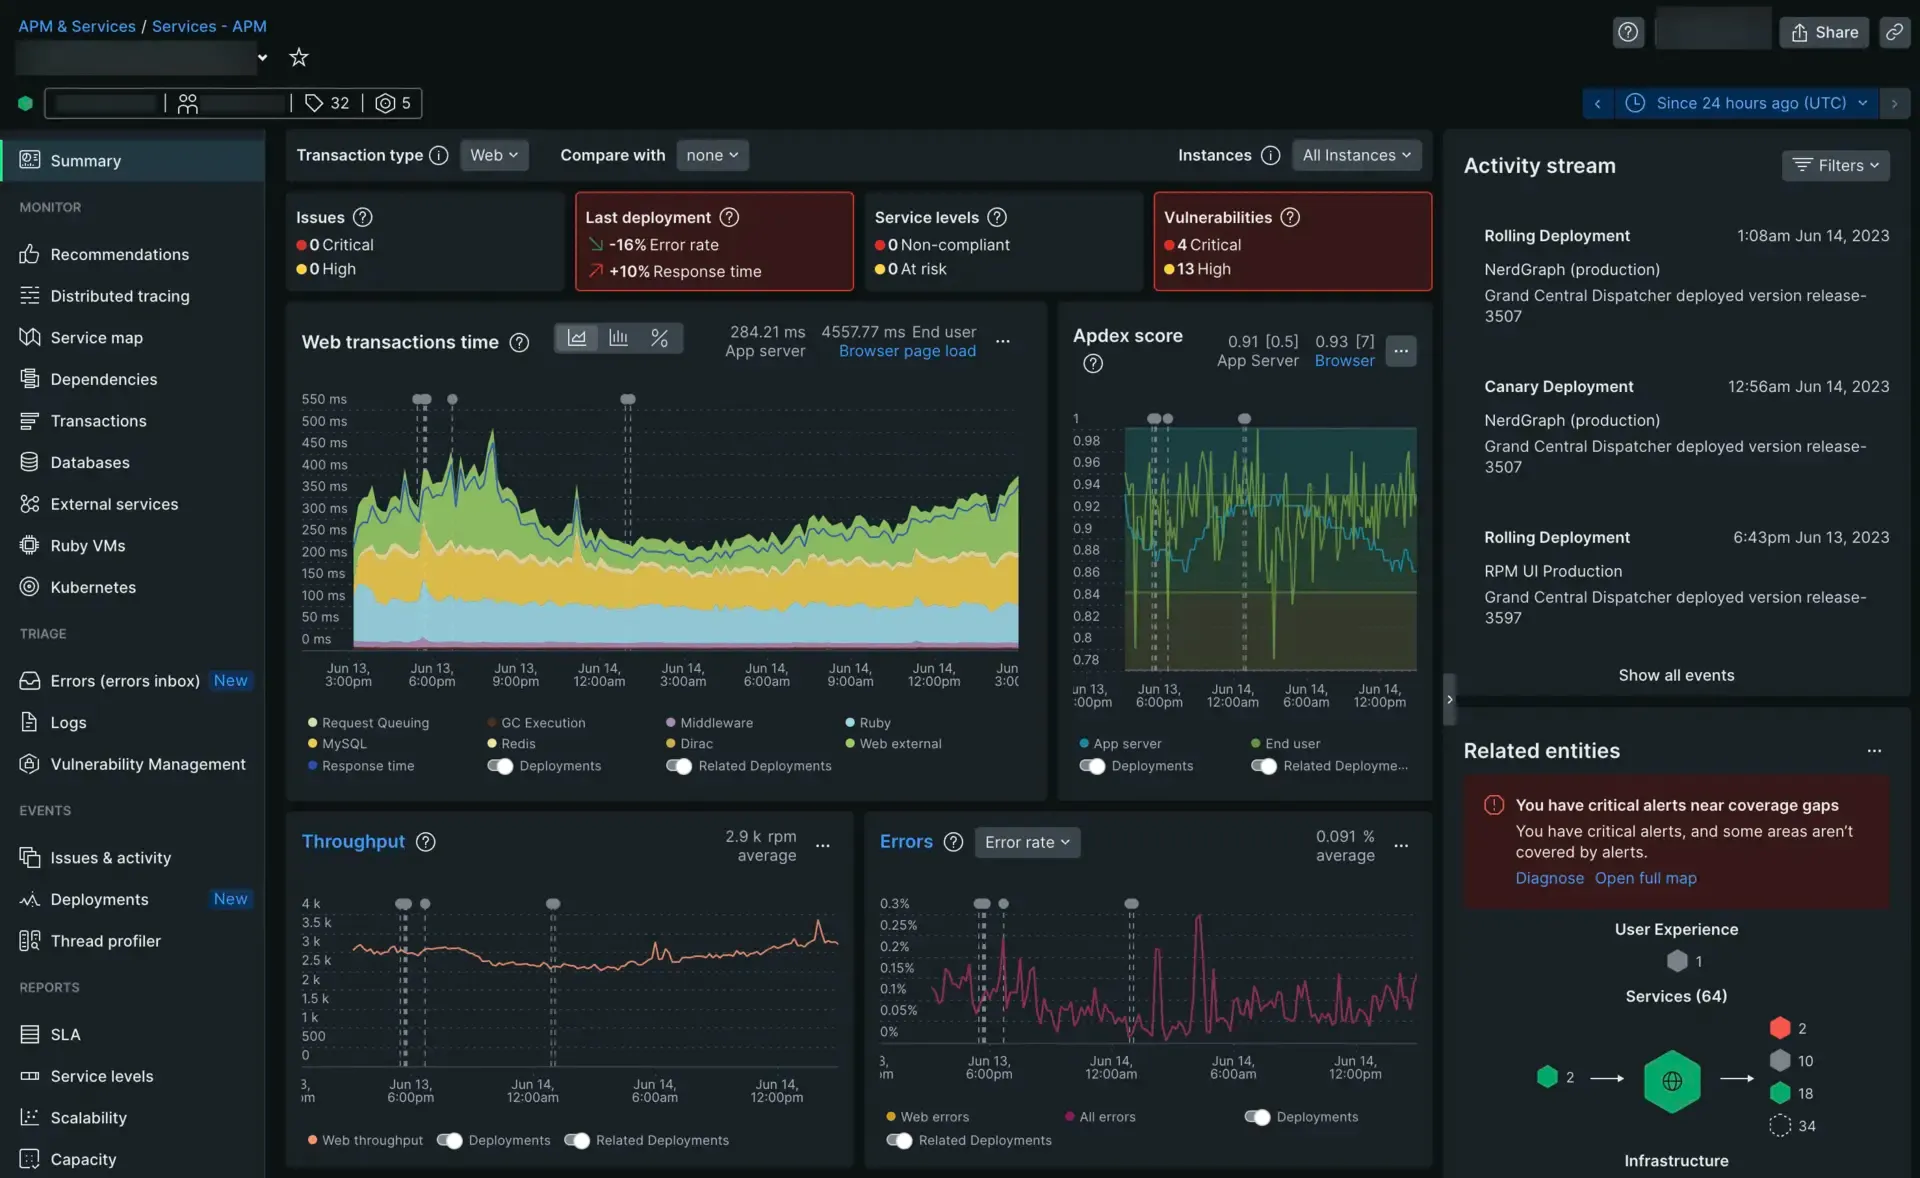
New Relic is an observability platform with a strong heritage in Application Performance Monitoring (APM). Like Datadog, it offers a complete view of your stack.
Key features
- Deep APM: Code-level insights for Java, .NET, Node.js, etc.
- Usage-based pricing: You pay for data ingested and user seats, rather than per host.
- Programmability: Build custom apps on top of the New Relic One platform.
Why choose it over Zabbix? If your primary need is debugging application code rather than just checking if the server is running, New Relic’s APM capabilities blow Zabbix away.
Pros
- Developer Focus: Excellent for finding why an API endpoint is slow.
- Generous Free Tier: 100GB/month free for the entire platform.
Cons
- Complexity: The UI can be dense and overwhelming.
- Cost: “Full Platform User” seats are expensive (~$99/user/mo) for advanced features.
Price Usage-based (100GB free).
8. Icinga
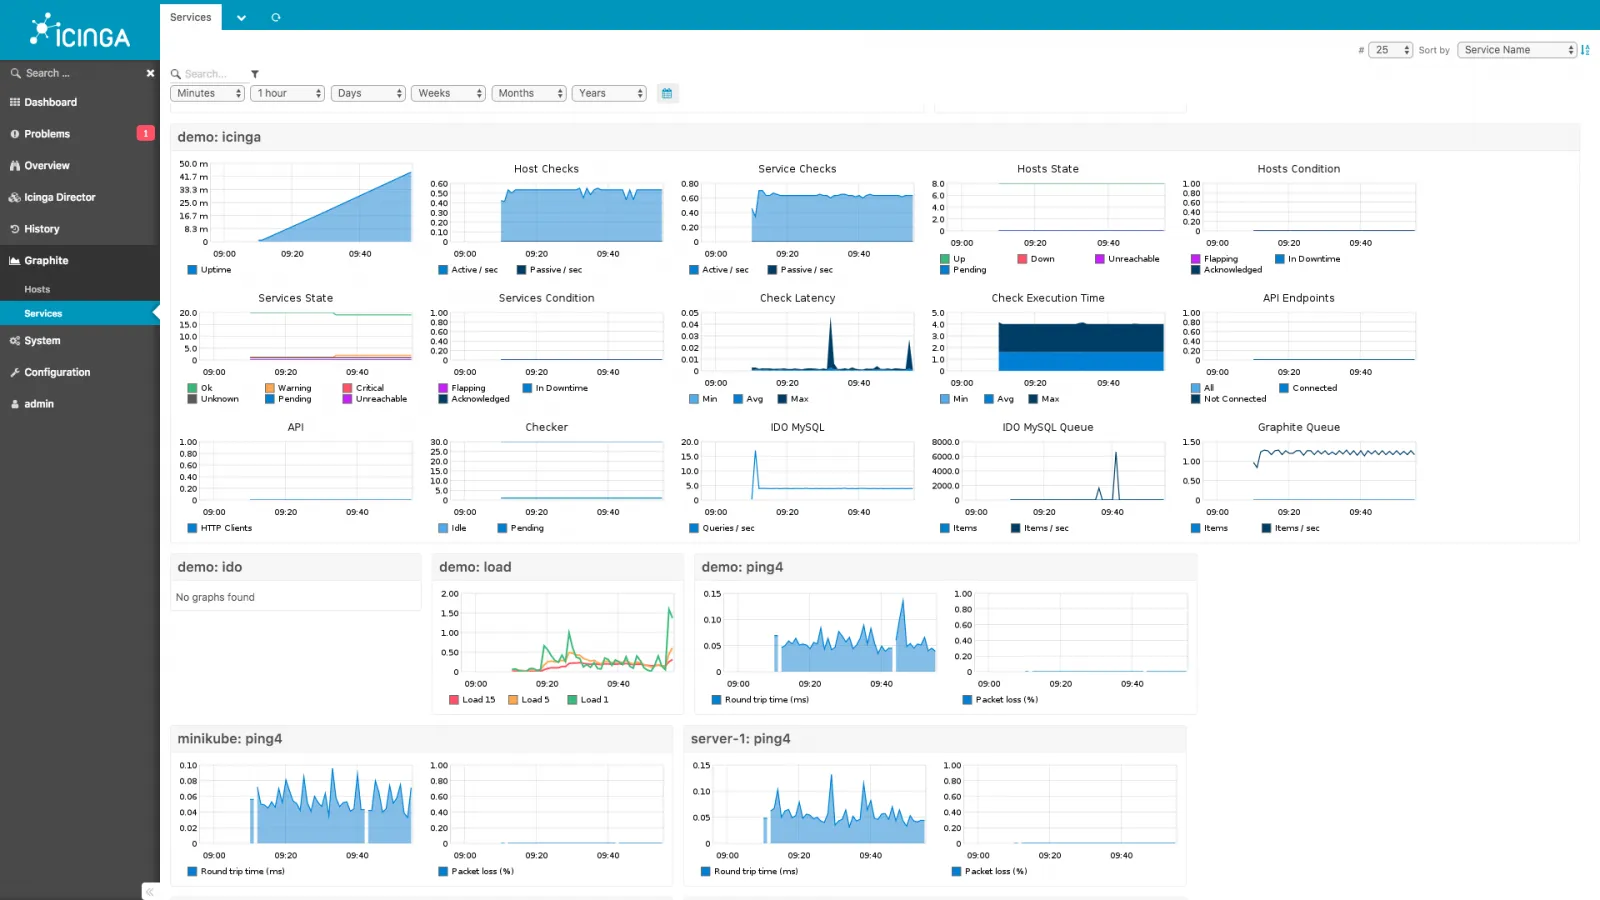
Icinga began as a fork of Nagios and has evolved into a modern, flexible monitoring system. It keeps the “config-as-code” philosophy but adds a responsive web interface and a distributed architecture.
Key features
- DSL Configuration: Uses a domain-specific language for configuration that is cleaner than Zabbix’s XML.
- Nagios Plugins: Compatible with the vast library of Nagios checks.
- Icinga Director: A web GUI to manage configuration for those who dislike text files.
Why choose it over Zabbix? If you want a free, open-source, self-hosted tool but prefer a configuration-driven approach over Zabbix’s database-driven configuration.
Pros
- Flexibility: extremely customizable for complex check logic.
- Open Source: Truly free.
Cons
- Learning Curve: The Icinga DSL takes time to learn.
- Setup: Initial installation and setup are involved.
Price Free (Open Source). Support subscriptions available.
Conclusion
Zabbix is a legendary tool, but in 2026, you don’t always need a legend—sometimes you just need a tool that works without hiring a consultant to configure it.
- For the absolute simplest experience: Try Simple Observability. It removes the noise and gives you exactly what you need to keep your servers running.
- For Kubernetes environments: Prometheus is the undisputed champion.
- For deep on-prem legacy setups: Checkmk offers a more refined experience than Zabbix.
If you are also evaluating other tools, check out our guide on Netdata Alternatives for a focused look at real-time monitoring options.