

Netdata is a well-known open-source monitoring platform with a unique edge-first, distributed architecture that enables real-time metrics with second-level granularity. While this approach is powerful for certain use cases, it comes with tradeoffs: higher resource usage on each node and complexity when scaling across hundreds of servers.
If you’re looking for something simpler, Simple Observability offers a lightweight alternative. It’s built around an open-source agent that uses minimal resources and takes literally one command to install. Everything else gets configured through the UI, so you can skip the YAML wrangling.
In this article, we’ll walk through the best alternatives to Netdata in 2026. We’ll start with an overview of what Netdata does well (and where it struggles), then cover the key criteria you should consider when evaluating monitoring tools. Finally, we’ll compare each option to help you find the right fit for your team.
Quick summary
| Tool | Best For | Price Model |
|---|---|---|
| Simple Observability | Simplicity & Unification | $3 / mo / server |
| Prometheus & Grafana | Cloud Native / K8s | Free (OSS) / Managed paid |
| Checkmk | Complex IT / Hybrid | ~$6 / host / month |
| Datadog | Enterprise / Cloud | $15+ / host / month |
| New Relic | App Performance (APM) | Usage based ($0.30/GB) |
| Icinga | Flexible Configuration | Free (OSS) |
| Zabbix | Network / On-Prem | $50 / mo (Cloud) |
| Nagios | Legacy Stability | $2,495+ (XI License) |
Netdata Overview
Known for
Netdata is best known for its real-time, high-resolution data. The platform collects system metrics every second and maintains roughly 1-second latency from collection to visualization. It’s designed for immediate troubleshooting when you need that level of granularity.
Key features
- Real-time metrics: Second-level granularity for immediate feedback.
- Unsupervised ML: Built-in anomaly detection that flags outliers without manual thresholds.
- Auto-discovery: Automatically detects services and apps running on the host.
- Distributed architecture: Data is typically stored at the edge (on the node itself), which reduces central storage costs but increases local resource usage.
Why look for a Netdata alternative?
While Netdata excels at real-time single-node monitoring, its architecture creates some practical challenges.
1. Scalability in dynamic environments
Netdata’s distributed nature works well for storage efficiency, but managing it across hundreds of ephemeral containers or microservices gets complicated fast. Aggregating data from thousands of nodes typically requires significant configuration, or you end up relying on Netdata Cloud, which brings its own costs and complexity.
2. Resource overhead
Because Netdata processes high-resolution data and runs anomaly detection directly on each agent, it uses more CPU and RAM than lightweight forwarders like Telegraf or the Simple Observability agent. In resource-constrained environments, this observer effect can be a real problem.
3. Missing observability pillars
Netdata is primarily a metrics tool. It recently added log handling (indexing logs at the edge), but it still lacks native distributed tracing support. That’s on their roadmap for 2026, but if you need full-stack observability (metrics, logs, and traces) today, you’ll need to piece together multiple tools.
How to choose an alternative?
When evaluating alternatives, consider these core criteria:
- Agent Efficiency: Look for lightweight agents written in efficient languages (Go, Rust, C++) that won’t impact your production workloads.
- Unified Observability: Does the tool support Metrics, Logs, and Alerts in a single pane of glass?
- Ease of Use: Can you set it up in minutes (Time-to-Value), or does it require weeks of configuration?
- Pricing: Is the pricing model predictable? Avoid tools with complex metered billing if you have a strict budget.
8 Best Netdata Alternatives
1. Simple Observability
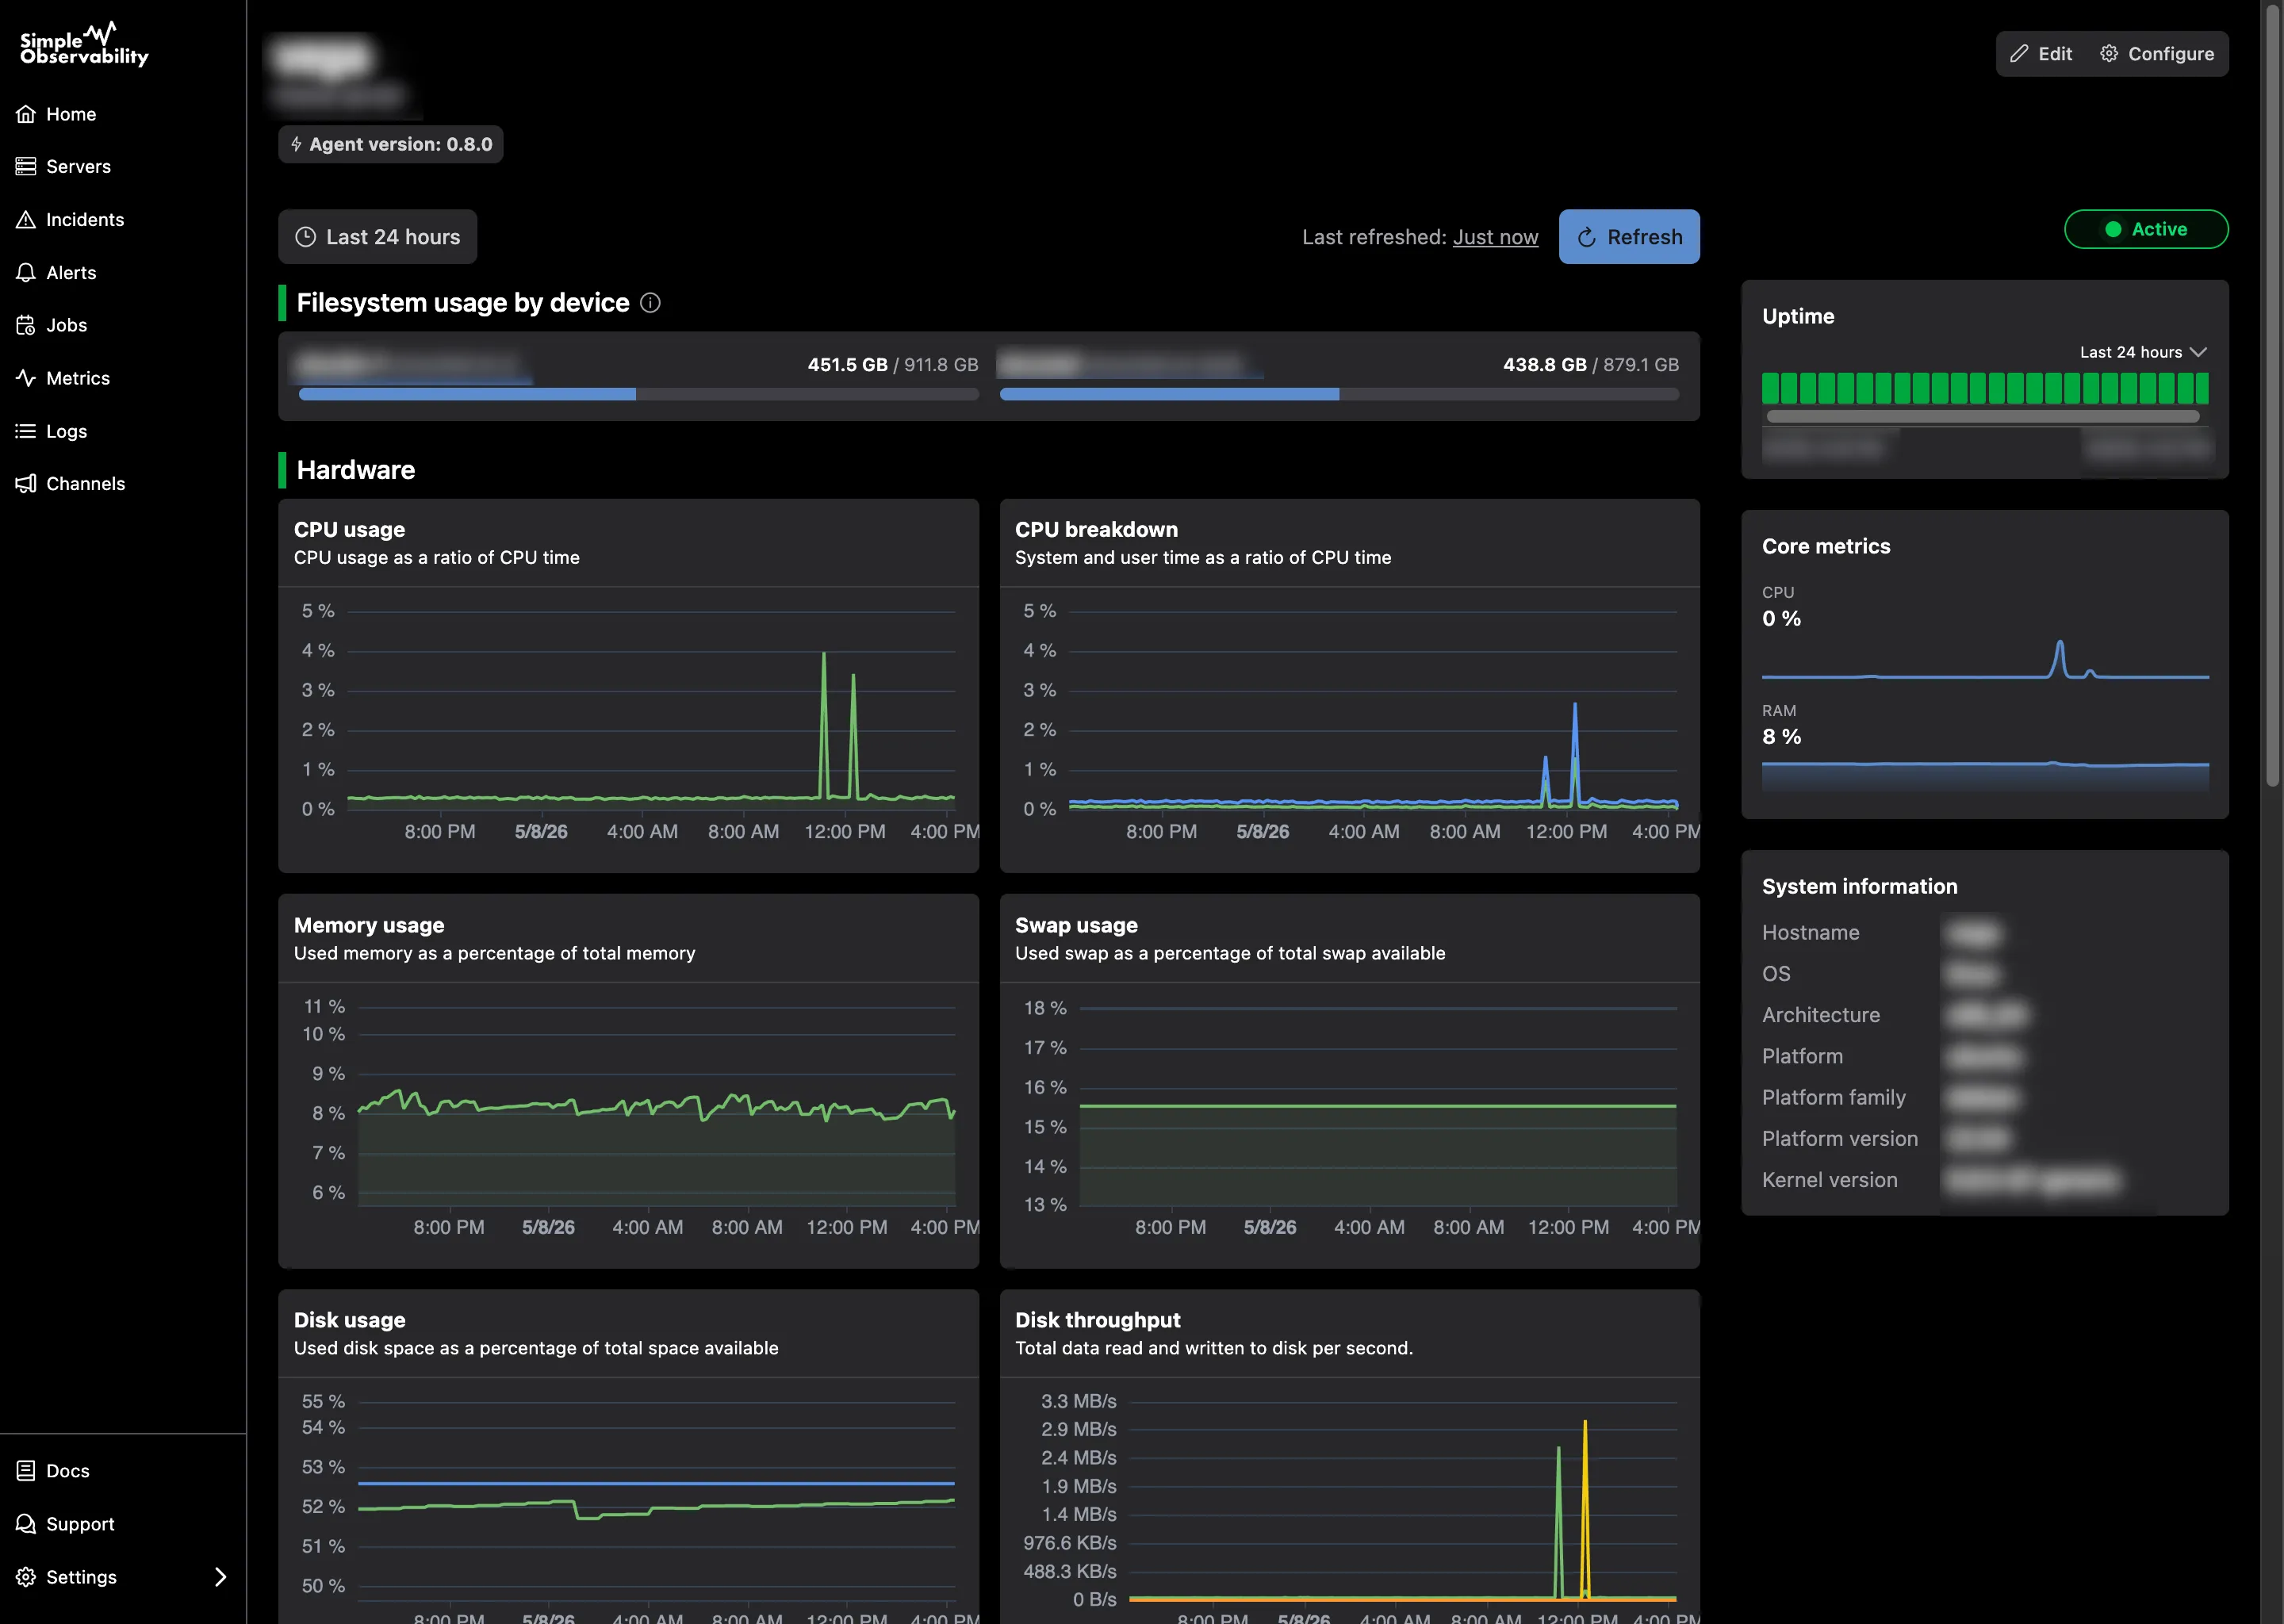
Simple Observability is a server monitoring platform designed to be the most straightforward alternative for teams that want results without the hassle. It combines metrics and logs in a unified interface, replacing arguably three separate tools (Metrics, Logs, Uptime) with one.
Key features
- Unified dashboard: View CPU/memory spikes alongside application logs in the same view.
- Zero-config alarms: Comes with sensible defaults so you’re protected from day one.
- Lightweight agent: Highly optimized open-source agent that respects your server’s resources.
- SaaS convenience: No need to host your own metrics database or retention stack.
Simple Observability vs Netdata Unlike Netdata, which can be overwhelming with thousands of metrics out of the box, Simple Observability focuses on signal over noise. It provides the critical metrics you actually need to run production systems, stored centrally so you don’t lose data if a node dies (a risk with Netdata’s default local storage).
Pros
- Extremely easy to use: One-command install, zero configuration needed.
- Predictable pricing: Flat fee per server. No “per million custom metrics” or “per GB log” surprises.
- Full historical data: Long-term retention included by default.
Cons
- Less granular: While Netdata offers 1-second resolution, Simple Observability uses standard 60s intervals to keep costs and bandwidth reasonable.
Best for: Startups, agencies, and DevOps teams who want a “set and forget” monitoring solution that just works.
Price
- Free: $0 for 1 server.
- Paid: $3/mo per server for unlimited servers.
- Custom: Volume discounts for large fleets.
2. Prometheus & Grafana
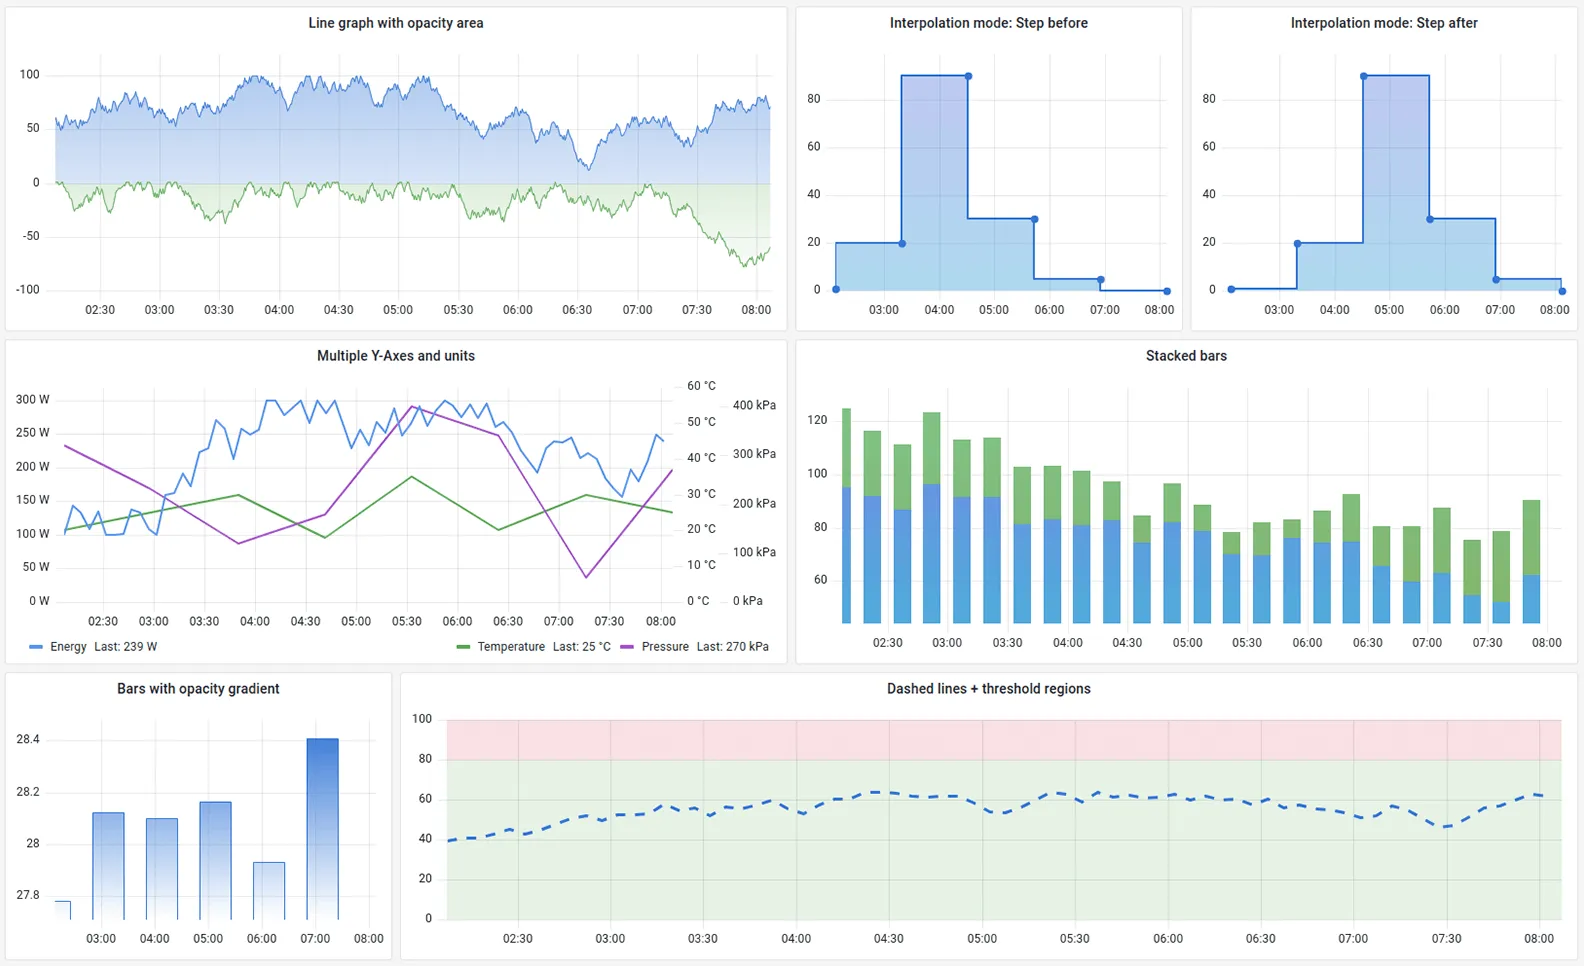
Prometheus paired with Grafana is the industry standard for cloud-native monitoring. It is a powerful, open-source combination where Prometheus collects the metrics and Grafana visualizes them.
Key features
- Multi-dimensional data model: Powerful queries using PromQL.
- Huge ecosystem: Exporters available for almost every piece of software in existence (Redis, Postgres, Nginx, etc.).
- Alertmanager: Handles alerts with sophisticated routing and grouping.
Pros
- Industry standard: The de facto choice for Kubernetes monitoring.
- Open source: Completely free to use if self-hosted.
- Flexibility: You can build any dashboard imaginable in Grafana.
Cons
- Complexity: Requires setting up and maintaining two separate pieces of software (Prometheus + Grafana).
- Storage: You’re responsible for managing long-term storage and backups (often requires adding Thanos or Cortex for scalability).
- Steep learning curve: PromQL is powerful but takes time to master compared to point-and-click interfaces.
Best for: Kubernetes environments, platform engineering teams, and organizations with dedicated SRE resources.
Price Free (Open Source). However, running at scale usually requires paid storage extensions (Thanos) or managed services like Grafana Cloud or Amazon Managed Prometheus which are usage-based.
3. Checkmk
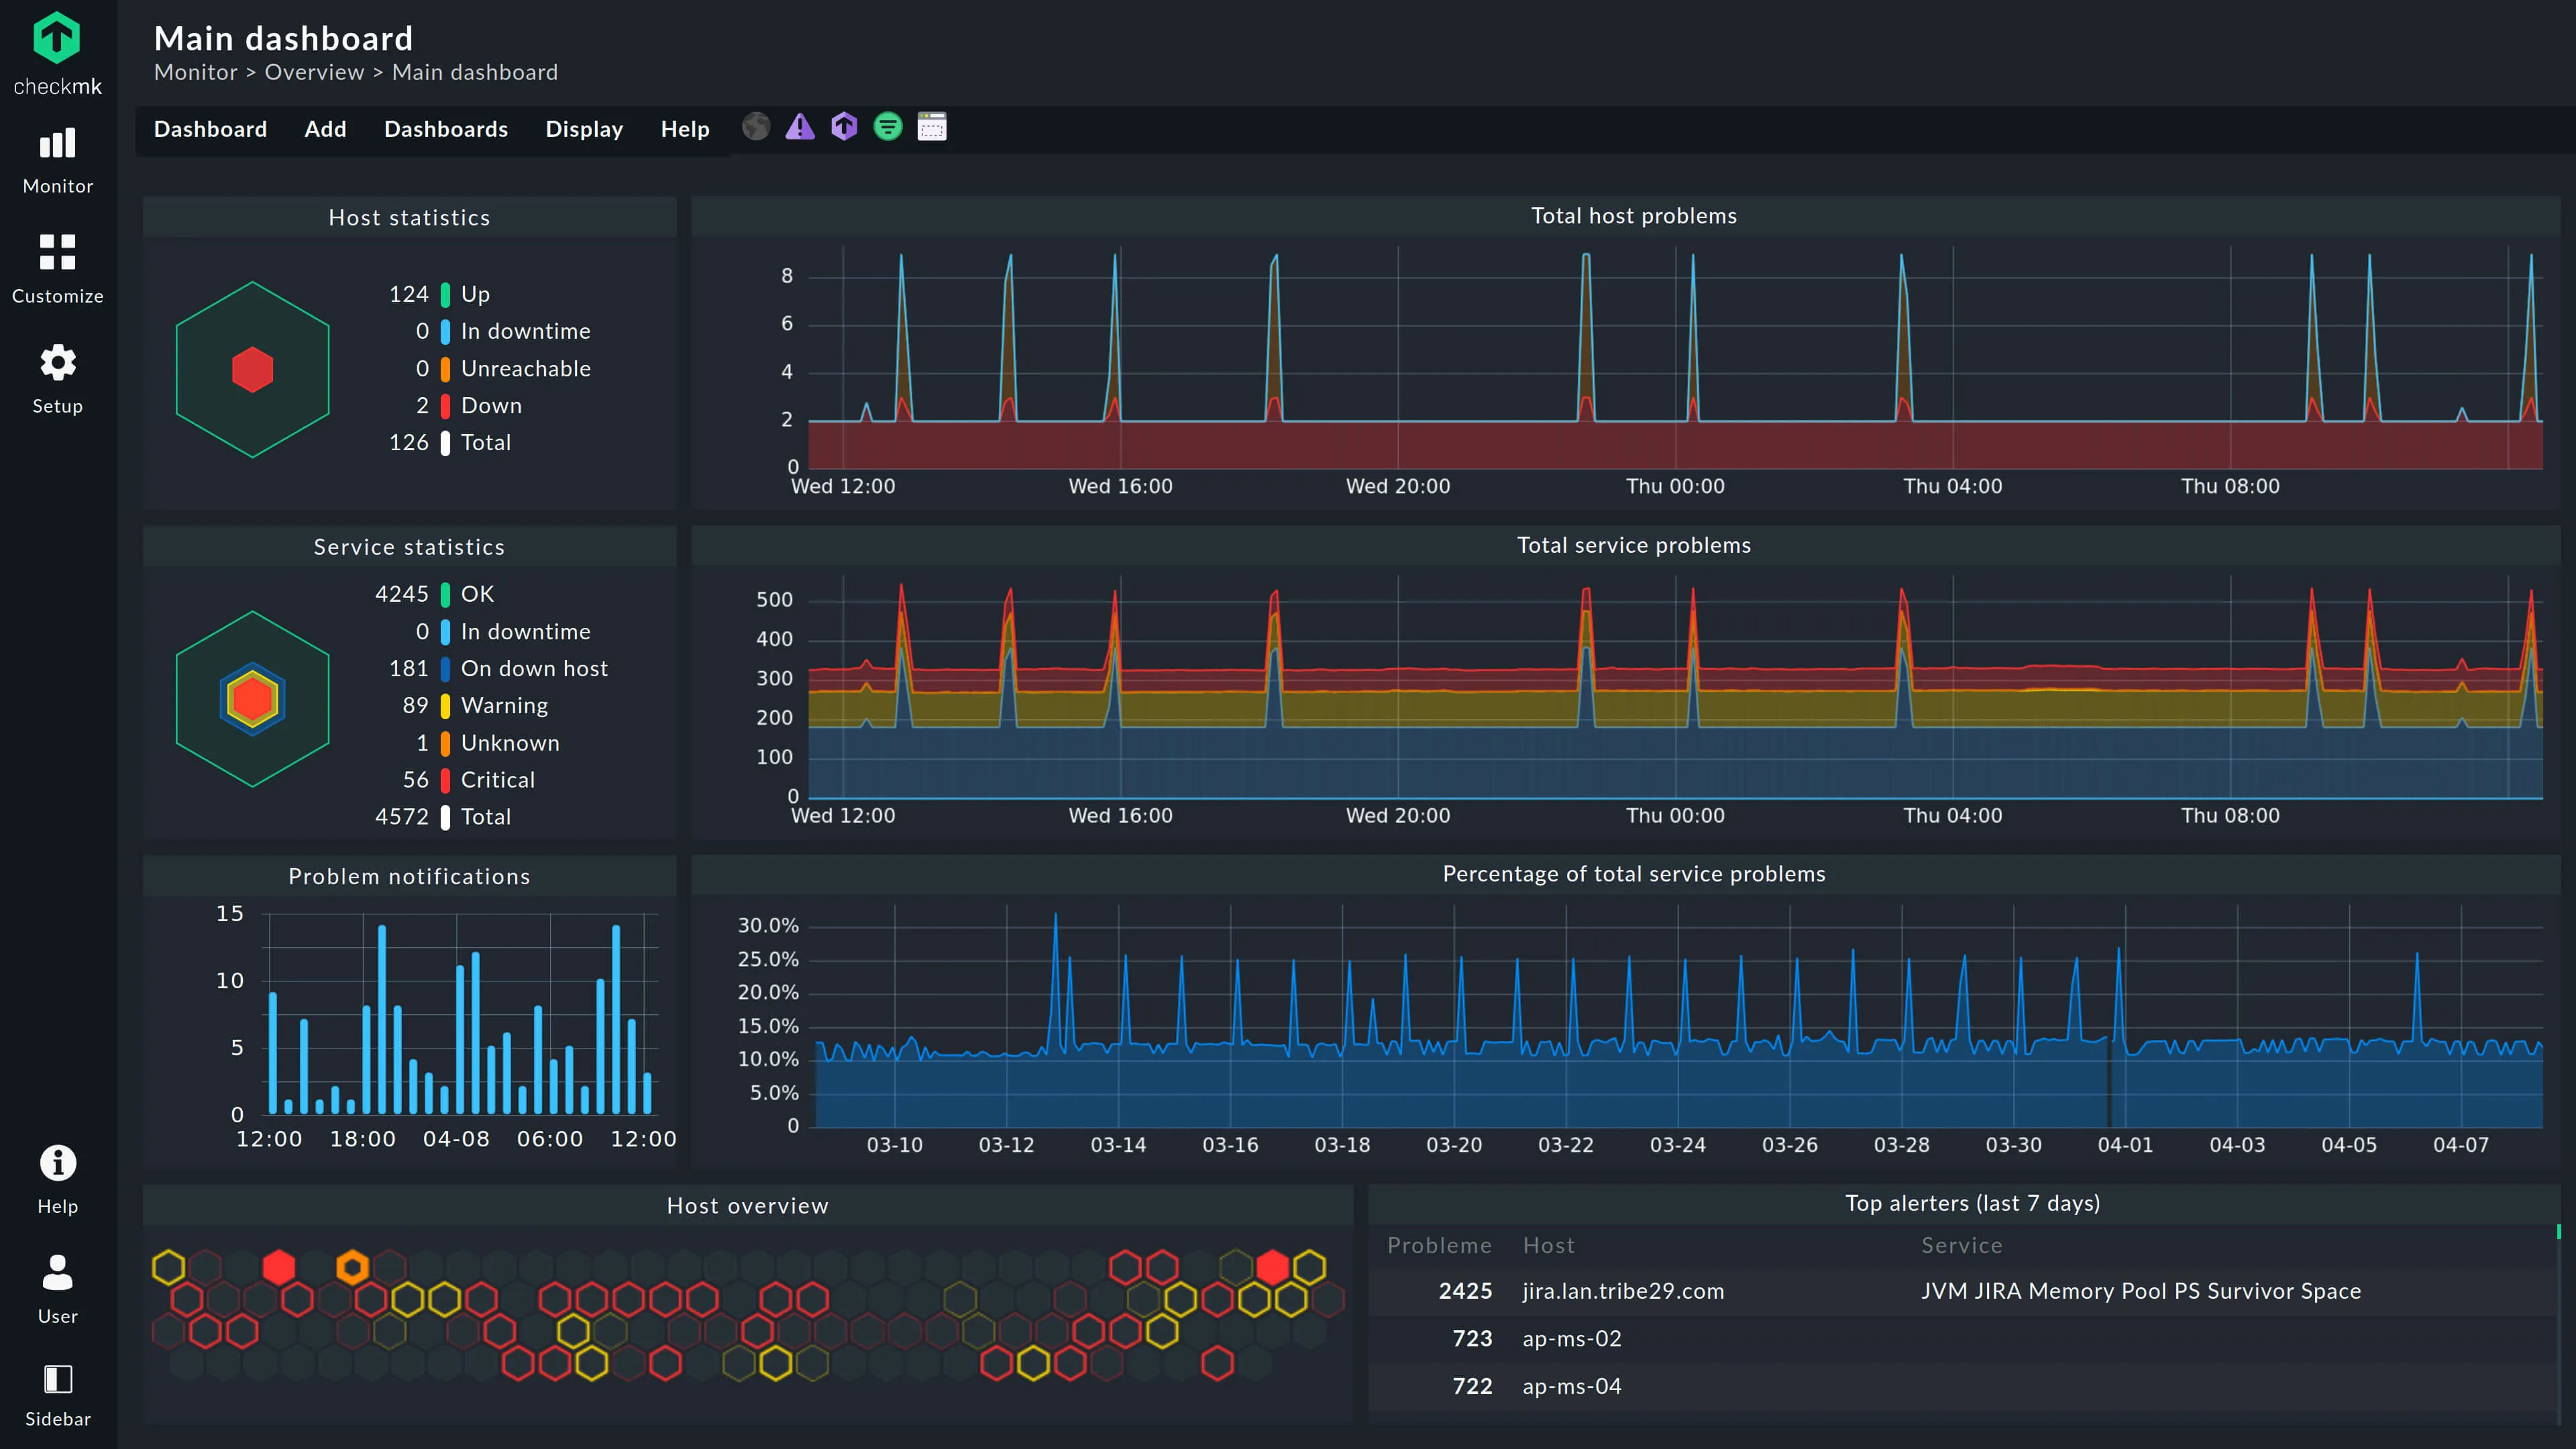
Checkmk is a comprehensive monitoring tool that excels in complex, hybrid IT environments. It bridges the gap between old-school Nagios-style checks and modern metric collection.
Key features
- Hybrid monitoring: Equally good at monitoring bare metal, switches, and Docker containers.
- Automatic service discovery: Scans hosts to automatically find running services and configure checks.
- 2,000+ plugins: Massive library of integrations.
Pros
- All-in-one: Handles both state-based monitoring (Up/Down) and metric performance well.
- Scalable: Can handle thousands of services on a single server thanks to its efficient core.
Cons
- UI/UX: The interface, while functional, can feel cluttered and dated compared to modern SaaS tools.
- Configuration: Extremely powerful but has a steep learning curve for advanced features.
Best for: Sysadmins and IT departments managing a mix of legacy hardware, on-prem servers, and cloud instances.
Price Open Source edition is free. Enterprise starts at ~$2,100/yr for 3,000 services (approx. 100 hosts). SaaS editions start at ~$6 per host/month (billed per service).
4. Datadog
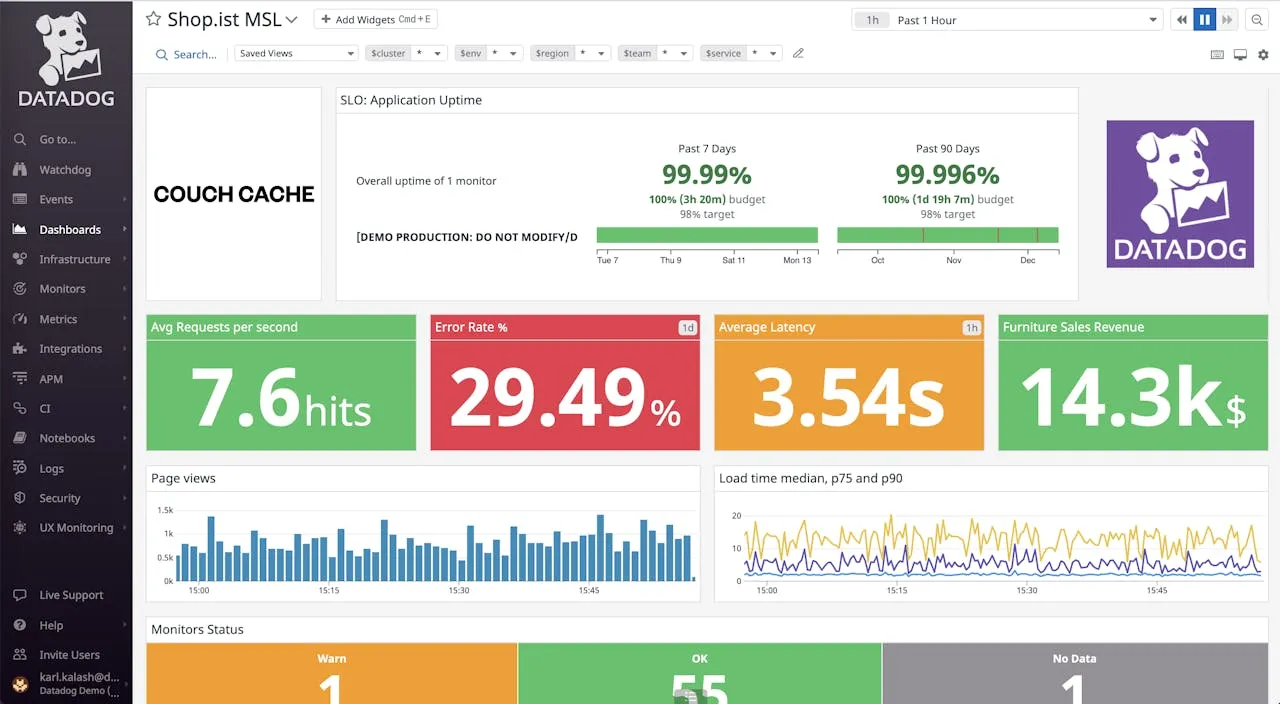
Datadog is the 800-pound gorilla of the observability space. It offers a massive, unified platform covering every possible angle of monitoring: Infrastructure, APM, Logs, Security, Network, and RUM.
Key features
- Full-stack observability: Truly unified data correlation across traces, logs, and metrics.
- Watchdog AI: Automated anomaly detection that often spots issues before you do.
- 400+ integrations: Point-and-click integrations for AWS, Azure, Google Cloud, and SaaS tools.
Pros
- Polished UI: Intuitive, fast, and genuinely pleasant to use.
- Deep visibility: The level of insight for APM and tracing is unmatched.
Cons
- Cost: Infamously expensive. The “per host” price is just the entry ticket; custom metrics, log ingestion, and retention add up quickly.
- Vendor lock-in: The proprietary agent and data format make it hard to leave once you’re deeply integrated.
Best for: Large enterprises and high-growth tech companies where engineering velocity is more valuable than optimizing the monitoring bill.
Price Infrastructure starts at $15/host/mo. However, this is rarely the final price. APM, Logs ($0.10/GB indexed), and Custom Metrics are all billed separately, often doubling or tripling the base cost in production.
5. New Relic
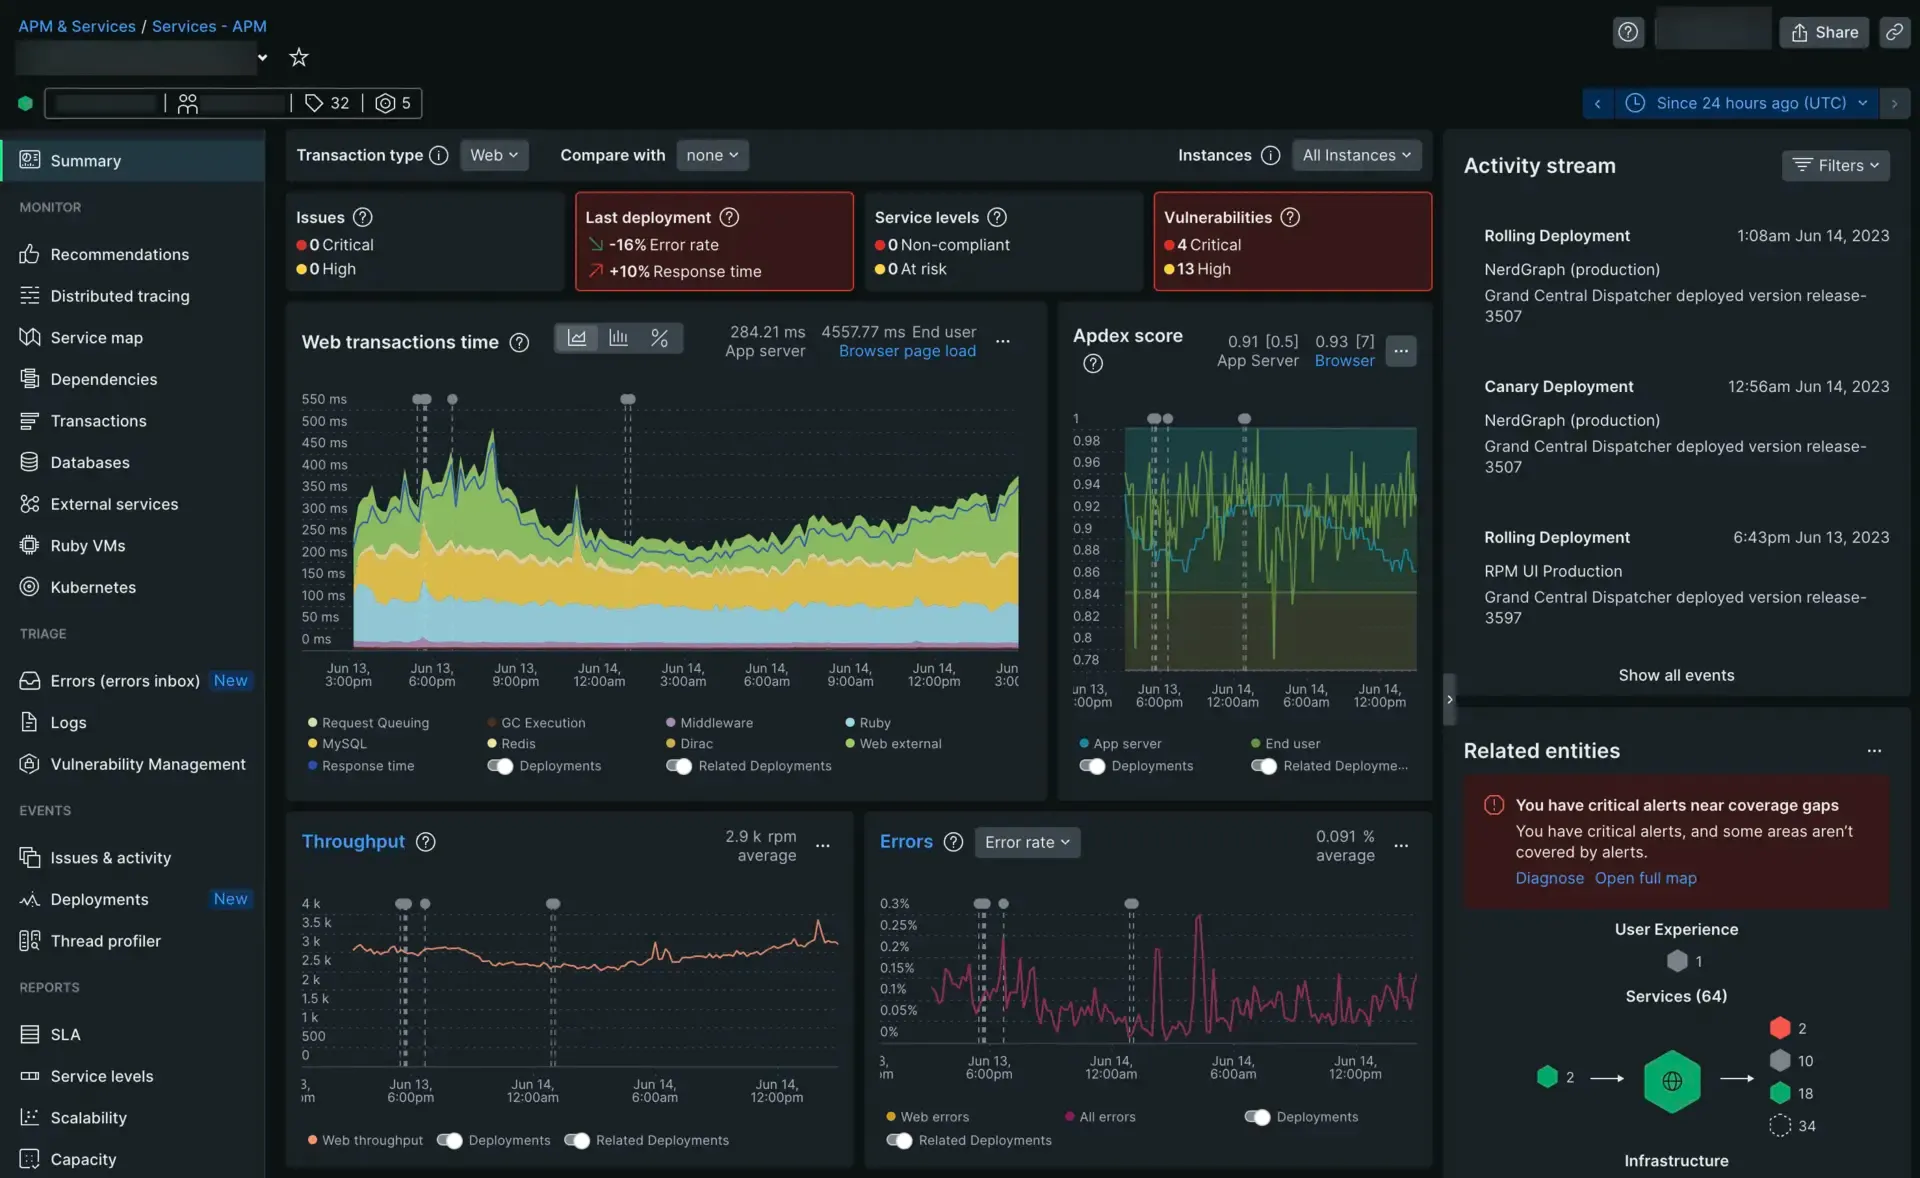
New Relic is a veteran in the APM space that has evolved into a full-stack observability platform. It is particularly strong for developers who need deep code-level visibility to debug application performance issues.
Key features
- Deep APM: Code-level tracing to identify slow database queries or inefficient functions.
- Browser & mobile: Native support for tracking end-user experience (RUM) on web and mobile apps.
- Applied intelligence: AI-driven insights to detect anomalies and correlate events.
Pros
- Unified data platform: All telemetry (metrics, logs, traces) is stored in one place.
- Free tier: Generous free tier (100 GB/month) for small teams.
Cons
- Complexity: The platform is vast, and navigating the UI can be overwhelming for simple needs.
- Pricing model: While the free tier is good, the per-user pricing for full access can get expensive for larger teams.
Best for: Development teams focused on application performance monitoring (APM) and full-stack debugging.
Price Usage-based: Free for 100 GB/month. Paid plans start at $0.30/GB ingested + per-user seat fees ($99/mo for Core, $549/mo for Plus).
6. Icinga
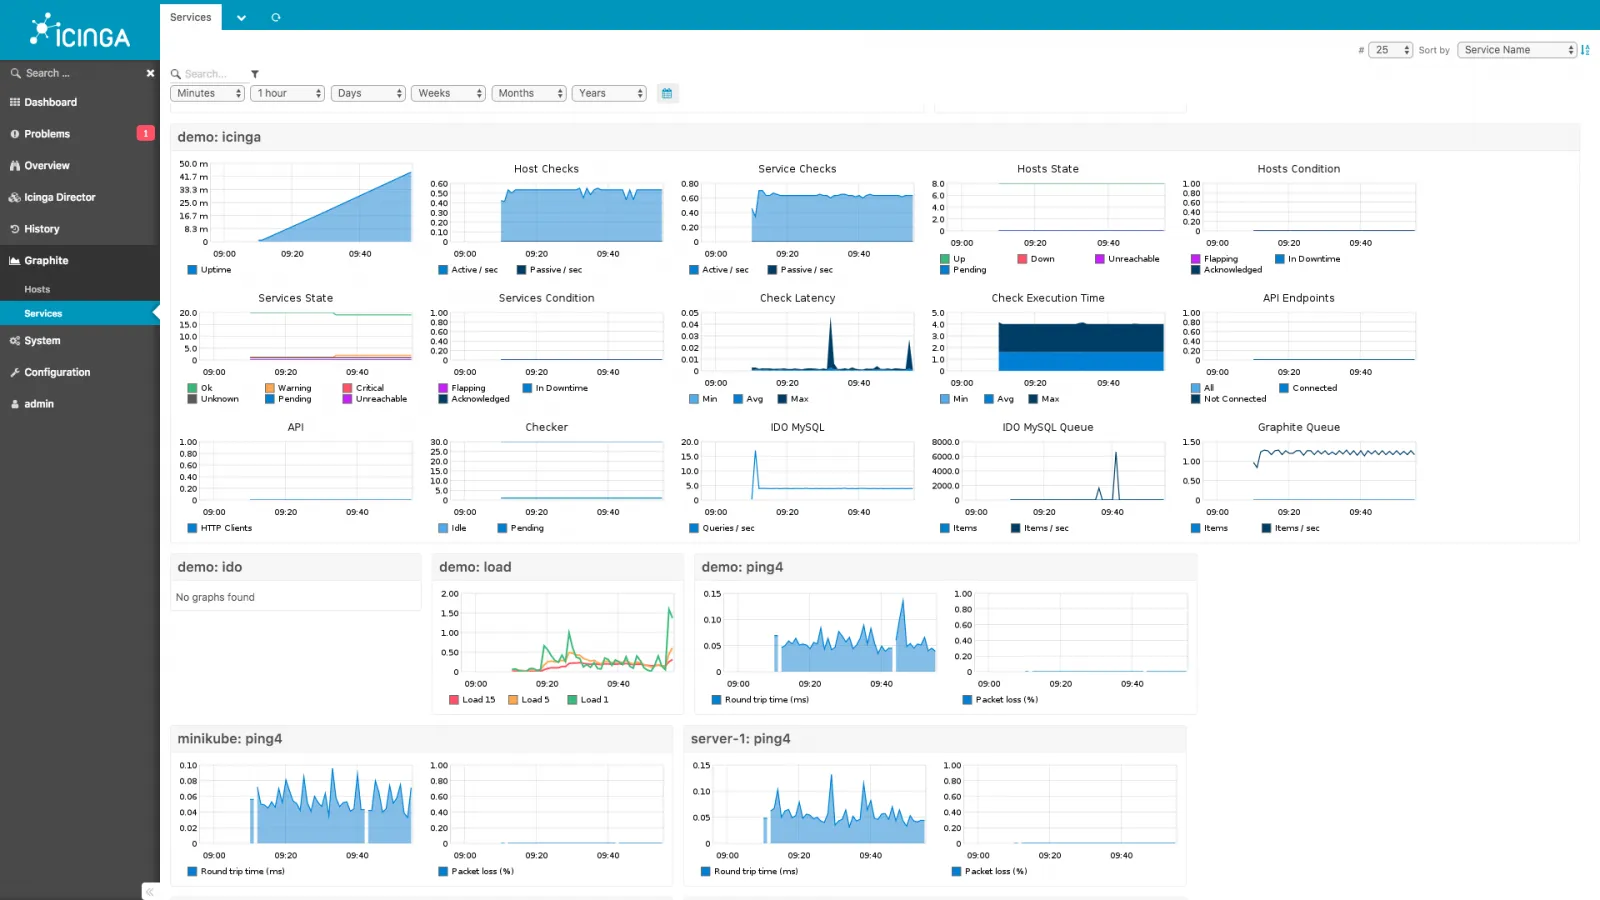
Born as a fork of Nagios, Icinga has modernized the classic monitoring approach. It retains the compatibility with Nagios plugins but adds a modern web interface, a robust configuration API, and scalability features.
Key features
- Icinga Director: A web-based tool to manage configuration, making it easier than editing config files.
- Distributed monitoring: Built-in support for distributed setups and high availability.
- Plugin compatibility: Compatible with thousands of existing Nagios plugins.
Pros
- Modernized classic: Get the reliability of Nagios with a much better UI and API.
- Commercial support: Available for enterprise deployments where “free” isn’t enough.
Cons
- Setup effort: Still requires significant setup and configuration compared to SaaS tools.
- Learning curve: Understanding the configuration language and object model takes time.
Best for: Sysadmins who love the flexibility of Nagios but want a more modern, API-driven, and scalable tool.
Price Free (Open Source). Commercial support is available.
7. Zabbix
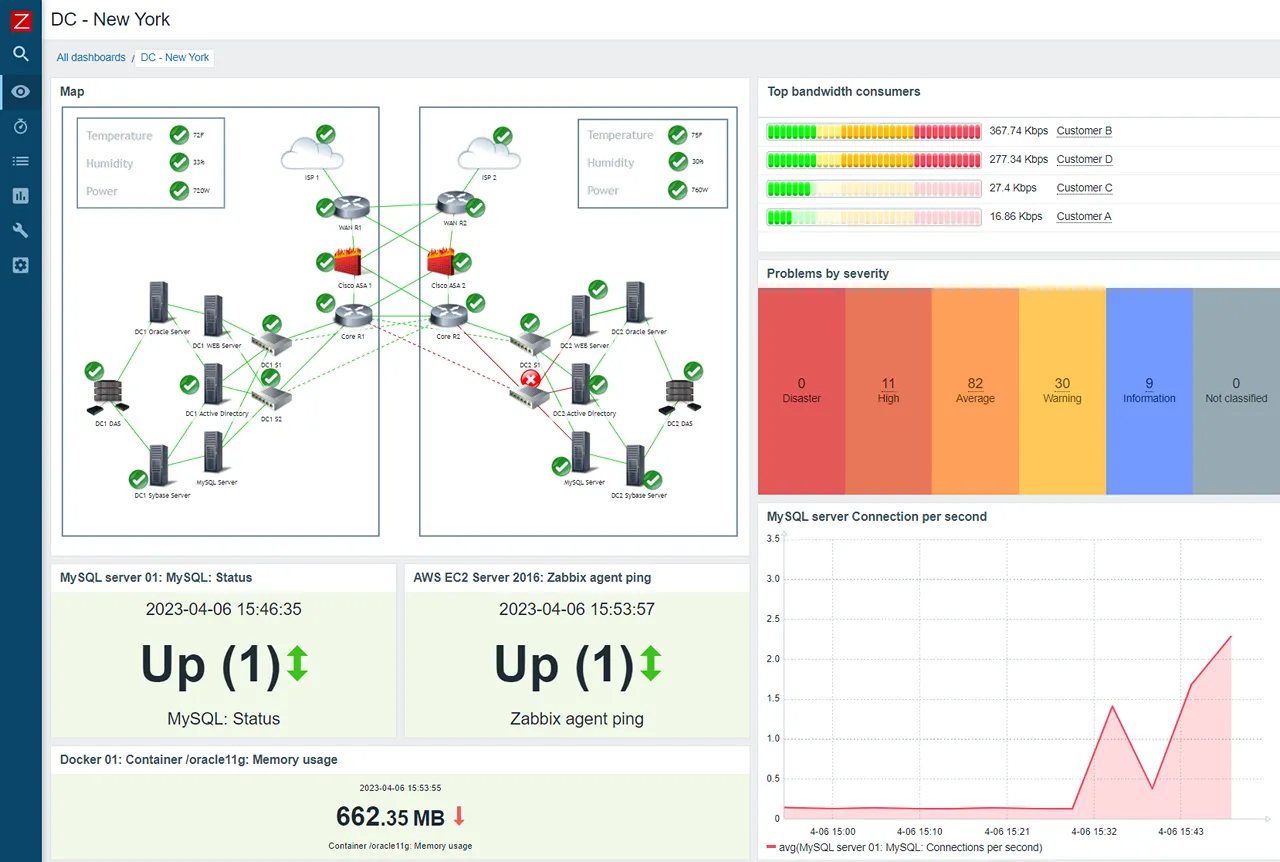
Zabbix is a mature, enterprise-grade open-source platform. It is a traditional monitoring powerhouse, favored by network engineers and large traditional enterprises.
Key features
- Agent & agentless: Can monitor via SNMP, JMX, IPMI, and its own agent.
- Push & pull: Supports both polling and trapping data collection methods.
- Granular permissions: Excellent multi-tenancy and user permission controls.
Pros
- SaaS availability: Zabbix Cloud offers a managed path for teams who don’t want the overhead of self-hosting.
- Proven: Battle-tested in massive environments for decades.
Cons
- Complexity: Configuration can be very verbose (XML/Templates) and time-consuming.
- Modernity: Lacks the seamless cloud-native integrations and fluid feel of modern observability tools.
Best for: Network operations centers (NOCs), MSPs, and organizations with heavy on-prem infrastructure that require dedicated support or a managed monitoring environment.
Price While the software is Open Source, professional use often gravitates toward Zabbix Cloud which starts at $50/mo. Enterprise-grade support and training are also paid services.
8. Nagios
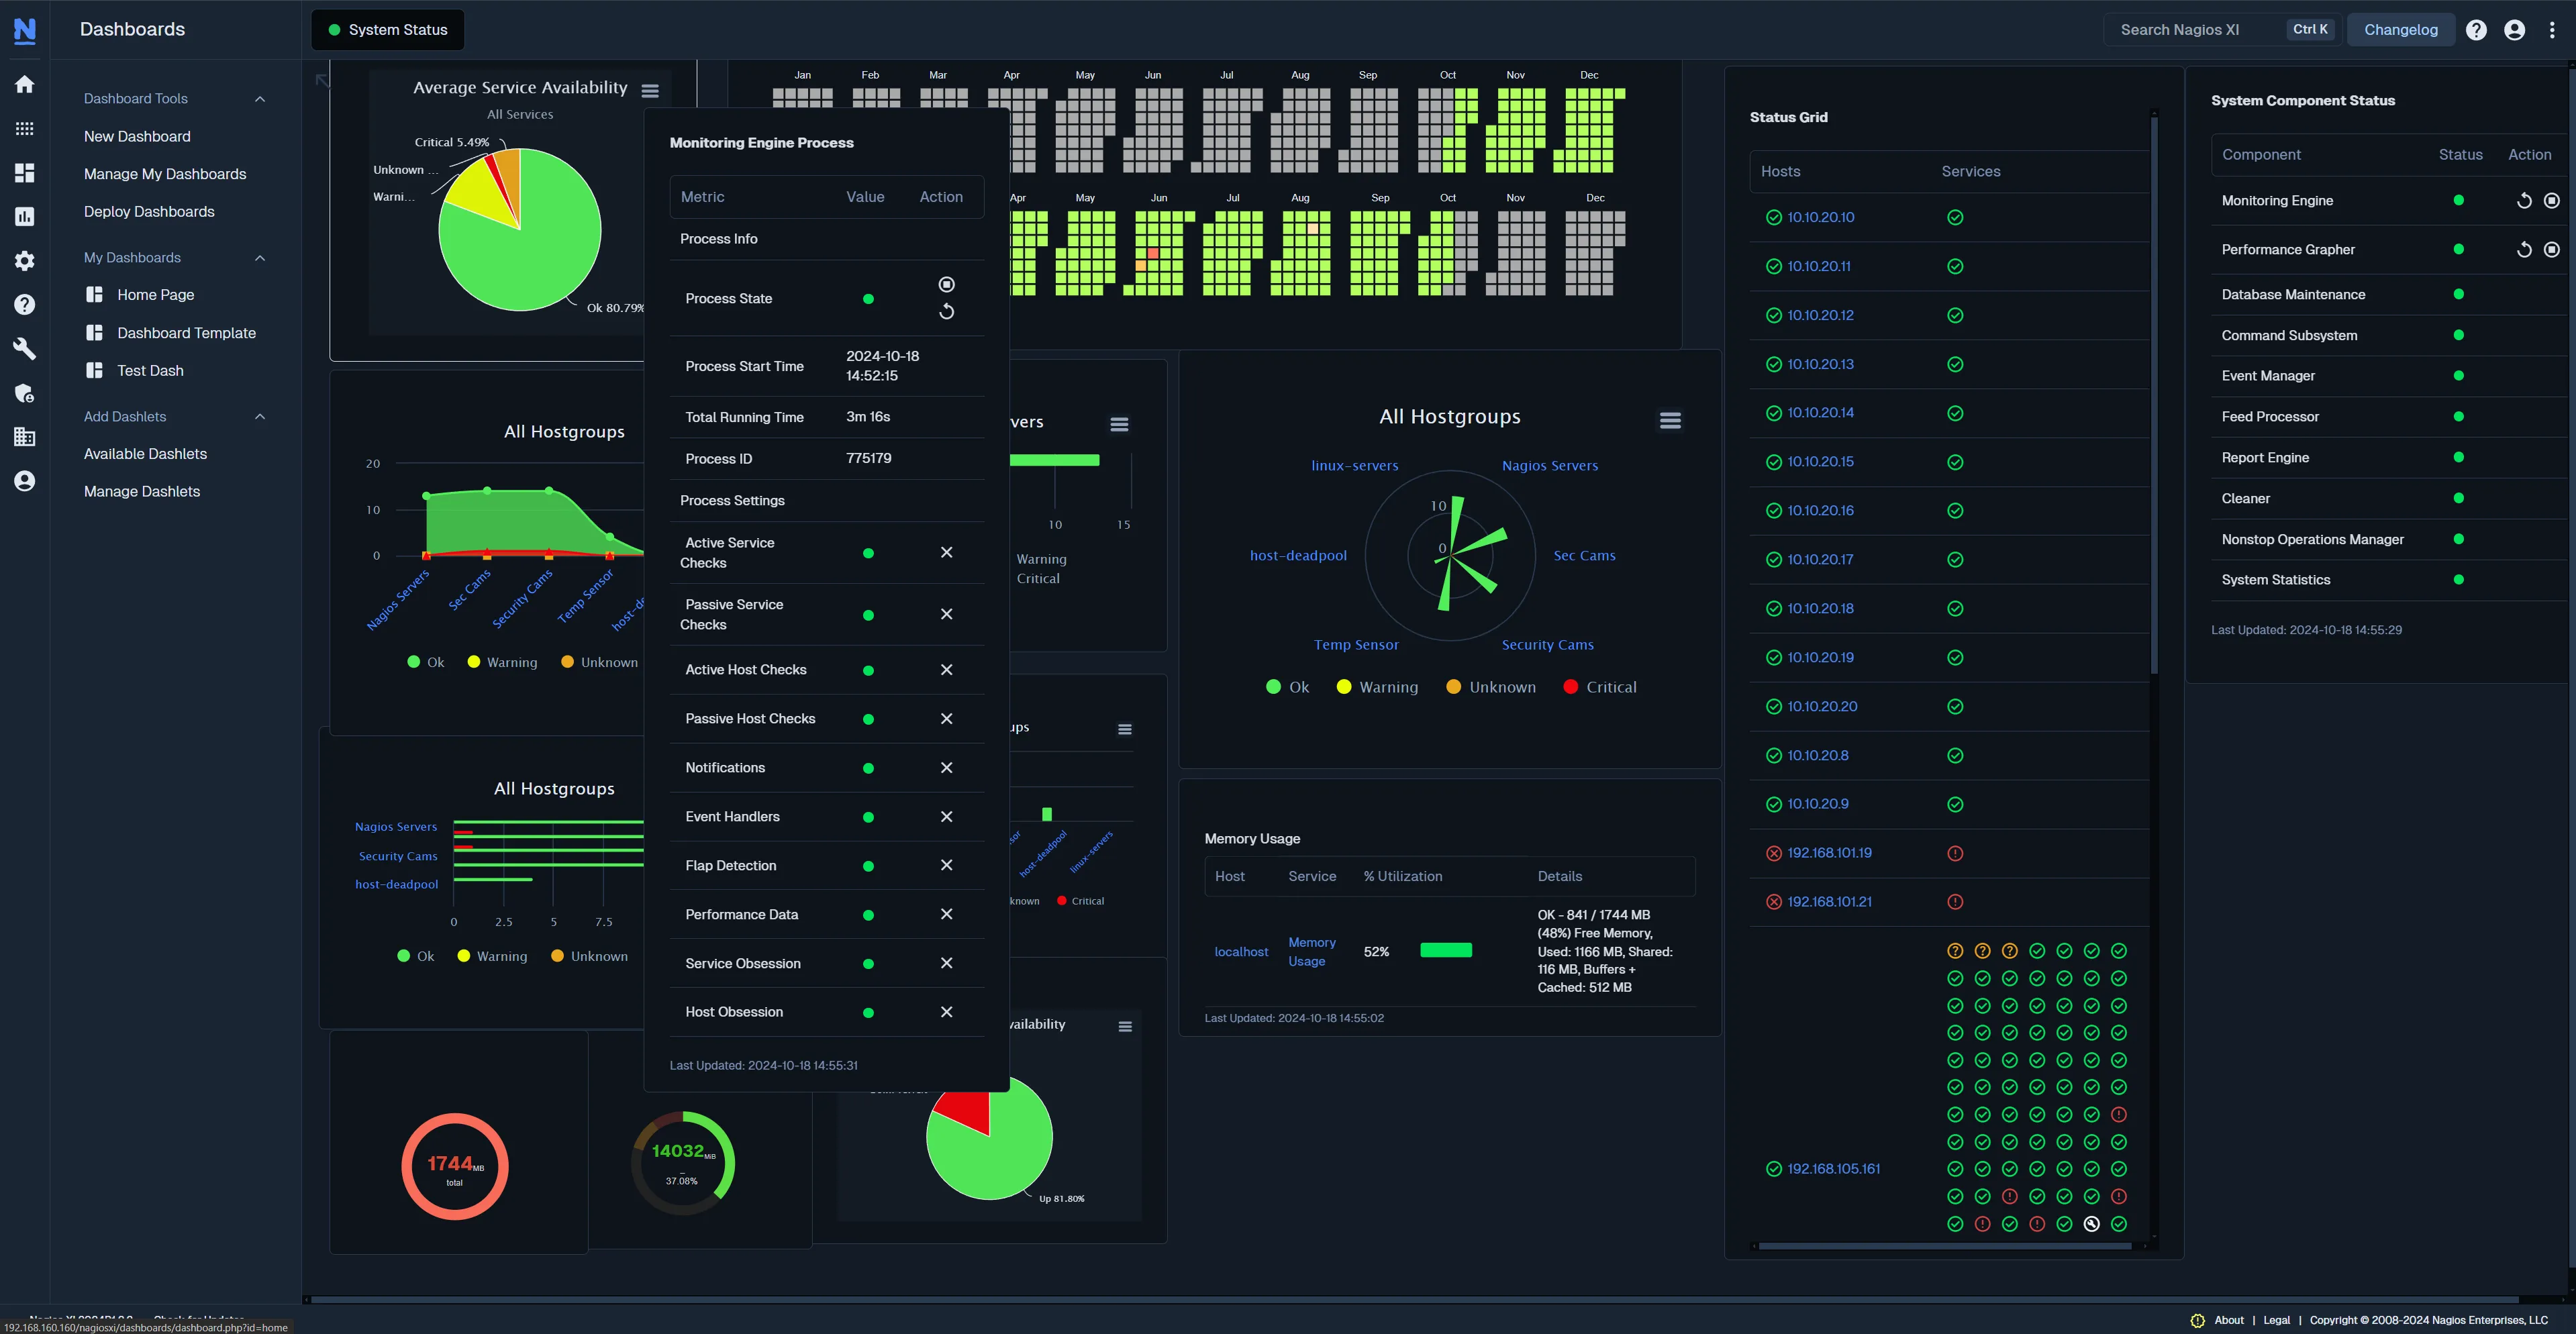
Nagios is the “grandfather” of monitoring. While effectively considered legacy technology by modern standards, it is still widely deployed due to its stability and vast ecosystem of check scripts.
Key features
- Plugin ecosystem: If a device exists, there’s probably a Perl or Bash script to monitor it in Nagios.
- Binary state focus: Excellent at definitive “OK/CRITICAL” alerting.
Pros
- Reliability: Extremely stable and simple in its logic.
- Universal: Almost every sysadmin knows how to read a Nagios alert.
Cons
- Outdated: The configuration is file-based and brittle. The UI is from a different era.
- Metrics: It’s fundamentally a status check tool, not a metrics/graphing tool. You usually need to pair it with something else for charts.
Best for: Legacy environments where “if it ain’t broke, don’t fix it” applies, or for very specific hardware checks that only Nagios plugins support.
Price Nagios Core (Open Source) is Free. Nagios XI (Commercial) starts at $2,495 for a standard license (up to 100 nodes).
Conclusion
Netdata is a fantastic tool for what it does: giving you an incredibly high-resolution look at a single server, effectively for free. But for many teams, the complexity of scaling it and the lack of integrated logs and alerting history make it a stepping stone rather than a final destination.
- For the best balance of simplicity and power: Try Simple Observability. It simplifies the chaos into a clean, actionable dashboard.
- For Kubernetes/cloud-native: Go with Prometheus + Grafana.
- For deep enterprise budgets: Datadog is the luxury choice.
Choose the tool that fits your team’s skills and your organization’s budget.