
- For those who want a quick, easy-to-use solution that combines metrics and logs without a steep learning curve, Simple Observability is the top choice.
- For users who need extreme flexibility and a vast range of features and don't mind a complex setup, Checkmk and Zabbix are excellent.
- Netdata is perfect for real-time monitoring and anomaly detection, while Nagios offers a highly scalable and customizable solution for enterprise-level needs, though its interface can feel outdated.
Server monitoring isn’t a luxury. It matters a lot regardless of the services you’re actually running.
It’s a lightweight safety net that keeps your app online, your data safe and your stress level manageable.
If you’ve ever had to SSH into a server at 2 am to diagnose why a service went down, you know the pressure. Visibility is critical in those moments.
What are the best server monitoring tools available? Here are the 5 best monitoring tools on the market today.
What to monitor?
Before diving into tools, it’s important to understand what you should actually be monitoring. Servers produce a huge amount of data, but focusing on the right metrics will give you early warnings when something is going wrong. Here’s a rundown of the most useful aspects to keep an eye on.
Uptime
The most basic yet critical metric: is your server online? Uptime monitoring ensures you know immediately when a server or service becomes unreachable. Even a few minutes of downtime can result in lost revenue, broken user trust, or cascading failures across your infrastructure.
Pairing uptime checks with alerting ensures you’re notified the second something goes down, not when your users report it.
System core metrics
At the heart of every server are the fundamental resources:
- CPU usage: High or sustained CPU consumption can slow down processes, indicate runaway tasks, or even point to malware.
- Memory usage: Running out of RAM leads to performance bottlenecks and, in extreme cases, system crashes or swapping that drags everything down.
- Disk usage and I/O: A full disk or overloaded I/O pipeline can silently cripple your system. Monitoring both space and throughput helps you prevent downtime.
Think of these as the foundation of your server’s health. If they’re compromised, everything else on top will suffer.
Network metrics
Your server’s network activity is another critical piece of the puzzle. A sudden spike in bandwidth (inbound or outbound) can mean many things:
- A Distributed Denial of Service (DDoS) attack.
- A misconfigured application leaking traffic.
- Data being exfiltrated without your knowledge.
By keeping a close watch on traffic volume, connection counts, and latency, you gain visibility into both performance issues and potential security incidents.
Web server metrics
If your server is hosting applications or websites, web traffic indicators are indispensable:
- Requests per Second (RPS): This shows how much load your server is handling at any given time. Sudden jumps can indicate popularity or abuse.
- Error rate (4xx/5xx responses): A rising error rate often points to broken code, overloaded resources, or external factors like a failing dependency.
Together, these metrics give you a clear picture of what’s happening behind the scenes. They help you move from reactive firefighting (“the site is down!”) to proactive monitoring (“we see errors spiking, let’s fix it before users complain”).
Best server monitoring tools summary
| Pros | Cons | |
|---|---|---|
| Simple Observability | Simplicity and ease of use, one-command installation, unified metrics and logs, transparent pricing, open-source agent | Limited customization for advanced users. |
| Checkmk | Comprehensive with over 2,000 plugins, flexible for agent/agentless monitoring, automated service discovery. | Steep learning curve, complex configuration. |
| Netdata | Real-time, high-resolution data collection, machine-learning-based anomaly detection, instant time-to-value. | Key features like APM and log management are pending, and some users report a lack of detailed documentation. |
| Zabbix | Highly scalable for large environments, multi-tenancy support, advanced problem detection. | Steep learning curve, lacks comprehensive documentation, some users report challenges with log management. |
| Nagios | Extremely flexible and customizable with a vast plugin framework, scalable for large and distributed environments, configuration wizards. | Steep learning curve, outdated interface, high cost for the enterprise version. |
Reviews
Simple Observability
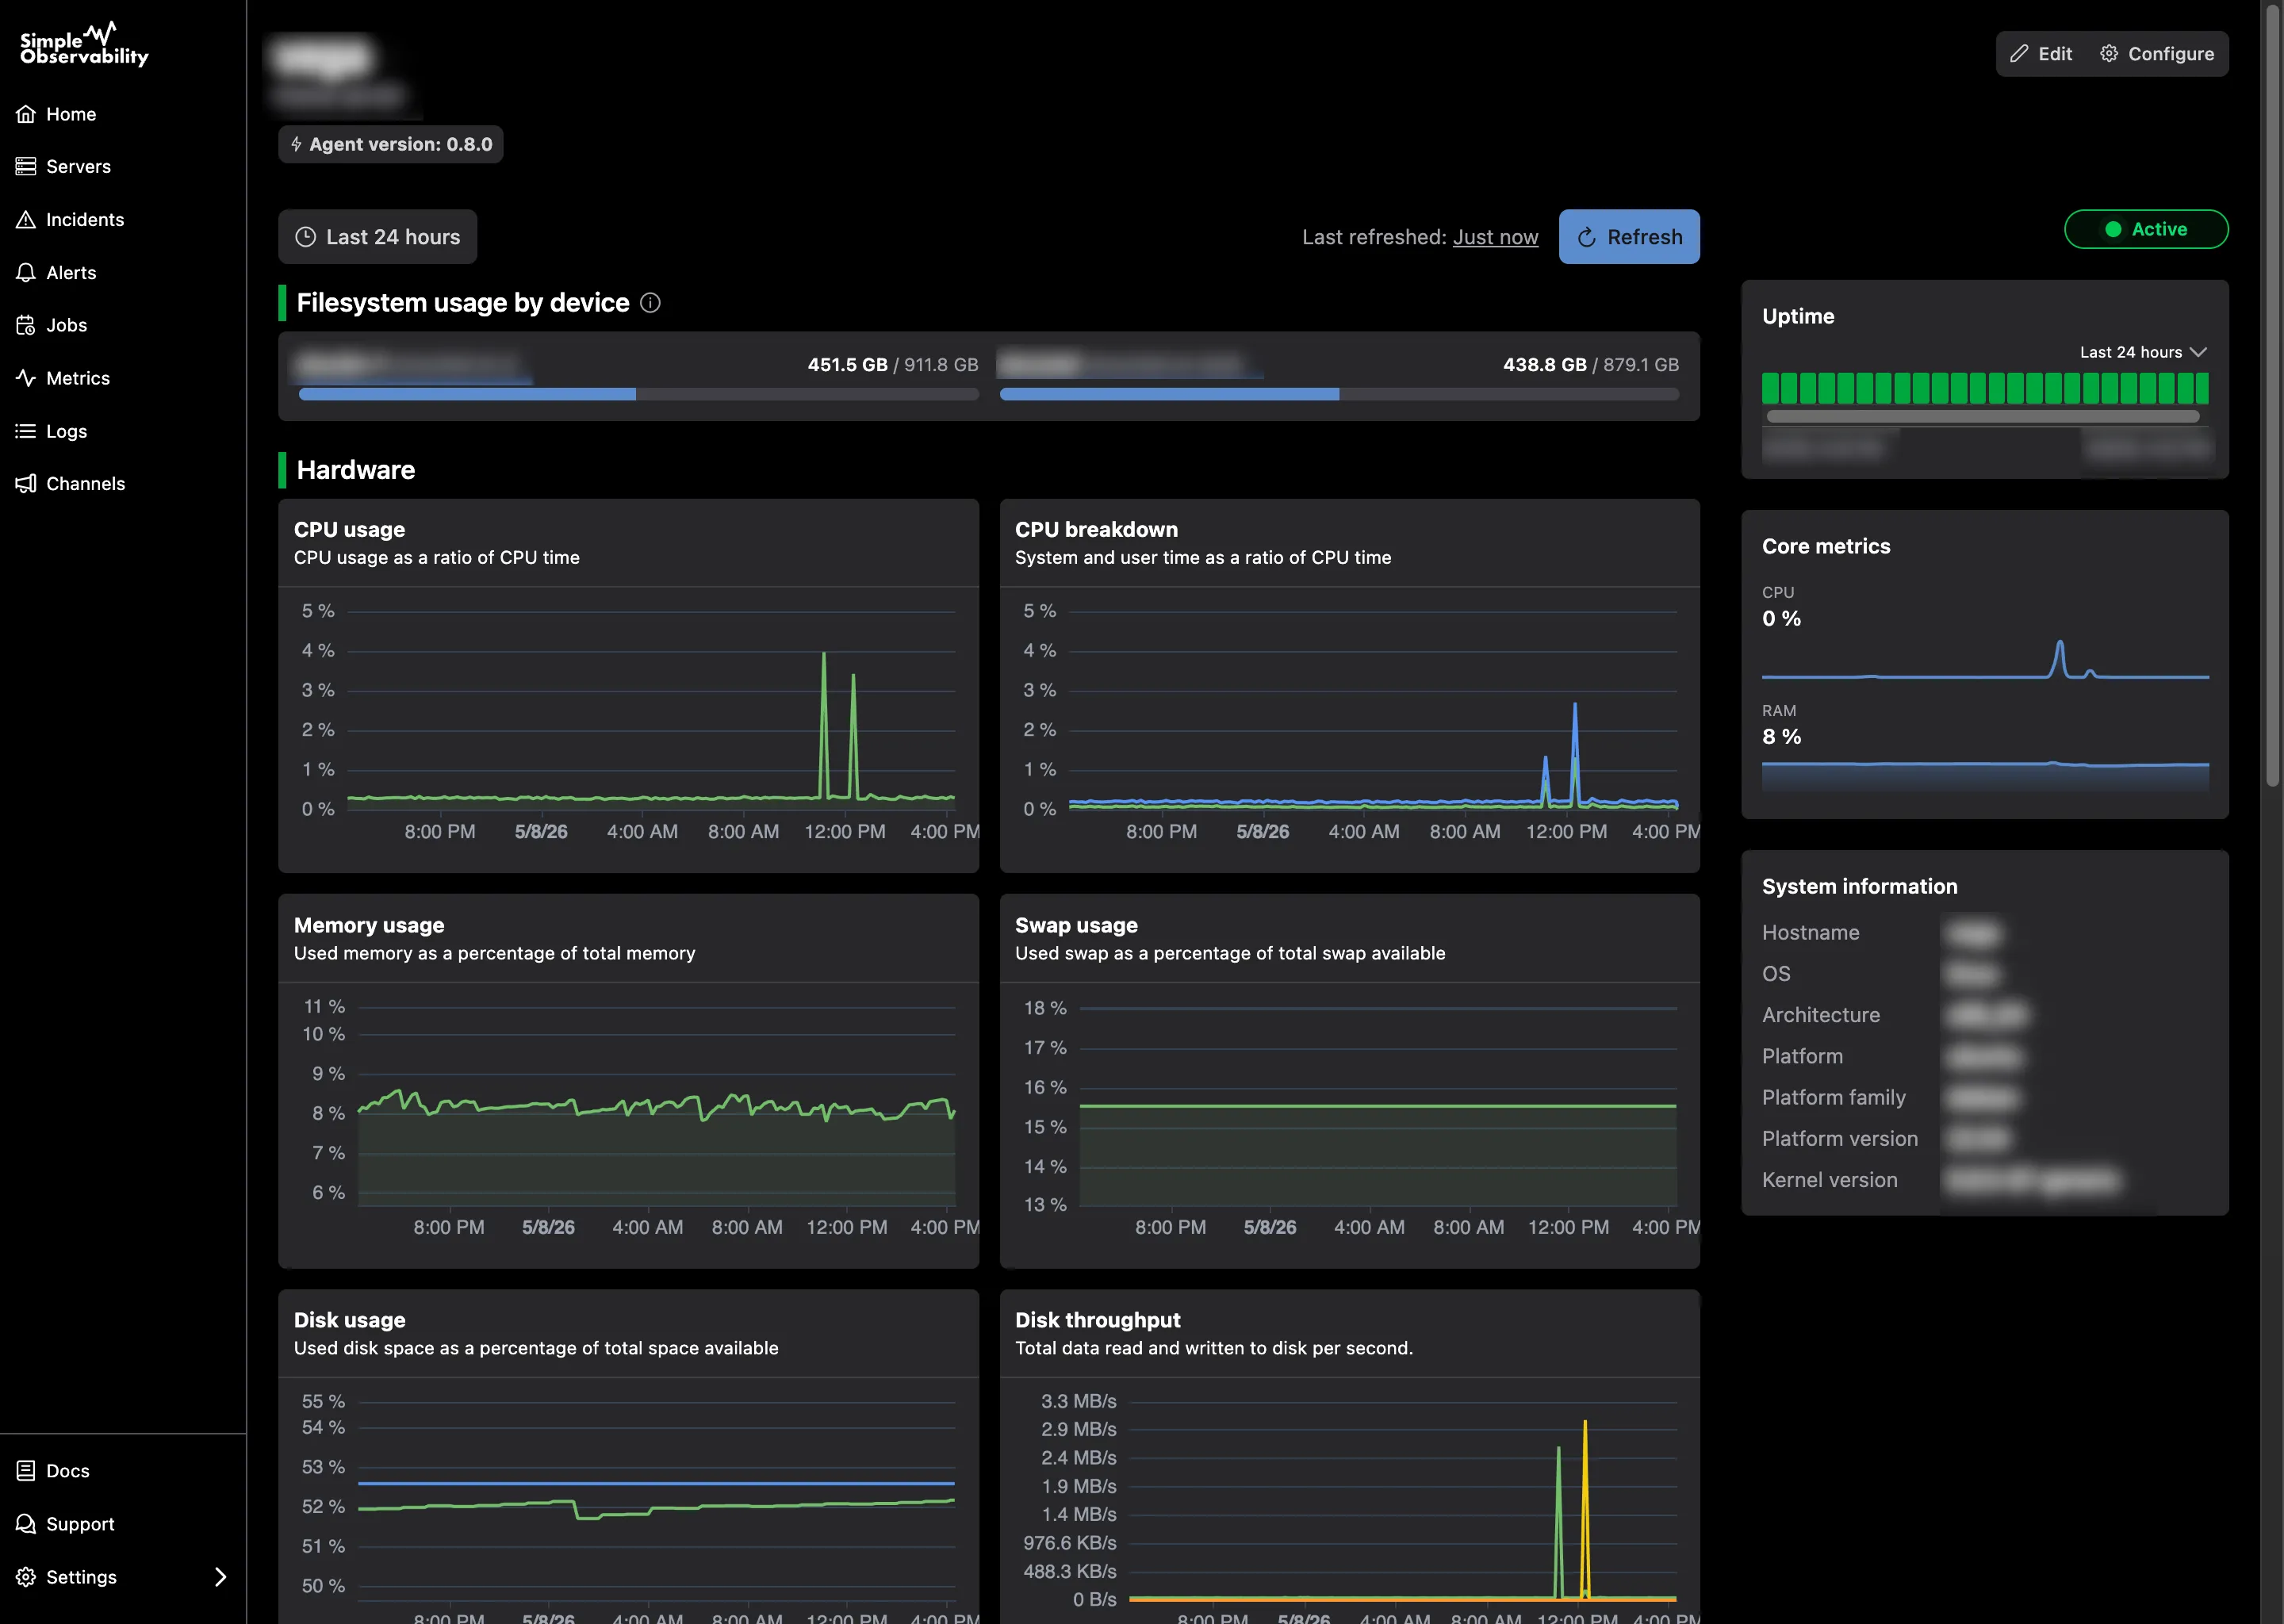
Simple Observability is a server monitoring platform designed to be a straightforward and effective solution for businesses and individuals. It distinguishes itself by providing an “all-in-one” experience, combining metrics and logs in a unified interface to give users a complete picture of their server’s health without the complexity often associated with other monitoring tools.
The platform’s core philosophy is simplicity, from its one-command agent installation to its web-based configuration that eliminates manual file editing.
It offers ready-to-use reports and alerts, allowing users to get immediate insights and define alert conditions in seconds.
Its open-source agent is transparent, auditable, and designed to work on a wide range of Linux distributions.
Key features
- One-command installation: The open-source agent can be installed with a single command, significantly reducing setup time and complexity.
- Unified monitoring: Combines metrics and logs in a single, unified system, providing a holistic view of server performance.
- Web UI configuration: All configurations, from metrics to alerts, are managed through an intuitive web interface, eliminating the need for complex configuration files.
- Mobile-friendly: Offers a Progressive Web App (PWA) to monitor infrastructure and receive alerts from anywhere.
Pros
- Simplicity and ease of use: The platform is designed for quick adoption, even for users with limited monitoring knowledge.
- Transparent pricing: Simple Observability offers a clear, fixed-price model with no usage-based surprises, which can be a significant advantage over competitors.
- Open-source agent: The agent’s open-source nature provides transparency and allows users to audit the code.
Cons
- Limited customization: While the simplicity is a pro, it may also be a con for advanced users who require more granular control and customizability beyond the built-in features.
Price
Simple Observability offers a tiered pricing model with a free plan and two paid options:
- Lite (Free): A free plan for one server, including 50 metrics and low log volume.
- Standard: Priced at $9 per month for 3 servers, with an additional $3 per extra server. This plan includes 100 metrics per server and a high log volume.
- Advanced: Priced at $21 per month for 5 servers, with an additional $4 per extra server. This plan includes 200 metrics per server and a higher log volume.
Checkmk
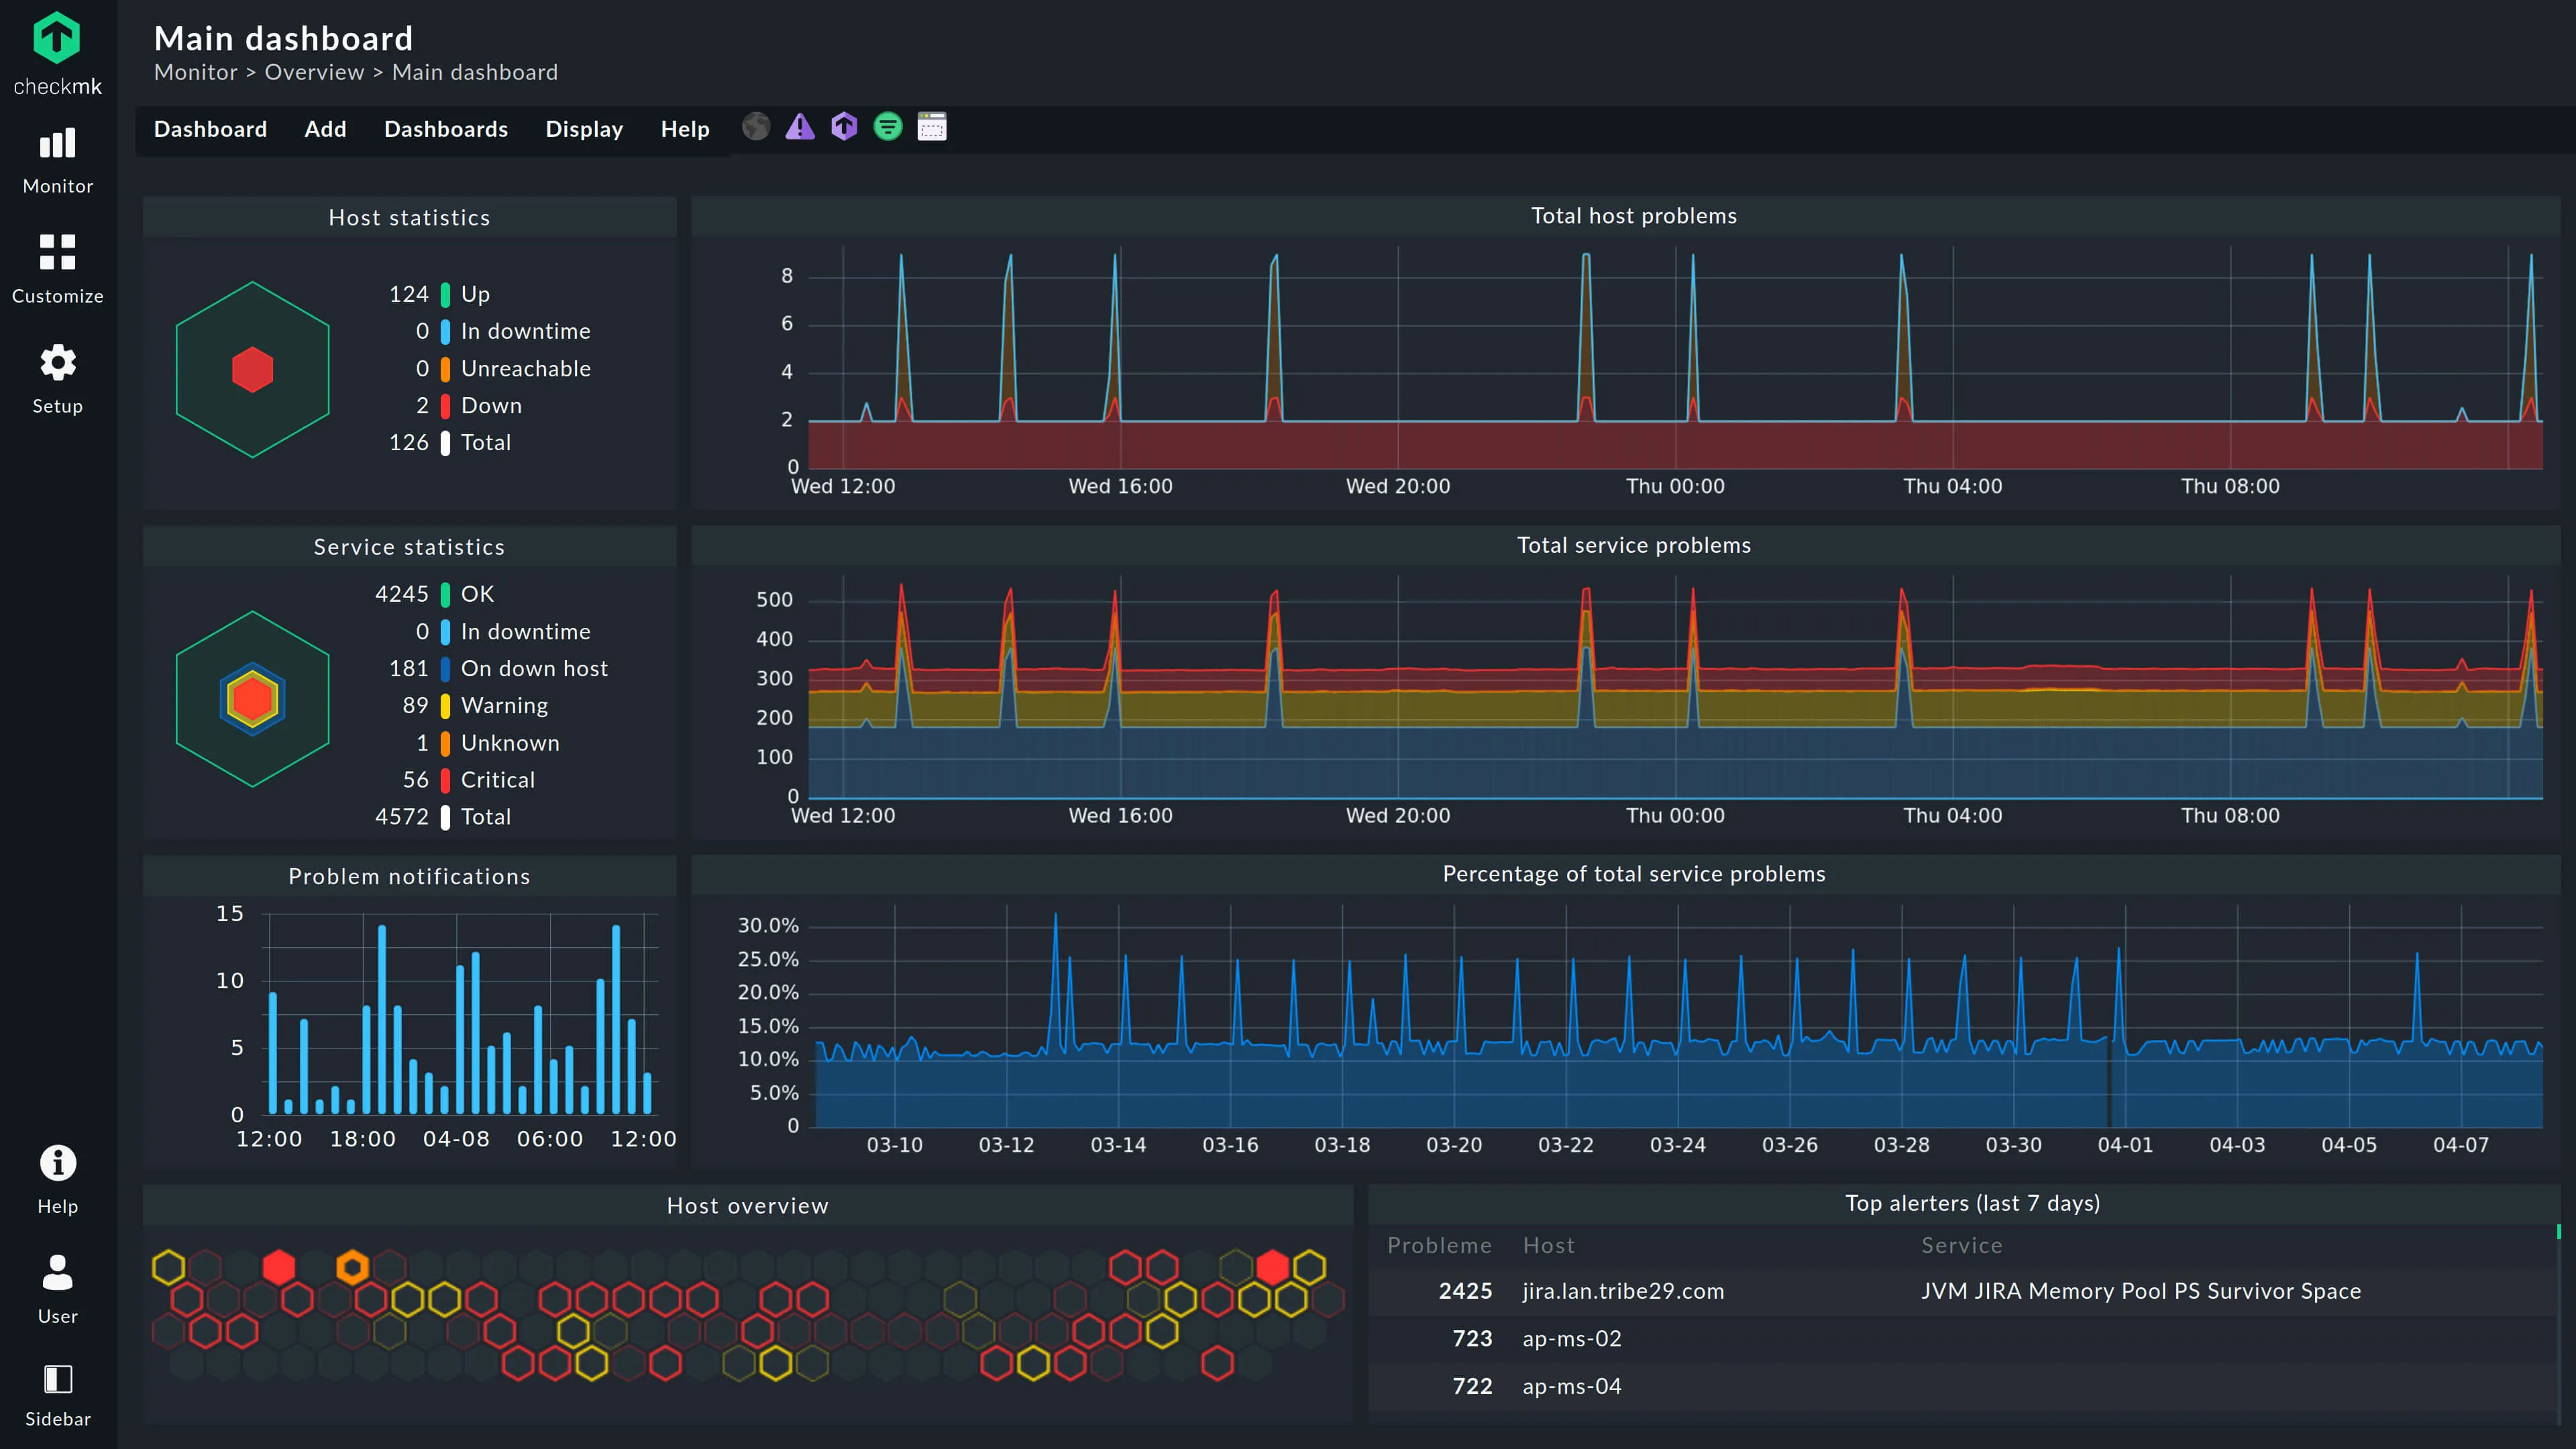
Checkmk is a comprehensive, open-source monitoring platform for applications, servers, and networks, both on-premises and in the cloud. It is designed to effortlessly monitor everything from the simplest to the most complex IT environments.
Checkmk features over 2,000 monitoring plugins for a wide range of devices, including servers, switches, databases, and web servers.
The free community edition is self-hosted with a limited feature set and supports both agent-based and agentless monitoring.
Checkmk can also automatically discover and map your network.
Key features
- Automatic service discovery: Automatically detects all relevant components on a host and recommends suitable metrics and thresholds for monitoring.
- Visualization: Features modern, customizable dashboards, graphic maps.
Pros
- Comprehensive: Monitors a wide range of IT components, from cloud services to on-premises systems, with a vast library of over 2,000 plugins.
- Flexible: Supports agent-based and agentless monitoring, and is highly customizable and extensible.
- Automated: Reduces manual effort with features like auto-discovery, host lifecycle management, and a powerful REST API.
Cons
-
Learning curve & difficult configuration: While powerful, the platform can have a steep learning curve.
Some users find its configuration complex, particularly for advanced features.
Price
Checkmk offers a self-hosted model with paid licenses starting at approximately $225 per month, typically for a minimum of 100 hosts.
There is also a SaaS model available, priced around $6 per host per month. The pricing is based on the number of monitored services, where a host on average has about 30 services.
Each group of 10 services is billed at approximately $2 per month, which can make the cost escalate quickly.
Netdata
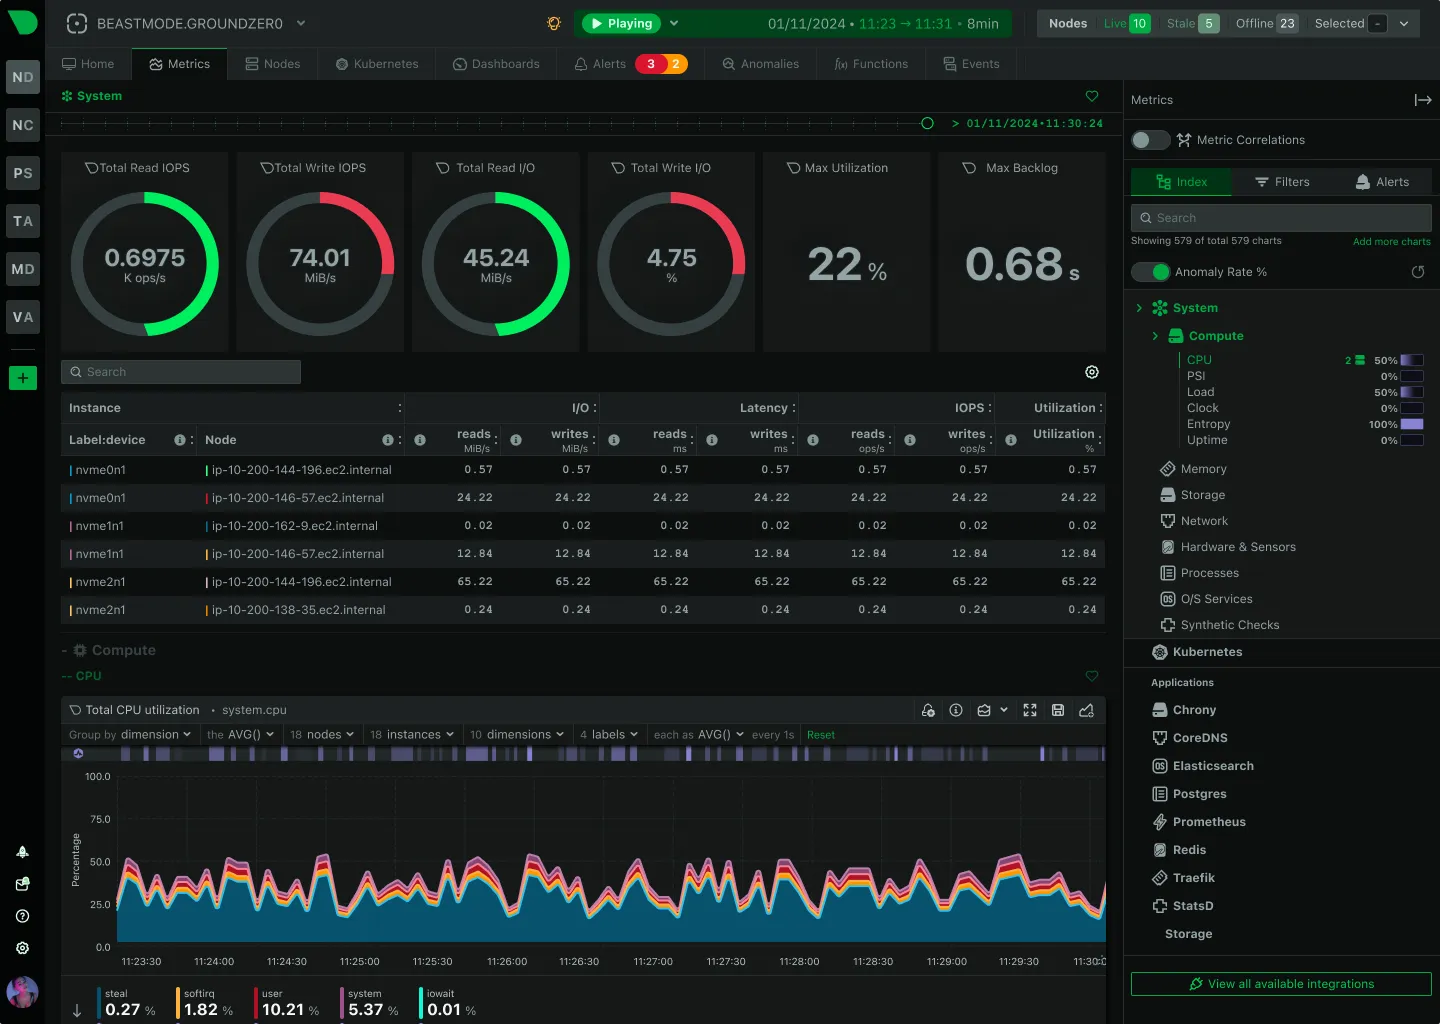
Netdata is an open-source, real-time performance monitoring and troubleshooting platform for systems and applications. It is designed to provide high-resolution, per-second data collection, making it ideal for immediate and proactive issue detection. With its decentralized architecture, Netdata can monitor entire infrastructures, from a single server to large-scale, distributed environments.
Netdata offers an all-in-one integrated observability solution, covering metrics, logs, synthetic checks, and alerts.
It features machine-learning-based anomaly detection and provides clear, actionable insights without requiring extensive data science knowledge.
The platform’s automatic discovery and pre-configured alerts reduce manual setup, enabling a rapid time-to-value for teams.
Key features
- Real-time, high-resolution data collection: Gathers metrics every second, providing instant feedback with low latency.
- Machine-learning-based anomaly detection: Utilizes unsupervised machine learning to automatically learn workload patterns and spot anomalies.
Pros
- Instant time-to-value: Automatic discovery of data sources and pre-configured alerts allow for immediate use upon installation.
- Data privacy: Data is stored on-premise, ensuring it remains on the user’s infrastructure.
Cons
- Missing features: Key features like Application Performance Monitoring (APM) and log management are still pending or not fully implemented, which can limit comprehensive monitoring.
- Data and reporting limitations: Users have reported challenges with insufficient information, particularly concerning detailed reporting and documentation for integrations.
Price
Netdata offers a subscription model at $6 per month and per node.
Zabbix
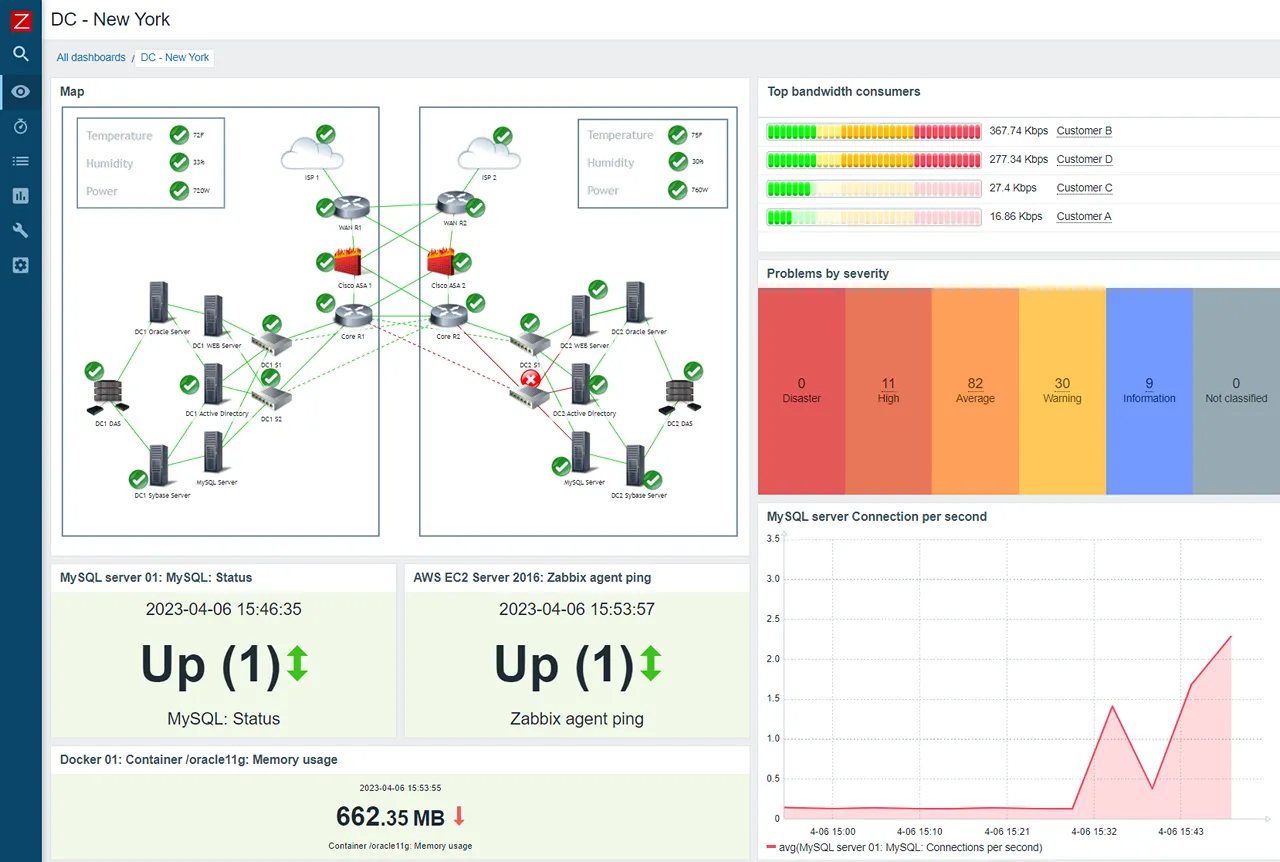
Zabbix is an open-source, enterprise-level software for monitoring various IT components, including networks, servers, virtual machines, and cloud services. Designed to handle large-scale environments.
One of Zabbix’s key strengths is its ability to collect data from virtually any source using a wide range of protocols and custom methods. The platform’s robust alerting system offers multiple channels and escalation schemes, ensuring critical issues are addressed promptly.
Key features
- Advanced problem detection: Utilizes intelligent thresholds, trend prediction, and machine learning to automatically detect anomalies and classify problems with multiple severity levels.
- Flexible alerting: Supports a variety of notification channels, such as email, SMS, and instant messaging, with customizable messages and escalation scenarios.
Pros
- High Scalability: The distributed monitoring architecture, supported by Zabbix proxies, allows for unlimited scalability to monitor thousands of devices across multiple locations.
- Multi-tenancy Support: Provides flexible user profiles and permissions, making it suitable for service providers who need to offer monitoring services to multiple clients in an isolated environment.
Cons
- Steep learning curve: The complexity and extensive features of Zabbix can be challenging for newcomers, requiring a significant time investment to master.
- Limited guidance: Some users have reported challenges with a lack of comprehensive documentation and community support, which can hinder effective use and troubleshooting.
- Lacks support for log management.
Price
Zabbix cloud offering starts at $50/month
Nagios
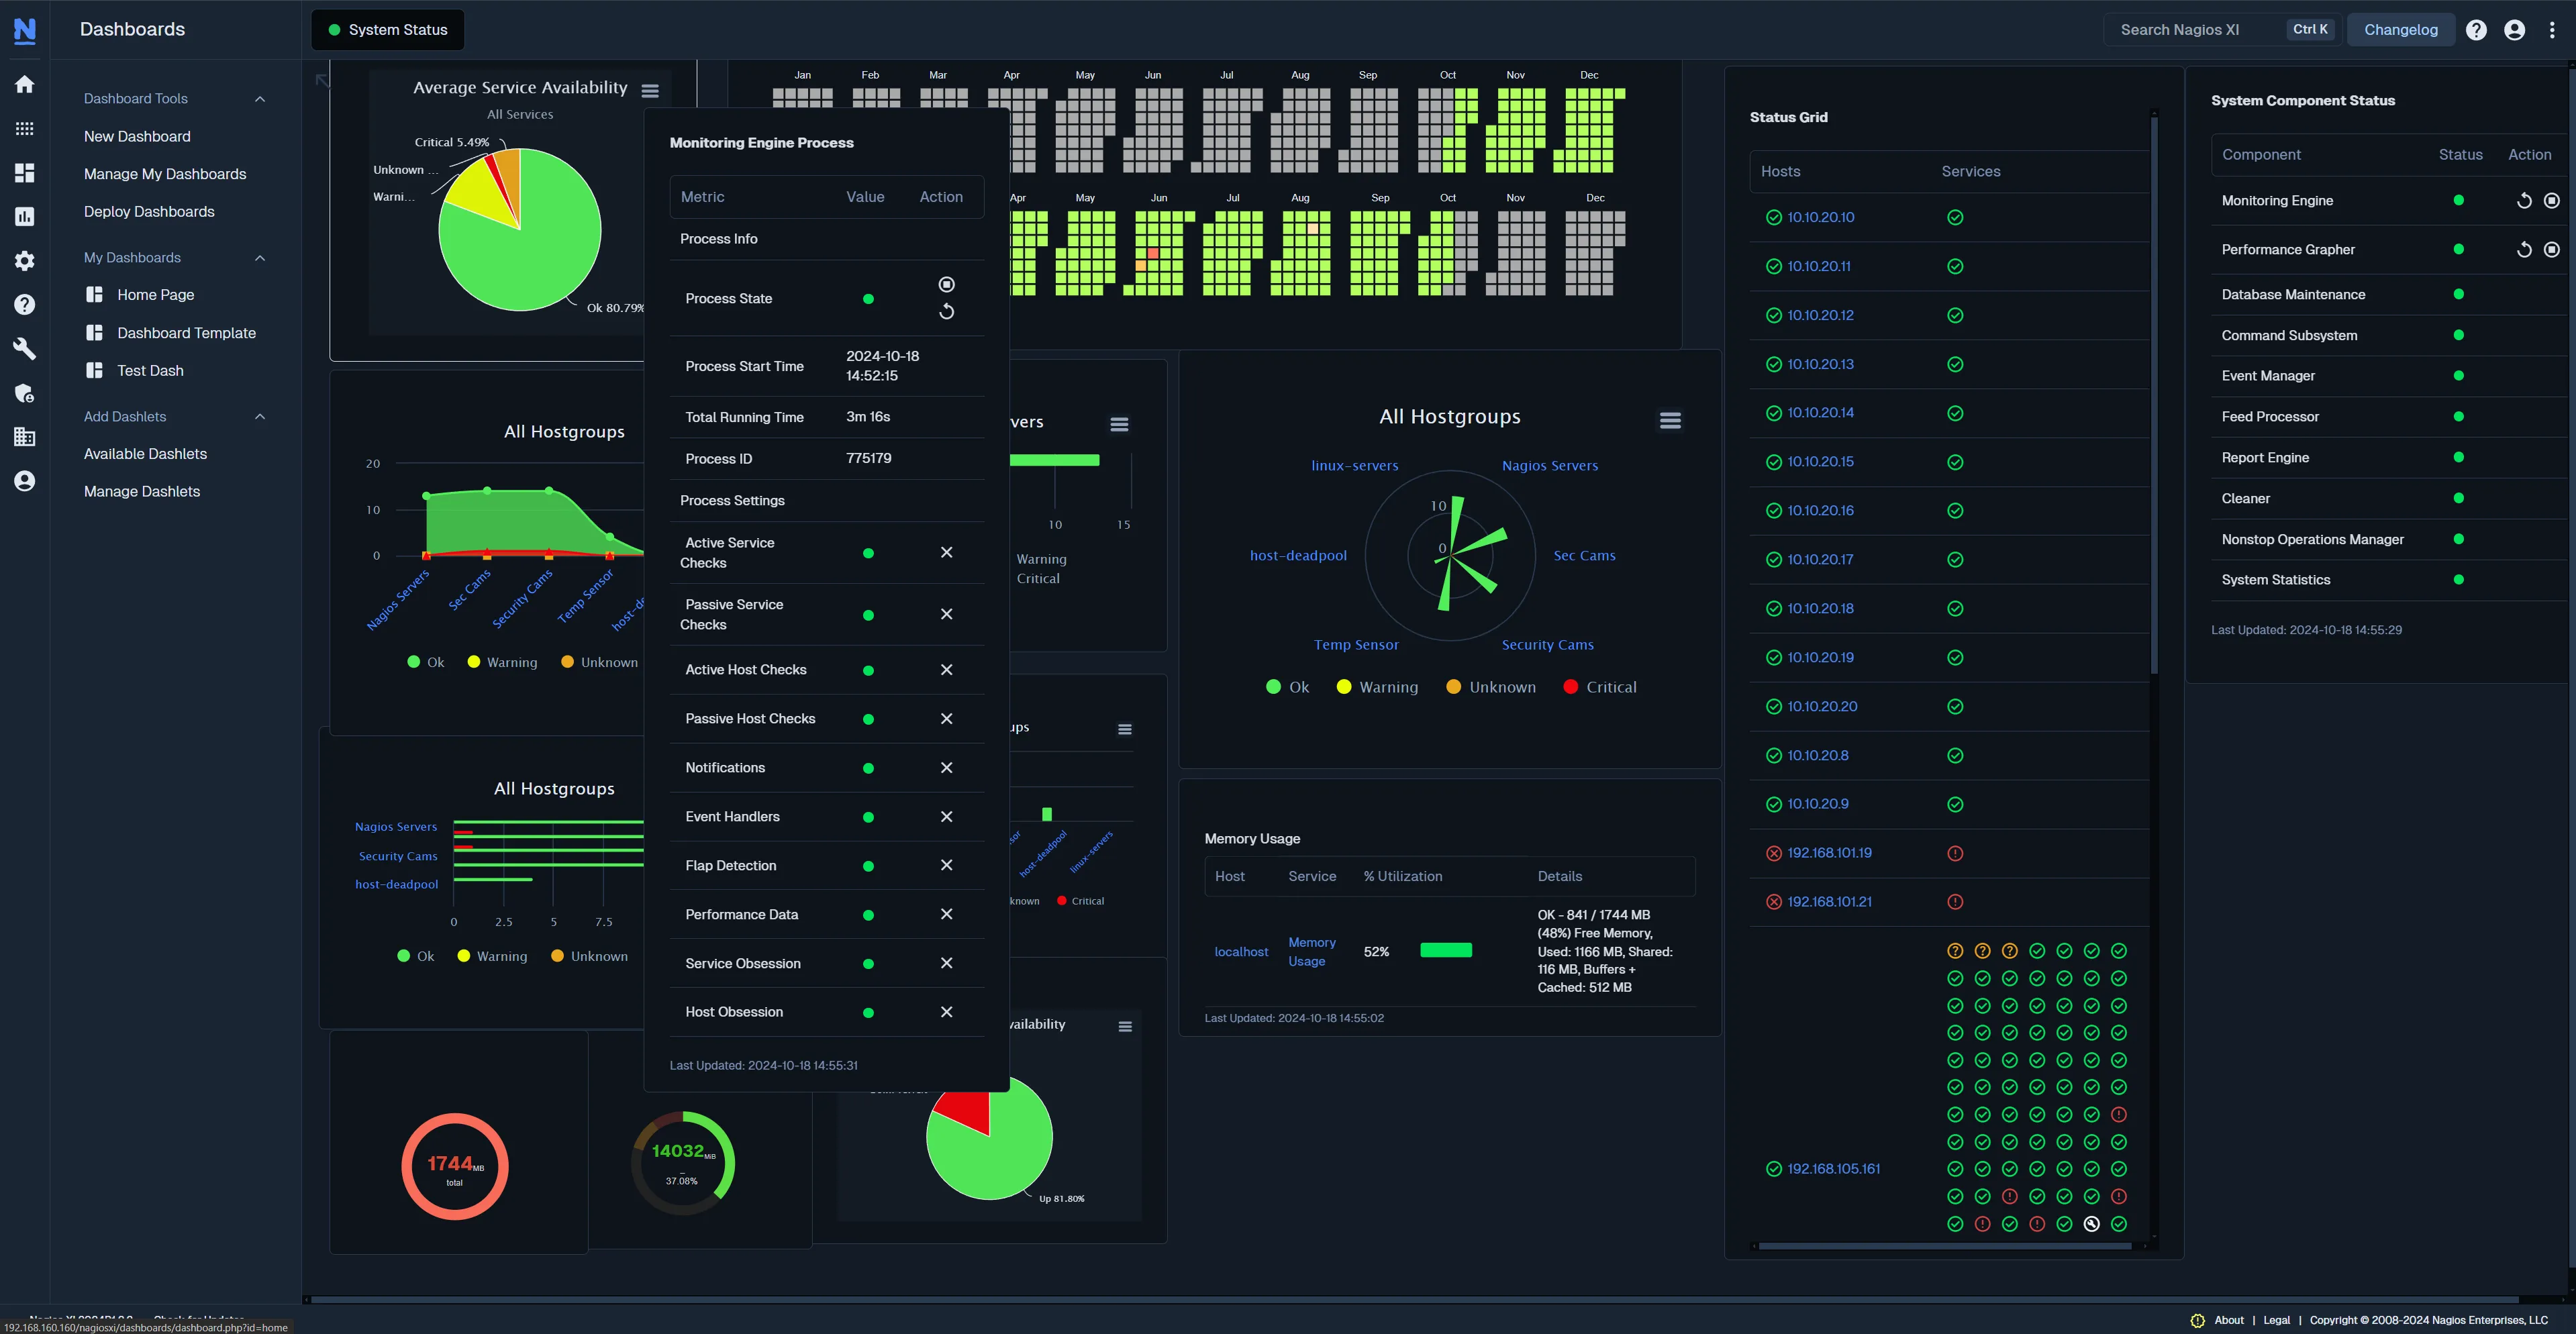
Nagios is a comprehensive, enterprise-level infrastructure monitoring solution that provides extensive monitoring of critical IT components, applications, and systems. Built on the powerful Nagios Core 4 monitoring engine, it is designed to be highly scalable and effective for organizations of all sizes, from small businesses to large enterprises.
The platform offers a centralized view of monitoring data and proactive alerts to preemptively address infrastructure issues. With a customizable GUI, configuration wizards, and multi-tenant capabilities, it is designed to simplify administration and provide a streamlined, intuitive user experience. Nagios XI’s functionality can be extended with thousands of community-developed and third-party add-ons, along with APIs for integration with other applications.
Key features
- Customizable and extensible: Offers a customizable GUI and an open architecture with community add-ons and APIs for integration.
- Configuration wizards: Simplifies the setup process for monitoring new devices and services.
Pros
- Extremely flexible: The platform’s extensive plugin framework and APIs make it highly adaptable to various monitoring needs.
- Scalability: Built on Nagios Core 4, it is designed for efficient, scalable monitoring of large and distributed environments.
Cons
- Steep learning curve: The initial setup and configuration are often considered complex, making it challenging for new users.
- Outdated interface: Some users find the web UI to be cluttered and less modern compared to competitors.
- Pricing: The cost can be considered high, particularly for the enterprise edition and larger deployments.
Price
Pricing starts at $2,495 for a 100-node license.
Conclusion
Choosing the right server monitoring solution depends entirely on your specific needs and technical comfort level.
For those who prioritize simplicity, ease of use, and quick setup, Simple Observability stands out.
Its unified interface, one-command installation, and transparent pricing make it an ideal choice for teams looking to get up and running without a steep learning curve or complex configuration files.
If your environment is large and complex, devices and servers might be spread across multiple locations. Checkmk and Zabbix offer the power and flexibility needed to manage extensive infrastructure. Their steep learning curves are a trade-off for their massive scalability and advanced features.
For those focused on real-time data and a proactive approach to issue detection, Netdata provides a unique and powerful solution. Finally, Nagios remains a reliable, highly customizable choice for large enterprises that need a proven, scalable system.
Ultimately, choosing the right tool is about finding the sweet spot between functionality and usability that aligns with your operational goals and team’s skills.