
360monitoring (formerly Plesk 360) is a server and website monitoring add-on tied to the Plesk ecosystem. It covers basic server metrics and uptime checks from within a familiar panel, which suits small hosting setups that already run Plesk.
The friction is scope and independence. The metrics are basic, the product is tied to a specific ecosystem, and many teams end up duct-taping it together with other tools for logs, cron, and richer metrics. If you want a complete, independent, and actively developed stack, Simple Observability gives you metrics, logs, and alerts out of the box at a fixed per-server price.
This article covers the best alternatives to 360monitoring in 2026. We start with what it does well and where it falls short, then the criteria for evaluating a replacement, and finally a comparison of each option. If you are comparing other tools, see our Datadog alternatives and Zabbix alternatives guides.
Quick summary
| Tool | Best For | Price Model |
|---|---|---|
| Simple Observability | Complete, independent stack | $3 / mo / server |
| Datadog | Full-stack observability | $15+ / host / month |
| New Relic | App Performance (APM) | Usage based ($0.40/GB) |
| Zabbix | Network / On-Prem | €50 / mo (Cloud) |
| Checkmk | Complex IT / Hybrid | ~€7.20 / host / month |
| Netdata | Real-time single-node | Free / ~$4.50/node/mo |
| Prometheus & Grafana | Cloud Native / K8s | Free (OSS) / Managed paid |
| Site24x7 | All-in-one suite | Usage based |
360monitoring Overview
Known for
360monitoring is best known for being a panel-integrated server and website monitor tied to the Plesk ecosystem. For small hosting setups that already run Plesk, having monitoring inside the panel is convenient and low-friction.
Key features
- Server metrics: Basic CPU, memory, disk, and network checks.
- Website monitoring: Uptime checks for hosted sites.
- Panel integration: Lives inside Plesk, no separate install for existing users.
- Notifications: Alerts on thresholds and downtime.
Why look for a 360monitoring alternative?
While 360monitoring is convenient inside Plesk, several limits push teams to look elsewhere.
1. Basic metrics
The server metrics are shallow. For real troubleshooting, you need a tool with deeper infrastructure data, which often means running a second monitoring platform alongside 360monitoring.
2. Ecosystem lock-in
The product is tied to the Plesk ecosystem. If you migrate away from Plesk, or run servers that are not Plesk-managed, 360monitoring stops being a natural fit.
3. Duct-taped stack
Most teams pair 360monitoring with a separate log tool, a separate cron monitor, and a separate uptime service. The result is a monitoring stack held together with duct tape, with several sources of truth.
4. Logs and cron are out of scope
360monitoring does not do centralized log search or cron heartbeat monitoring. Both are common production needs that require another tool.
How to choose an alternative?
When comparing 360monitoring competitors, focus on what you want beyond the basics.
- Independent vs panel-tied: Decide whether you want a standalone platform or a panel-integrated tool.
- Metrics depth: If basic metrics are the pain, look for a real infrastructure platform.
- Logs and cron: If logs or cron monitoring matter, check whether the tool includes them natively.
- Pricing model: Decide whether per-server, per-host, or per-monitor pricing fits your fleet.
8 Best 360monitoring Alternatives
1. Simple Observability
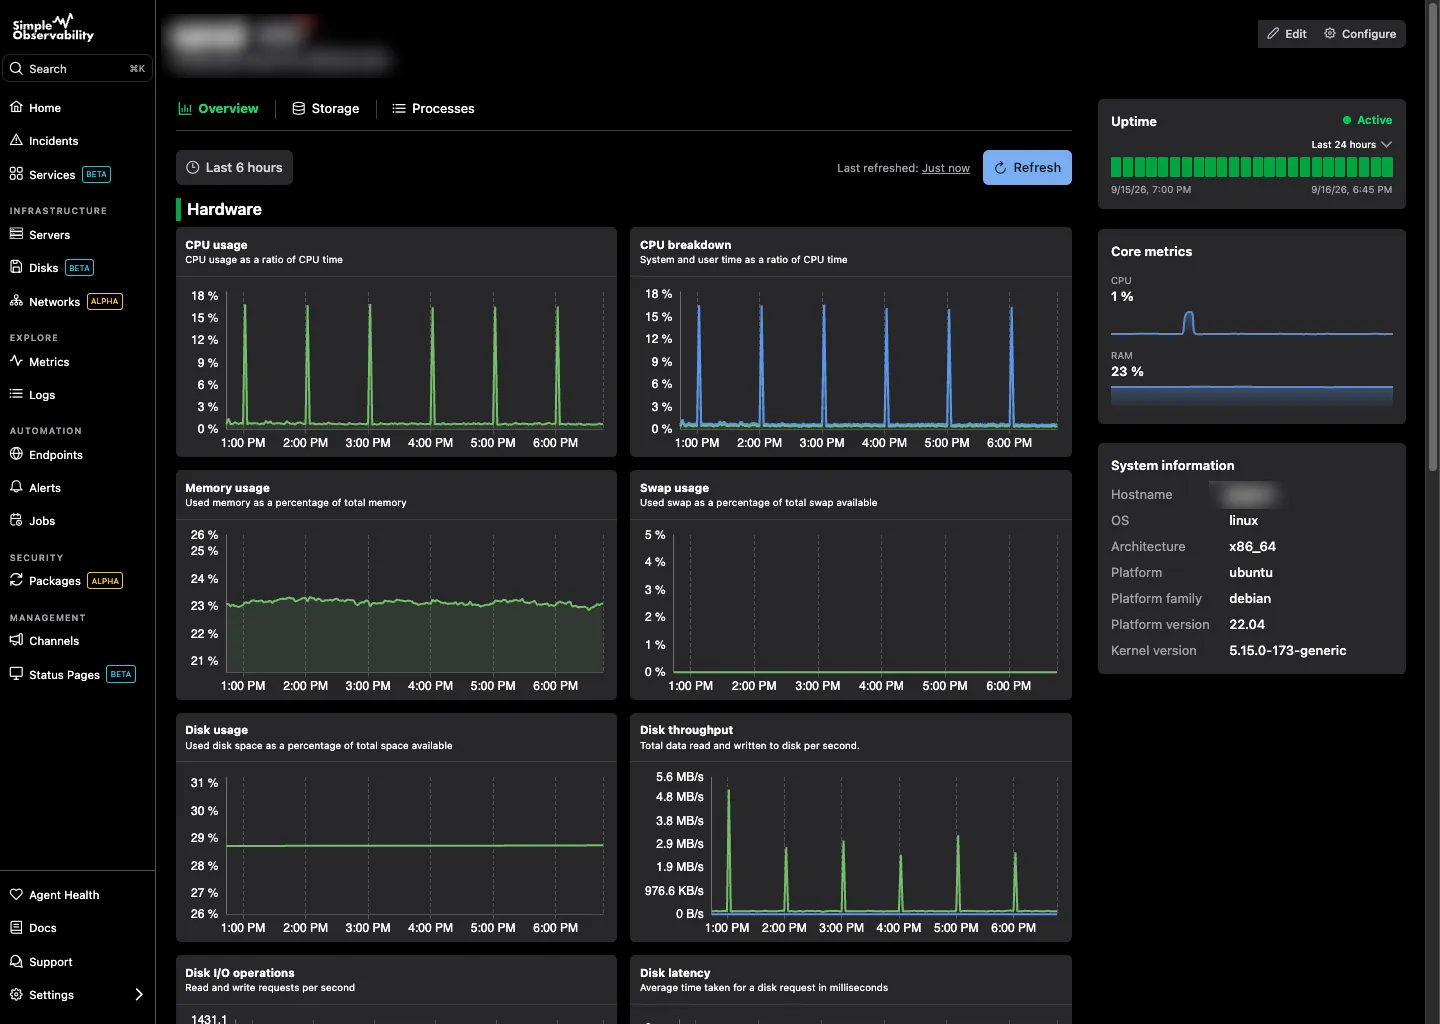
Simple Observability is built for teams that want a complete, independent stack instead of basic metrics duct-taped together with other tools. It bundles metrics, logs, alerts, and cron monitoring in one dashboard, at a fixed per-server price.
Key features
- Unified dashboard: CPU, memory, disk, and network alongside logs and cron.
- Zero-config alerts: Sensible defaults from day one.
- Lightweight agent: An open-source agent installed with one command, no panel required.
- Hosted: The agent pushes data out over HTTPS, no inbound ports.
Simple Observability vs 360monitoring Where 360monitoring gives you basic metrics tied to the Plesk panel, Simple Observability gives you deeper metrics, logs, and cron monitoring in an independent, managed platform. You stop stitching tools together and stop being tied to one ecosystem.
Pros
- Complete stack: Metrics, logs, alerts, and cron in one tool.
- Independent: Not tied to any panel or control system.
- Predictable pricing: Flat fee per server.
Cons
- No panel integration: If you specifically want monitoring inside Plesk, this is not it.
- Not free: 360monitoring may be bundled with Plesk; Simple Observability is free for 1 server then $3/server.
Best for: Teams that want a complete, independent monitoring stack with logs and cron included.
Price
- Free: $0 for 1 server.
- Paid: $3/mo per server for unlimited servers.
- Custom: Volume discounts for large fleets.
2. Datadog
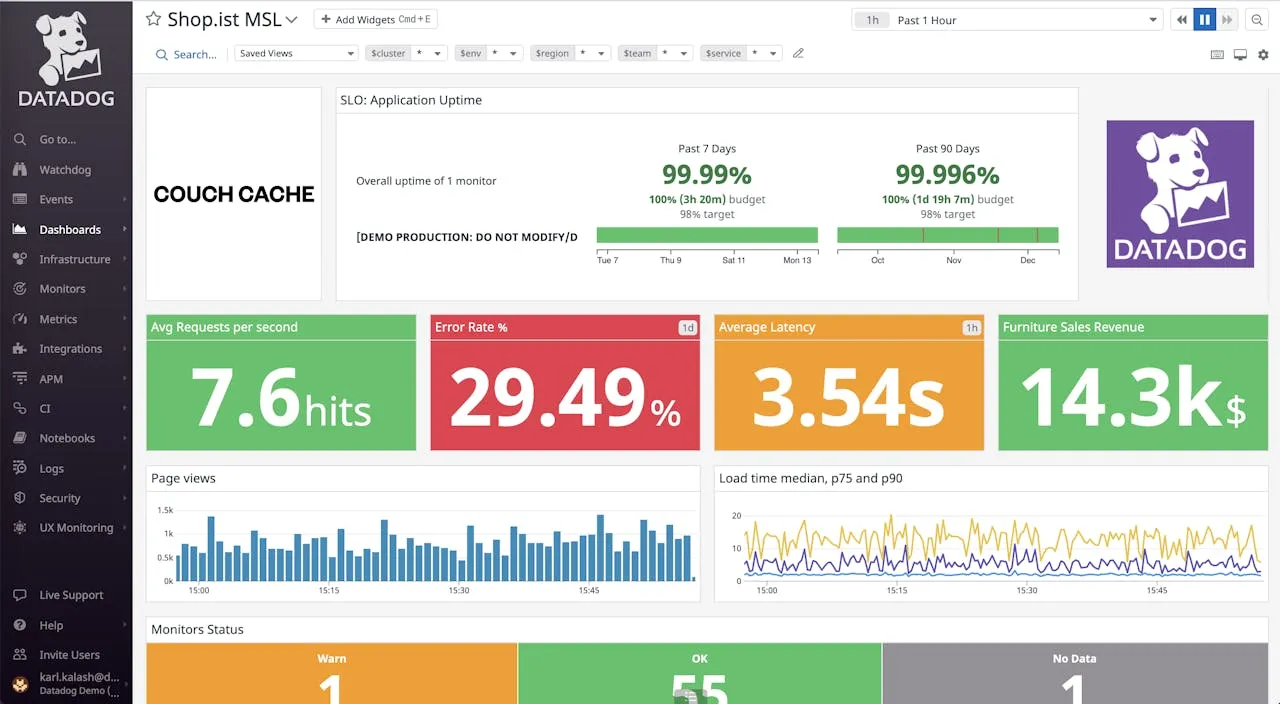
Datadog is the broadest observability platform on this list. It covers infrastructure, APM, logs, and more, a far cry from 360monitoring’s basic metrics.
Key features
- Full-stack observability: Metrics, logs, and traces in one place.
- 400+ integrations: Broad cloud and SaaS coverage.
- Managed: No self-hosted infrastructure.
Pros
- Polished UI: Fast, intuitive, and deep.
- Logs included: Solves the log gap 360monitoring leaves open.
Cons
- Expensive: Per-host plus per-feature billing.
- Overkill: If you only need basic server monitoring, Datadog is a lot of platform.
Best for: Large teams that need full observability, not panel-integrated basics.
Price Infrastructure starts at $15/host/mo. Logs, APM, and custom metrics billed separately.
3. New Relic
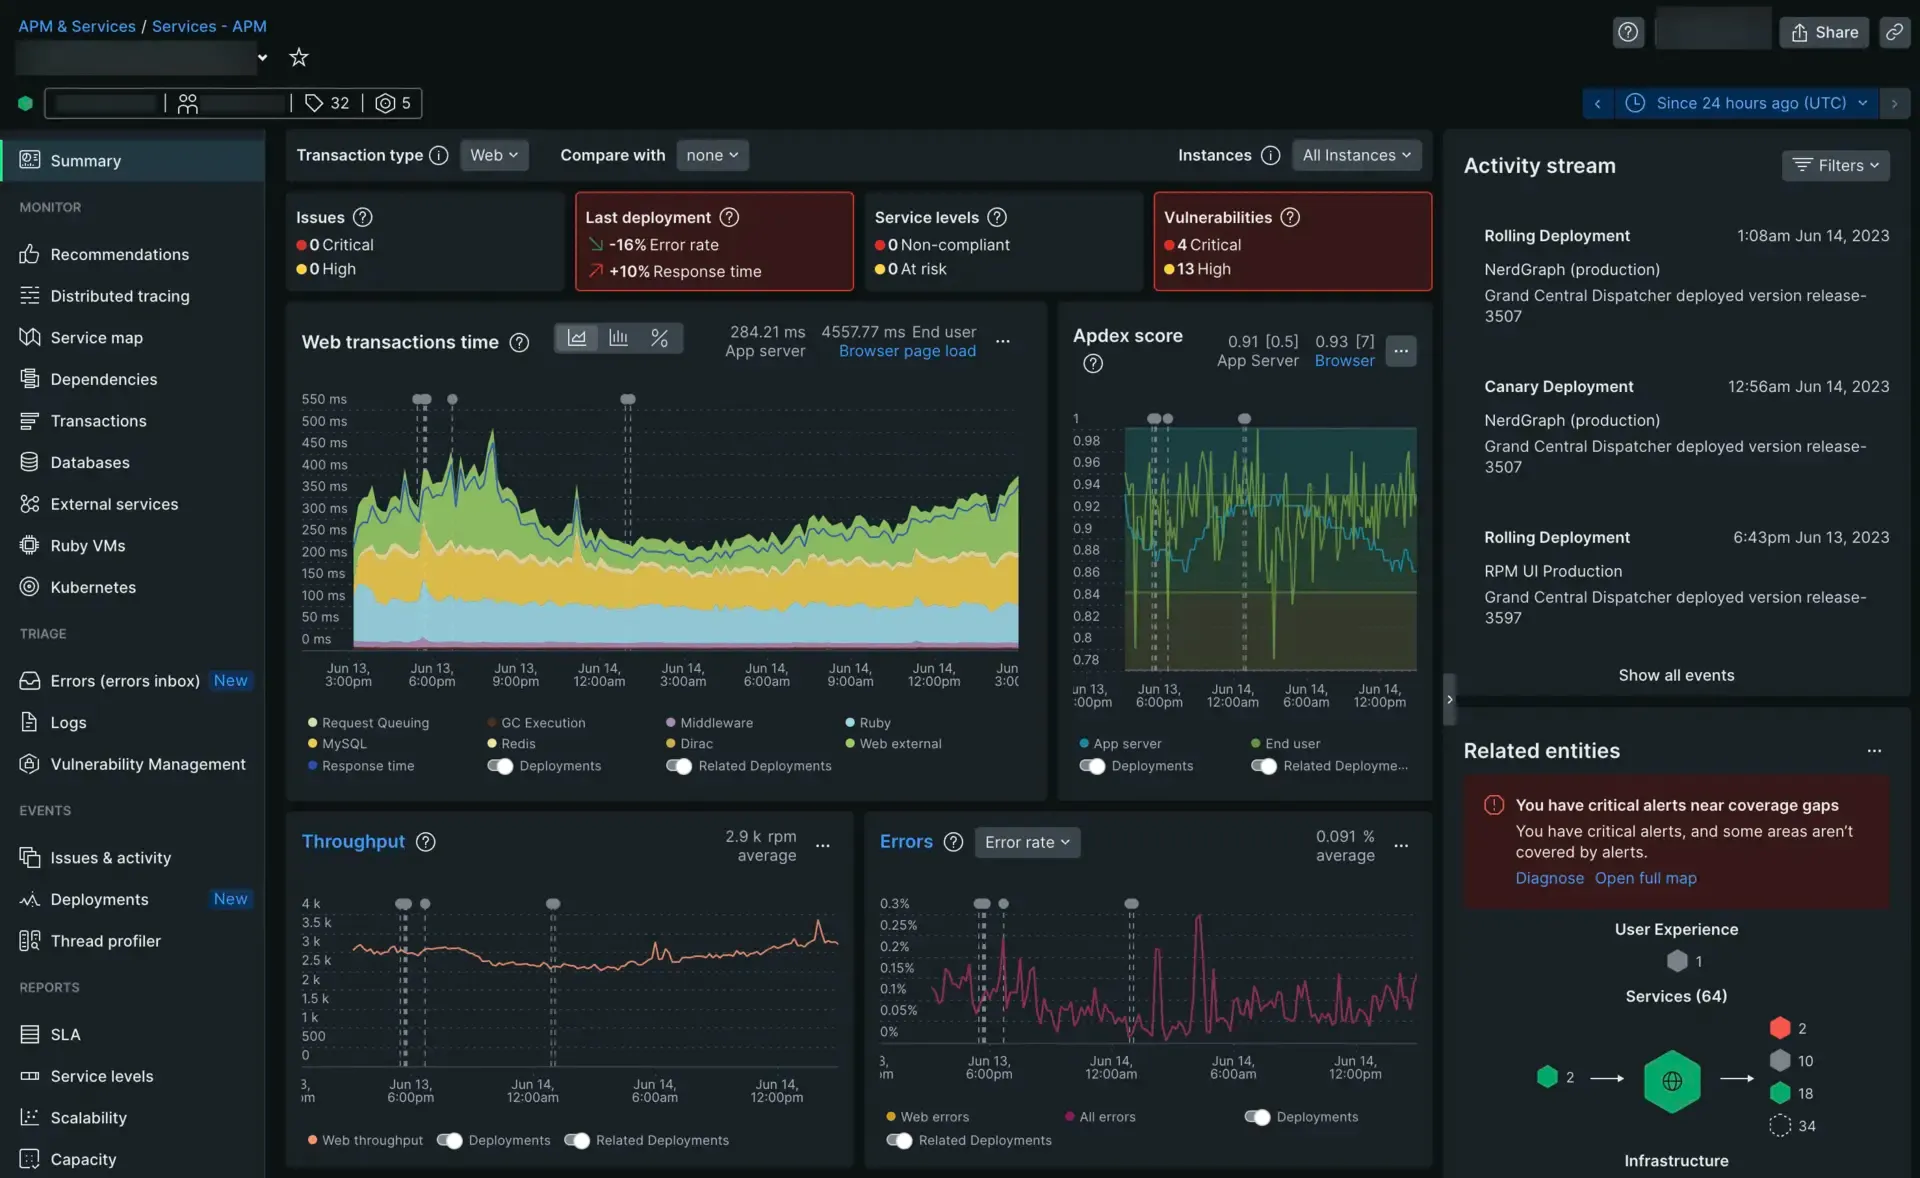
New Relic is an APM-first observability platform that also covers infrastructure, logs, and synthetic checks.
Key features
- Deep APM: Code-level tracing.
- Synthetic checks: Uptime monitoring.
- Generous free tier: 100 GB/month of ingest.
Pros
- Unified platform: Metrics, logs, and traces in one place.
- Free tier: Enough for small teams.
- Independent: Not tied to any panel.
Cons
- Per-user pricing: Full access requires paid seats.
- Usage-based surprises: Ingest spikes move the bill.
Best for: Development teams that need APM and want a managed, free-tier option.
Price Free for 100 GB/month. Paid plans start at $0.40/GB ingested plus per-user seat fees.
4. Zabbix
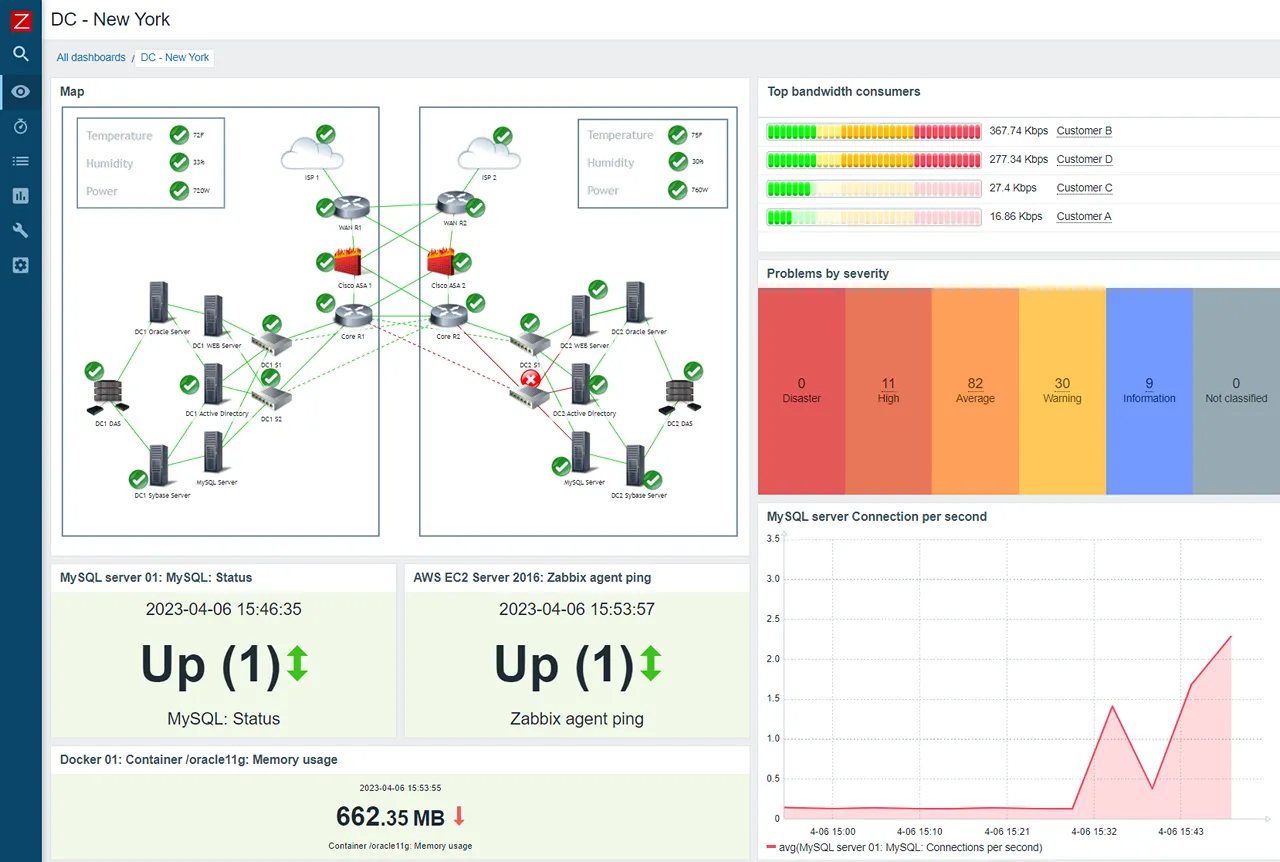
Zabbix is a mature, enterprise-grade open-source platform focused on infrastructure and network monitoring. It is a heavyweight, on-prem alternative to 360monitoring’s basic metrics.
Key features
- Agent and agentless: SNMP, JMX, IPMI, or its own agent.
- Push and pull: Polling and trapping.
- Granular permissions: Strong multi-tenancy.
Pros
- Proven: Battle-tested for decades.
- Open source: No feature-gated tiers.
- Deep infrastructure: Far richer than 360monitoring’s basic metrics.
Cons
- Complexity: Verbose XML configuration.
- Self-hosted: You run the server and database.
- No logs: Metrics and state, not log management.
Best for: NOCs and on-prem-heavy organizations that want depth without licensing.
Price Free to self-host. Zabbix Cloud starts at €50/month.
5. Checkmk
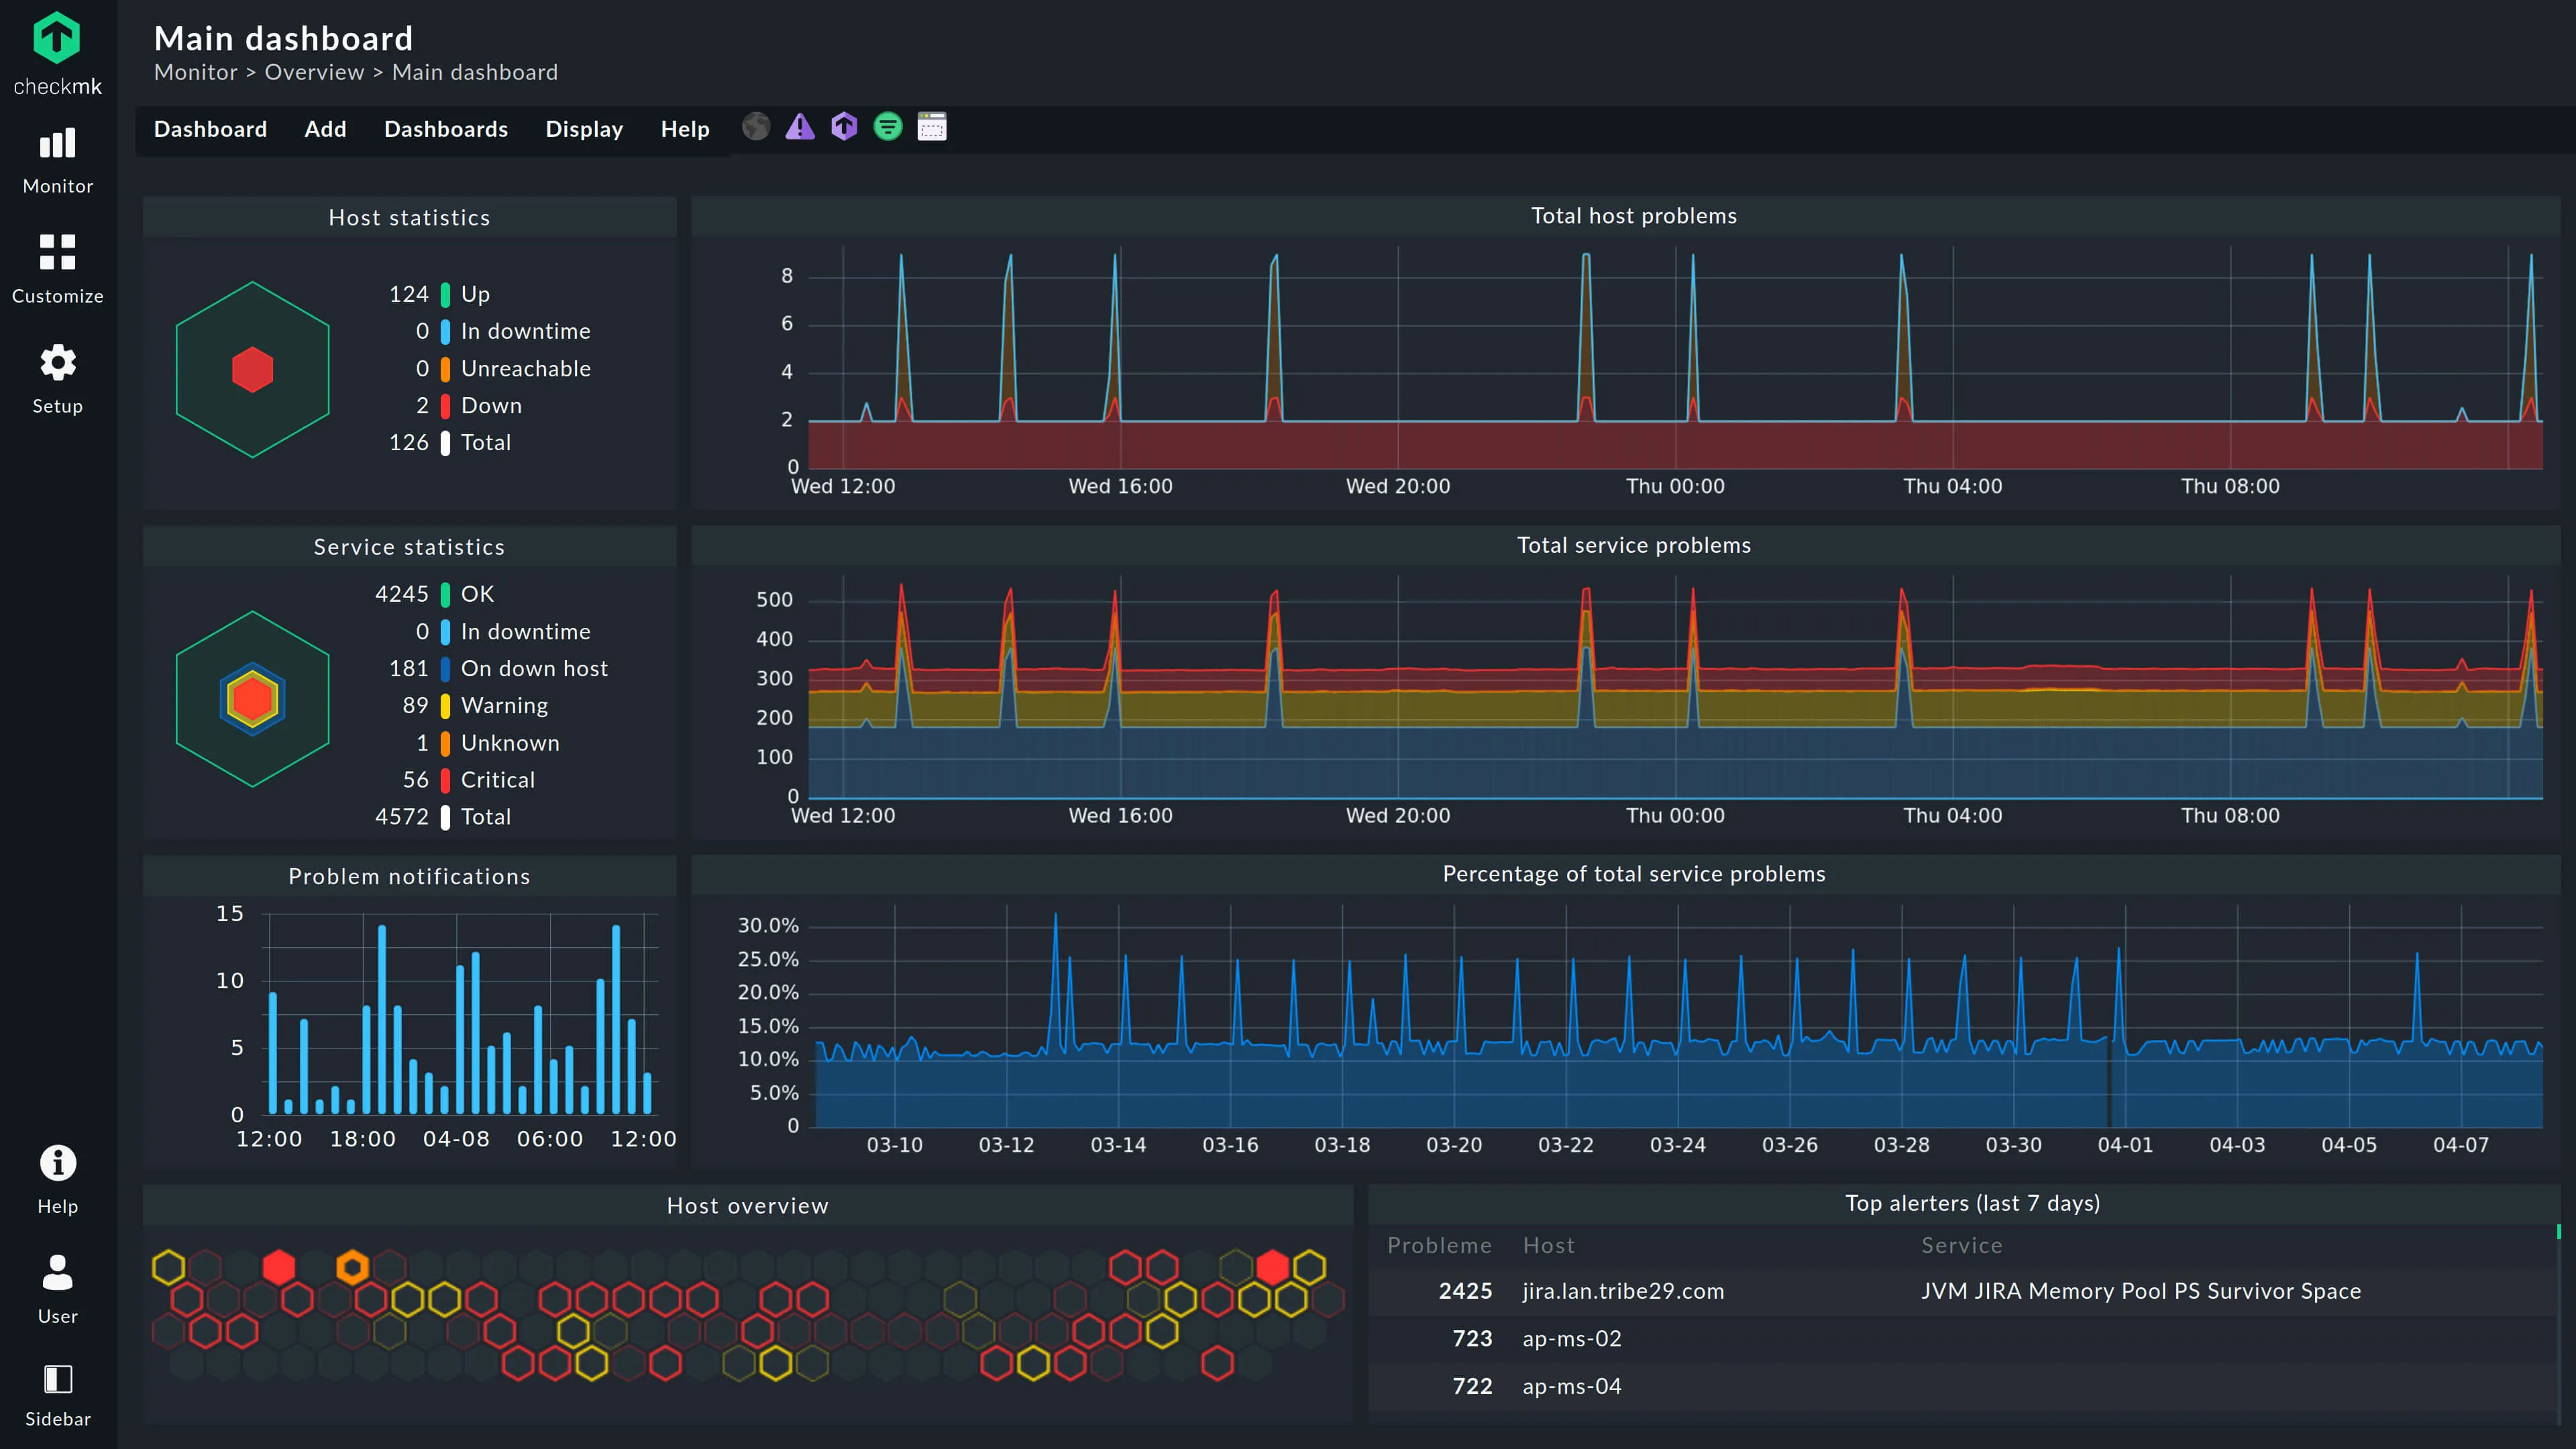
Checkmk is a comprehensive monitoring tool that excels in hybrid IT. It bridges Nagios-style checks and modern metric collection, with auto-discovery.
Key features
- Hybrid monitoring: Bare metal, switches, and Docker containers.
- Automatic service discovery: Scans hosts and configures checks.
- 2,000+ plugins: A massive library of integrations.
Pros
- All-in-one: State checks and metric performance.
- Auto-discovery: Less manual setup than 360monitoring’s per-check model.
Cons
- UI feels dated: Functional but cluttered.
- No logs: Like Zabbix, it is metrics and state, not logs.
Best for: Sysadmins managing mixed infrastructure who want depth and auto-discovery.
Price Open Source edition is free. Enterprise starts at ~$2,100/yr for 3,000 services. SaaS starts at ~€7.20 per host/month.
6. Netdata
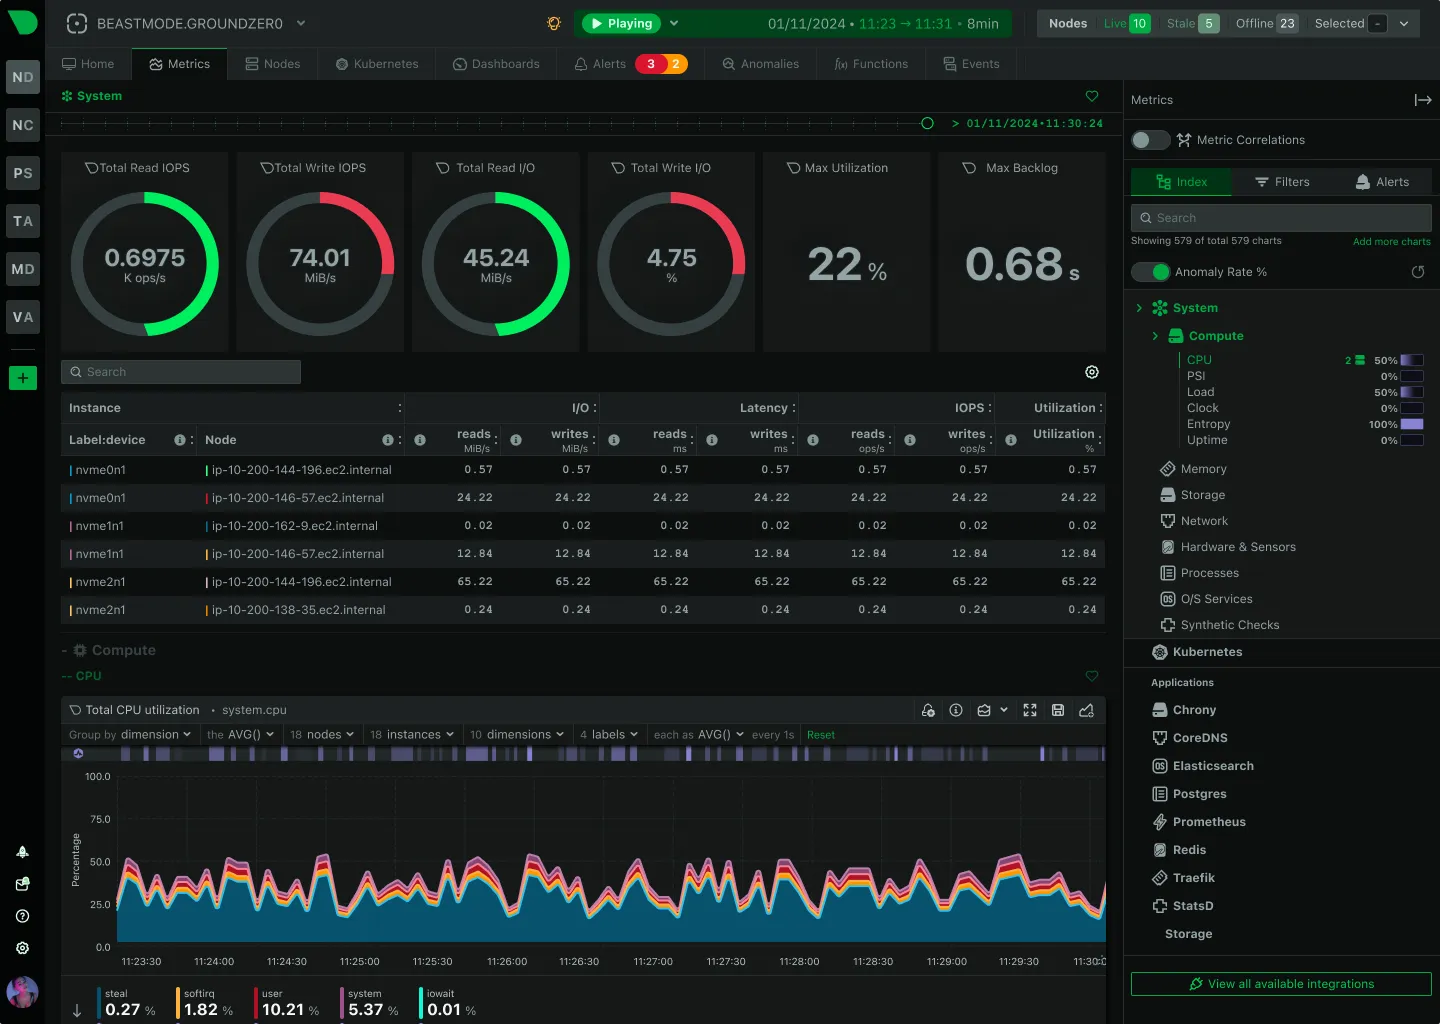
Netdata focuses on real-time, high-resolution single-node monitoring. It auto-detects everything on the host, a big step up from 360monitoring’s basic metrics.
Key features
- Real-time metrics: Second-level granularity.
- Unsupervised ML: Built-in anomaly detection.
- Auto-discovery: Automatically detects services and apps.
Pros
- Instant visibility: Hundreds of charts the moment you install.
- No config: Auto-detects everything.
- Free for small setups: Up to 5 nodes.
Cons
- Scaling complexity: Fleet-wide aggregation needs more work than centralized tools.
- Higher resource usage: On-host ML costs CPU and RAM.
- Logs still maturing: Less complete than a dedicated log tool.
Best for: Teams that want instant, high-resolution visibility with zero config.
Price Free for up to 5 nodes. Business plans start around $4.50/node/month.
7. Prometheus & Grafana
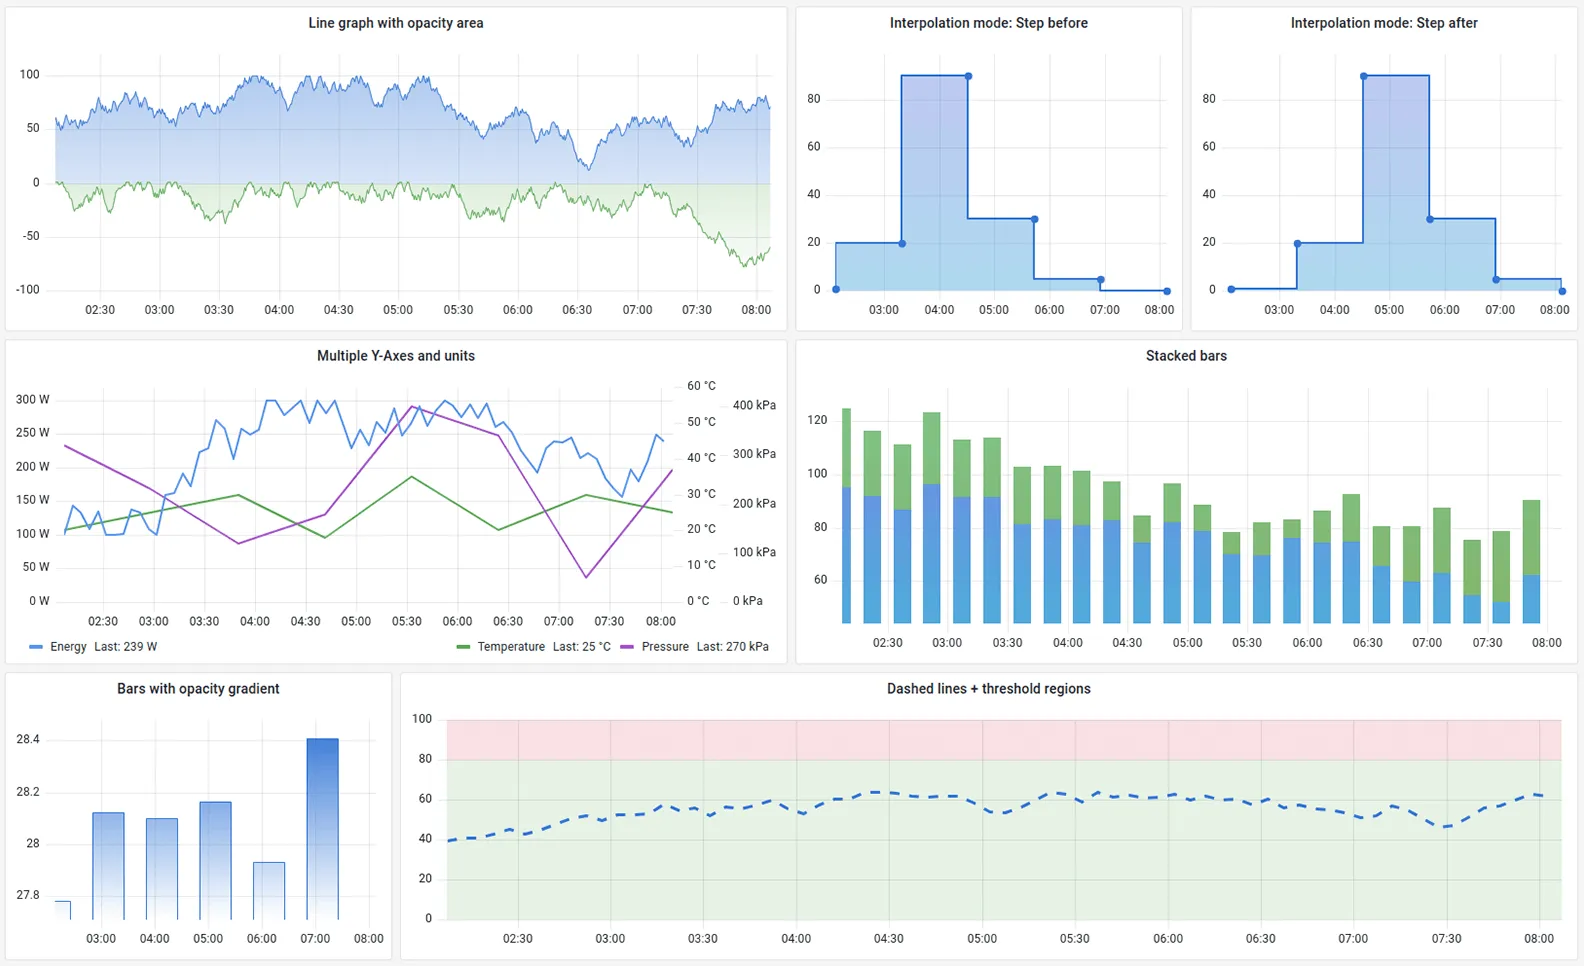
Prometheus paired with Grafana is the open-source standard for cloud-native metrics. It is a different category from 360monitoring, focused on metrics dashboards.
Key features
- Multi-dimensional data model: Powerful queries with PromQL.
- Huge exporter ecosystem: Metrics for almost everything.
- Alertmanager: Sophisticated alert routing.
Pros
- Industry standard: The de facto choice for Kubernetes.
- Open source: Free to self-host.
- Rich metrics: Far deeper than 360monitoring.
Cons
- Complexity: You maintain a stack, not a product.
- No logs: Metrics only.
- Not panel-integrated: A standalone stack, which is a feature for teams leaving Plesk.
Best for: Platform engineering teams with SRE resources running cloud-native workloads.
Price Free (open source). Managed options like Grafana Cloud are usage-based.
8. Site24x7
Site24x7 is an all-in-one monitoring suite from ManageEngine that covers uptime, server, network, application, and cloud monitoring in one product.
Key features
- Broad suite: Uptime, server, network, app, and cloud in one product.
- Large monitor catalog: A wide range of monitor types.
- Status pages: Included.
Pros
- Wide coverage: One vendor for many monitoring needs.
- MSP-friendly: Multi-tenancy and client portals.
Cons
- Legacy bloat: The UI is dated and feature-dense.
- Add-on pricing: Many capabilities are billed as add-ons.
- Shallow depth: Like 360monitoring, breadth comes at the cost of depth.
Best for: Organizations that want a single suite covering many monitoring types and accept a dated UI.
Price Free tier available. Paid plans are usage-based and stack with monitor types.
Conclusion
360monitoring is a convenient choice if you already run Plesk and only need basic metrics and uptime inside the panel. But for teams that want a complete, independent stack, the basic metrics and ecosystem lock-in become real limits.
- For a complete, independent stack: Try Simple Observability. Metrics, logs, alerts, and cron in one platform.
- For full observability and budget to match: Datadog is the broadest, most polished option.
- For on-prem depth without licensing: Zabbix is the free heavyweight.
Pick the tool that gives you a complete picture instead of basic metrics you supplement with other tools. For a head-to-head breakdown, see our 360monitoring comparison page, and for another angle, our Zabbix alternatives guide covers the on-prem side.