
Checkmk is one of the most capable monitoring platforms available. Its auto-discovery is genuinely impressive, the core engine handles thousands of services on modest hardware, and it covers everything from bare metal to containers.
But if you’re searching for a Checkmk alternative, you’ve probably already hit the gap between what Checkmk can do and how much effort it takes to get there. The rule-based configuration is powerful but dense. Multi-site deployments need careful planning. And the UI hasn’t kept up with what modern teams expect.
This article covers seven practical alternatives, starting with a quick comparison, then the specific pain points that drive teams away from Checkmk, and finally an honest look at each option, including when Checkmk is still the right call.
Quick summary
| Tool | Best for | Complexity | Price |
|---|---|---|---|
| Simple Observability | Simplicity and zero ops | Low | $3/mo per server |
| Zabbix | Large on-prem fleets | High | Free (OSS) / $50/mo (Cloud) |
| Prometheus + Grafana | Kubernetes / cloud native | High | Free (OSS) / Managed paid |
| Netdata | Real-time single-node visibility | Low | Free / ~$4.50/node/mo |
| SigNoz | Unified metrics, logs, traces | Medium | Free (OSS) / $49/mo (Cloud) |
| ManageEngine OpManager | Windows / network-centric IT | Medium | $245/yr (25 devices) |
| Atera | MSPs / IT departments | Low | $149/technician/mo |
Why teams look for a Checkmk alternative
Checkmk frustrations tend to be operational, not functional. The tool works. The problem is how much time it takes to keep it working.
The rule engine is powerful but opaque
Checkmk’s configuration model is built around rules, folders, and host tags. Understanding why a particular check behaves a certain way often requires tracing through multiple rule layers. Debugging means reverse-engineering rule precedence across folders, host tags, and explicit exceptions.
For teams without a dedicated Checkmk expert, this becomes a bottleneck.
Distributed monitoring adds real overhead
Multi-site setups require configuring replication, managing activation across sites, and maintaining separate Apache instances. This makes sense for large enterprises, but it’s overkill for organizations with 20-50 servers across a few locations.
Plugin management compounds over time
Over 2,000 check plugins is a strength, but managing local checks, deploying custom plugins via the agent bakery, and keeping everything in sync across agent versions creates maintenance work that grows with your infrastructure.
Enterprise pricing is hard to predict
Checkmk prices by the number of services, not hosts. A single host can generate 10 to 100+ services depending on what’s running, making cost estimation difficult. The free Raw Edition lacks features like the agent bakery and distributed monitoring that most teams eventually need.
The UI hasn’t aged well
The interface is information-dense but dated. Navigation relies on sidebar menus and filters that require familiarity. Compared to modern monitoring UIs with contextual dashboards and intuitive drill-downs, Checkmk creates friction for anyone who isn’t already an expert.
How to evaluate a Checkmk replacement
When comparing Checkmk competitors, focus on the criteria that determine whether a tool will actually reduce your operational burden.
Time-to-first-dashboard. Checkmk’s setup involves creating sites, adding hosts, discovering services, and activating changes. Some alternatives get you to a working dashboard in under five minutes.
Configuration philosophy. Checkmk uses rule-based configuration with inheritance. Some alternatives use declarative YAML, others are fully UI-driven. The key question is: can a new team member make changes without breaking things?
Observability breadth. Checkmk is primarily a metrics and state-check tool. If you also need logs in the same platform, that narrows the field.
Cost predictability. Checkmk’s service-based pricing makes budgeting difficult. Look for per-host or flat-rate models if budget clarity matters to your team.
7 best Checkmk alternatives
1. Simple Observability
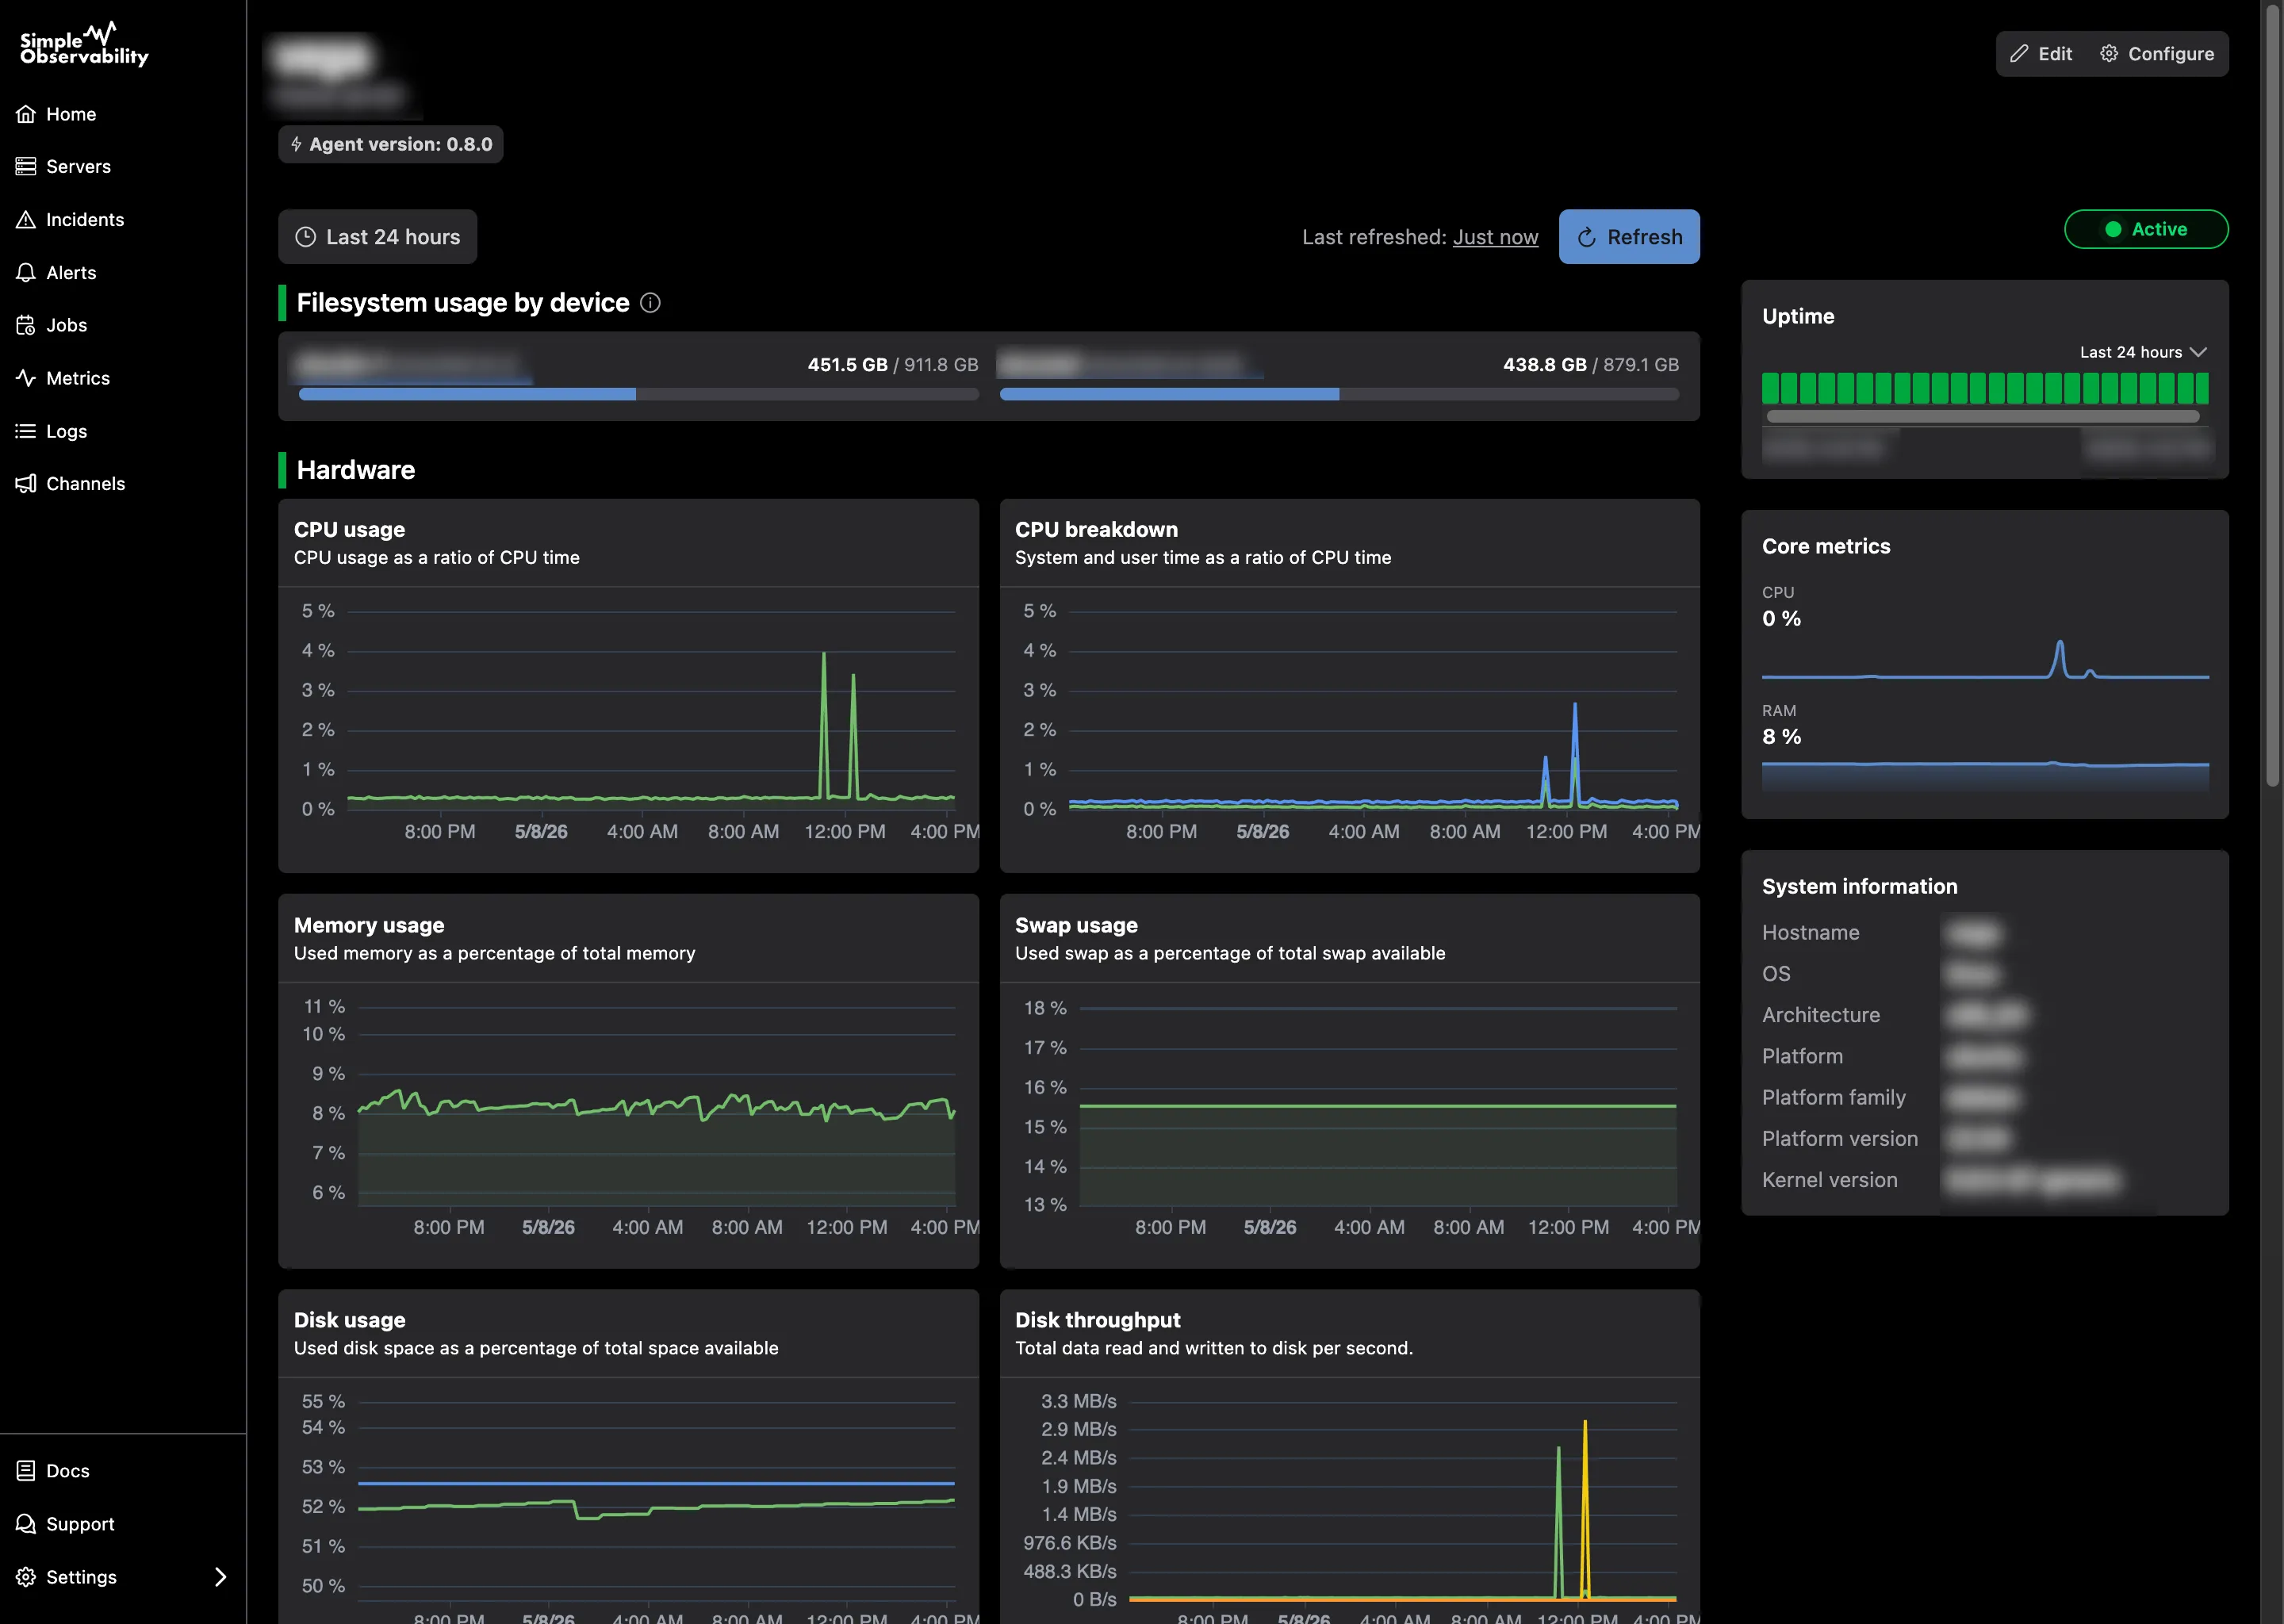
Simple Observability is designed to be the opposite of Checkmk in terms of complexity. One command installs the agent. Configuration happens through the UI. Metrics and logs show up in the same view. There’s no rule engine to learn, no sites to replicate, and no database to maintain.
Best for: Small-to-mid server fleets where the goal is “install and move on.”
Pros
- One-command install, zero configuration needed.
- Unified metrics and logs in a single dashboard.
- Flat, predictable pricing per server.
Cons
- Less granular control than Checkmk’s rule-based system.
- SaaS only, not suitable for air-gapped environments.
Price: Free for 1 server. $3/mo per server after that.
2. Zabbix
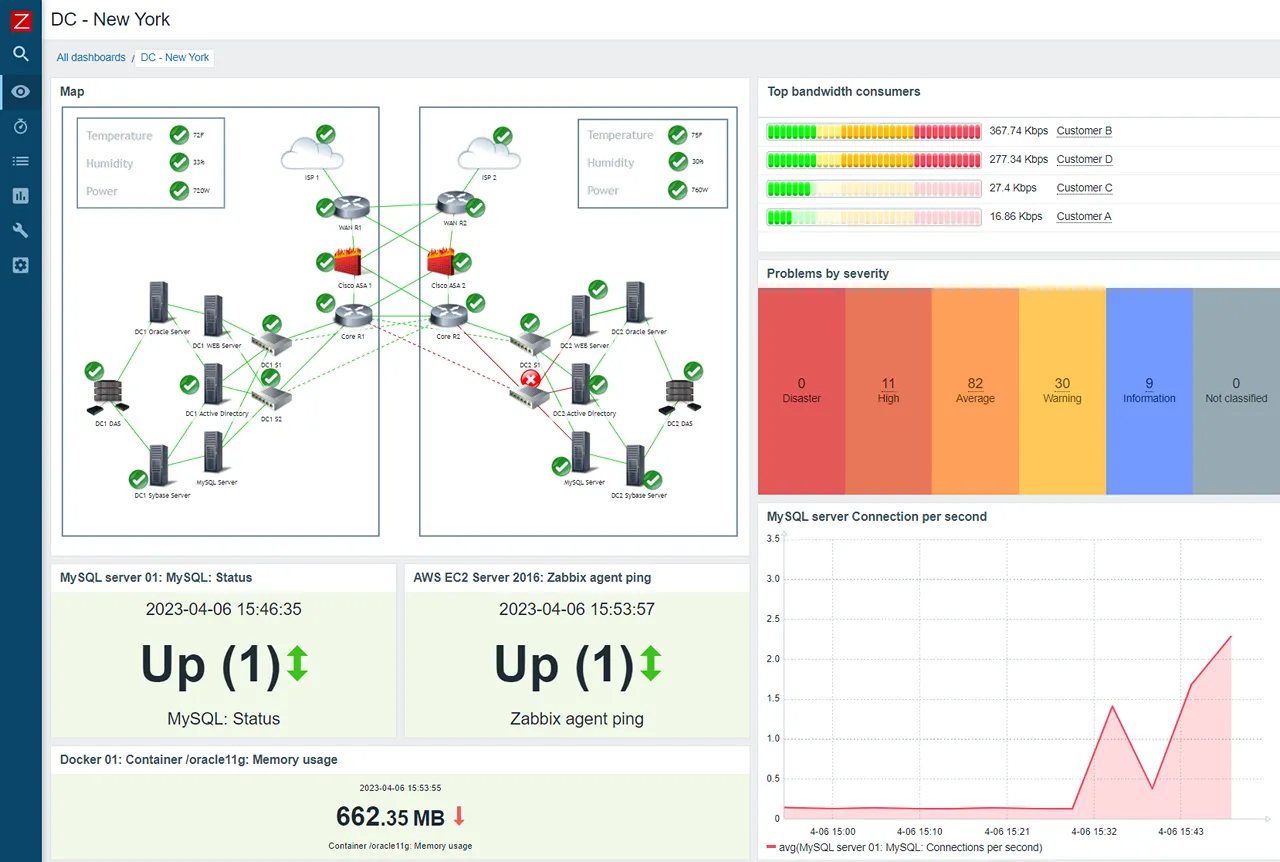
Zabbix is Checkmk’s closest competitor in scope and philosophy. It’s a full-featured, open-source monitoring platform that handles infrastructure, network devices, and applications. Like Checkmk, it’s been around for over two decades.
Best for: Large on-prem environments with dedicated monitoring teams who want full control without licensing costs.
Pros
- Completely open source with no feature-gated tiers.
- Supports agent-based, SNMP, JMX, and IPMI monitoring.
- Strong template system for standardizing monitoring across device types.
- Zabbix Cloud offers a managed option.
Cons
- Configuration is verbose (XML templates) and the learning curve rivals Checkmk’s.
- The UI has improved but still feels utilitarian.
- Cloud-native support requires complex discovery rules.
Price: Free to self-host. Zabbix Cloud starts at $50/month.
If you’re evaluating other traditional infrastructure monitoring tools, our Zabbix comparison covers the tradeoffs in more detail.
3. Prometheus and Grafana
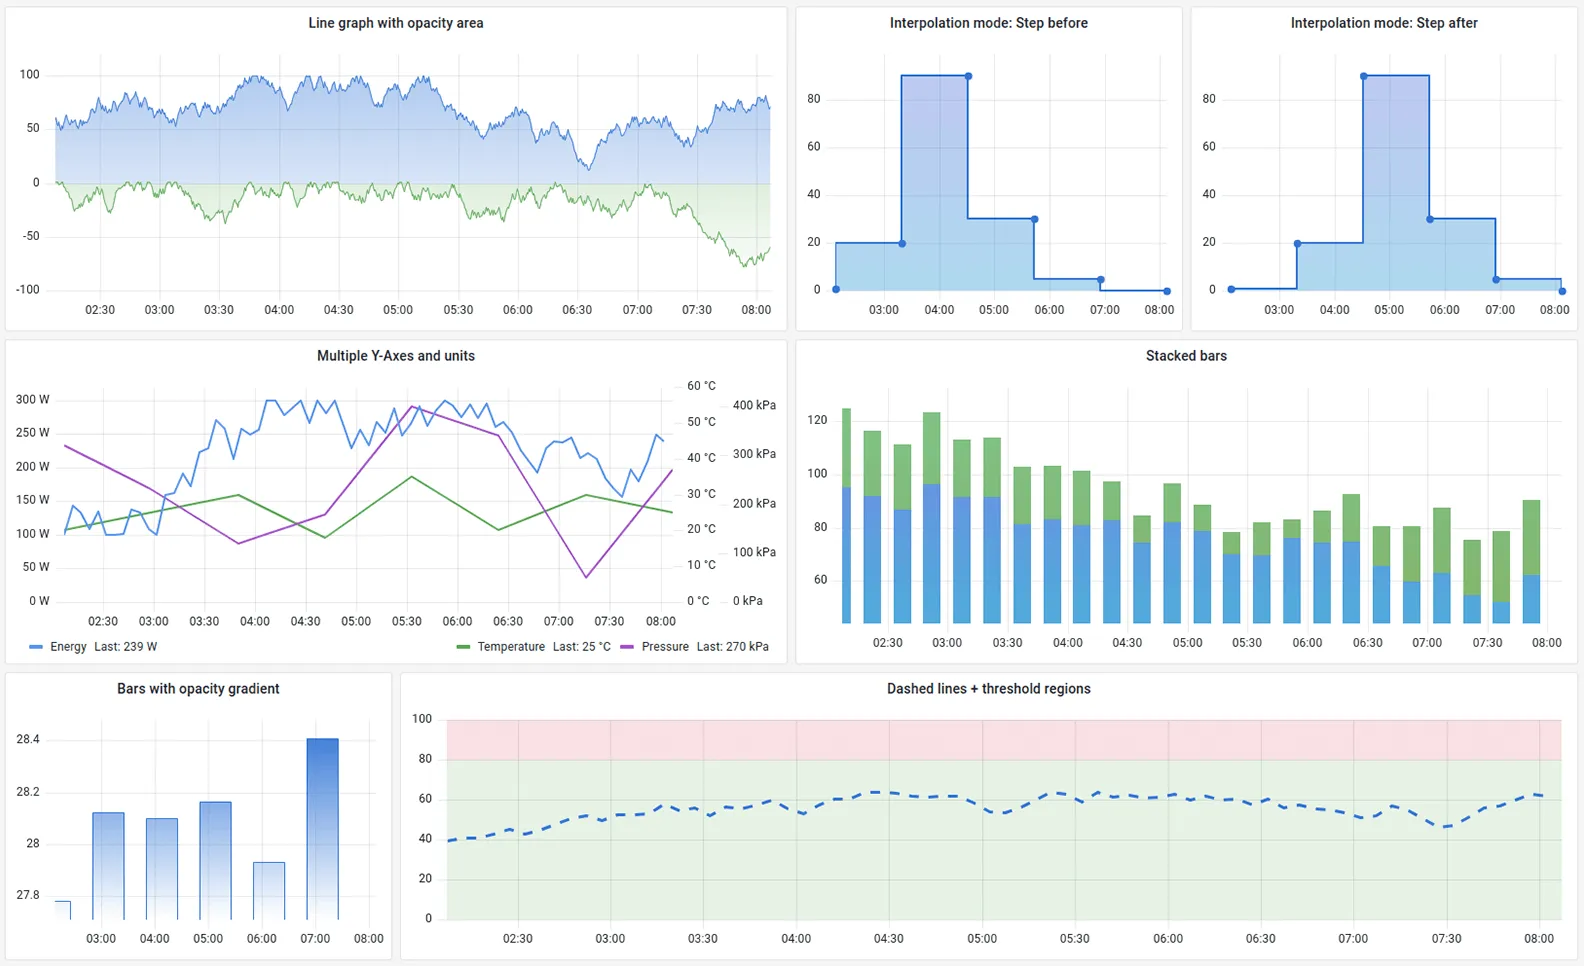
Prometheus paired with Grafana is the industry standard for cloud-native monitoring. Where Checkmk grew out of the Nagios world (state checks, host/service hierarchy), Prometheus was built for dynamic, containerized environments where hosts come and go.
Best for: Kubernetes clusters, platform engineering teams, and organizations with SRE resources.
Pros
- PromQL is far more expressive than Checkmk’s threshold-based alerting.
- Native service discovery for Kubernetes, AWS, and other dynamic environments.
- Massive ecosystem of exporters.
- Grafana provides best-in-class visualization.
Cons
- You’re managing a stack (Prometheus, Grafana, Alertmanager, often Thanos), not a single product.
- No built-in log management.
- PromQL has a steep learning curve.
Price: Free (open source). Managed options like Grafana Cloud are usage-based.
4. Netdata
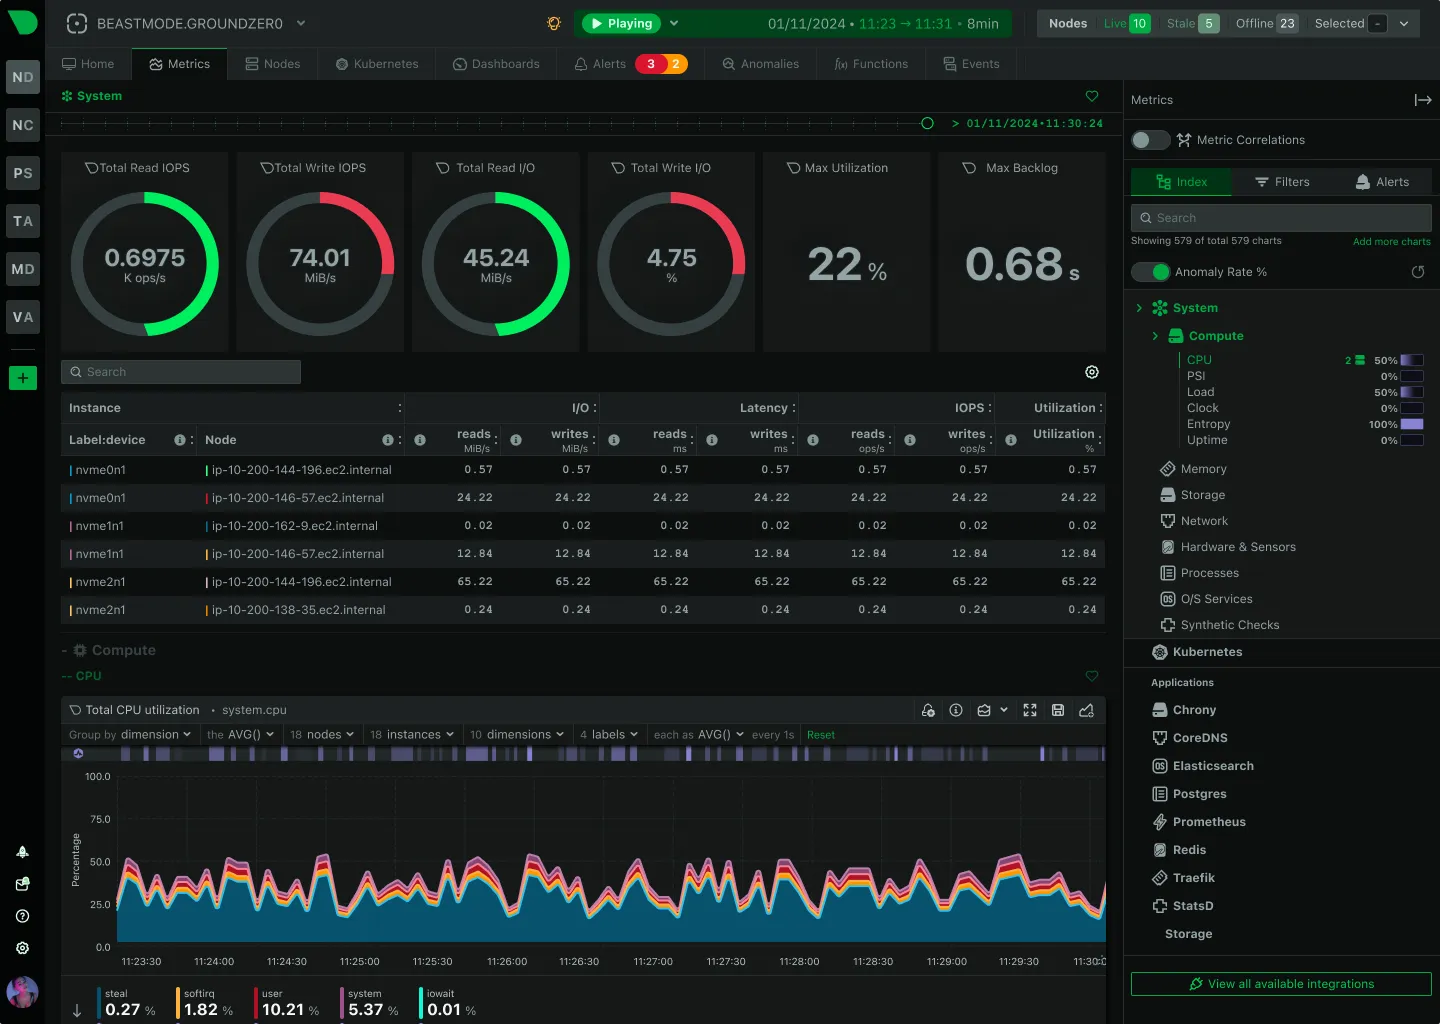
Netdata takes the opposite approach from Checkmk. Instead of requiring extensive configuration before you see data, it auto-detects everything on the host and starts collecting metrics immediately with per-second granularity.
Best for: Teams that want instant, high-resolution visibility into individual servers without configuration overhead.
Pros
- Install the agent and you immediately get hundreds of charts (CPU, memory, disk, network, applications).
- Built-in anomaly detection using unsupervised ML.
- The real-time dashboard is impressive for single-node troubleshooting.
Cons
- Fleet-wide aggregation is more complex than centralized tools.
- Higher resource usage per node because of on-host ML and high-res data processing.
- Log support is still maturing.
Price: Free for up to 5 nodes. Business plans start around $4.50/node/month.
For a deeper look at Netdata’s tradeoffs, see our modern monitoring stack comparison.
5. SigNoz
SigNoz is an open-source observability platform built on OpenTelemetry and ClickHouse. It unifies metrics, logs, and traces in a single UI, something Checkmk doesn’t attempt.
Best for: Teams that want a self-hosted, open-source alternative to Datadog with full-stack observability.
Pros
- Metrics, logs, and distributed traces in one place.
- OpenTelemetry native with broad language and framework support.
- ClickHouse backend provides fast queries at scale.
- Cloud option available.
Cons
- Newer project with a smaller community than Checkmk, Zabbix, or Prometheus.
- Self-hosting means managing ClickHouse, which adds its own complexity.
- Less mature for traditional infrastructure monitoring (SNMP, network devices).
Price: Self-hosted is free. SigNoz Cloud starts at $49/month (usage-based).
6. ManageEngine OpManager
ManageEngine OpManager is a commercial monitoring platform popular in Windows-heavy and network-centric environments. Where Checkmk leans toward Linux and mixed infrastructure, OpManager feels more at home in enterprise IT departments running Microsoft stacks.
Best for: IT departments with heavy Windows/Active Directory environments and network monitoring needs.
Pros
- Good auto-discovery for network devices and Windows servers.
- Built-in flow analysis (NetFlow, sFlow, jFlow) for network traffic.
- Perpetual licensing option available.
Cons
- The interface can feel cluttered and enterprise-heavy.
- Cloud-native and container monitoring is not its strength.
- Device-based licensing scales quickly for larger environments.
Price: Free for up to 3 devices. Standard Edition starts at $245/year for 25 devices.
7. Atera
Atera is an IT management platform that bundles remote monitoring with PSA, remote access, and ticketing. It’s not a direct monitoring competitor to Checkmk, but it serves a similar audience: IT teams managing fleets of servers and workstations.
Best for: MSPs and IT departments that want monitoring, ticketing, and remote access in one subscription.
Pros
- Per-technician pricing with unlimited devices. Predictable costs regardless of fleet size.
- Combines monitoring, patching, remote access, and helpdesk.
- Significantly less technical setup than Checkmk.
Cons
- Monitoring depth is shallow compared to Checkmk. No granular service-level checks or custom plugins.
- Per-technician pricing ($149+/month) gets expensive as the team grows.
Price: IT department plans start at $149/technician/month. MSP plans start at $129/technician/month. Unlimited endpoints included.
When you should NOT leave Checkmk
Checkmk isn’t the right tool for every team, but for certain use cases, nothing else comes close.
Large, heterogeneous infrastructure. If you’re monitoring hundreds of hosts across bare metal, VMs, containers, and network gear, Checkmk’s breadth of built-in checks is hard to beat. Replacing it with something simpler often means losing visibility into legacy or niche systems.
Deep rule customization. The rule engine that frustrates smaller teams is exactly what larger organizations need. If your monitoring requires complex exception handling across host groups, folders, and time periods, Checkmk’s rule hierarchy is purpose-built for that.
Compliance-driven environments. Checkmk’s audit logging, role-based access, and on-premises deployment options make it a solid choice for regulated industries.
Existing investment. If your team has spent years building Checkmk knowledge, custom checks, and runbooks around its alerting model, the migration cost may outweigh the benefits. Don’t underestimate the institutional knowledge locked in your current setup.
If you’re evaluating other legacy monitoring replacements, we cover the Nagios migration path separately.