
Icinga is a Nagios fork that modernized the classic monitoring approach. It keeps compatibility with thousands of Nagios plugins while adding a modern web interface, a configuration API, and distributed monitoring support. For teams invested in the Nagios model, it is a genuine upgrade.
The cost is operational. Icinga still leans on a configuration DSL and an object model that takes real time to learn, and you run the server, the database, and the web interface yourself. “Free” means you are on call for your own monitoring stack. If you want the operational picture out of the box without the config language and self-hosted infrastructure, Simple Observability gives you metrics, logs, and alerts at a fixed per-server price.
This article covers the best alternatives to Icinga in 2026. We start with what Icinga does well and where it struggles, then the criteria for evaluating a replacement, and finally a comparison of each option. If you are comparing other tools, see our Nagios alternative and Zabbix alternatives guides.
Quick summary
| Tool | Best For | Price Model |
|---|---|---|
| Simple Observability | Zero-config, managed | $3 / mo / server |
| Zabbix | Large on-prem fleets | Free (OSS) / EUR 50/mo (Cloud) |
| Nagios | Legacy stability | $2,495+ (XI License) |
| Checkmk | Complex IT / Hybrid | ~EUR 7.20 / host / month |
| Prometheus & Grafana | Cloud Native / K8s | Free (OSS) / Managed paid |
| Datadog | Enterprise / full APM | $15+ / host / month |
| Netdata | Real-time single-node | Free / ~$4.50/node/mo |
| SigNoz | Unified metrics, logs, traces | Free (OSS) / $49/mo (Cloud) |
Icinga Overview
Known for
Icinga is best known for being a modernized Nagios. It keeps Nagios plugin compatibility and adds a better web interface (Icinga Web 2), a configuration API, and built-in support for distributed monitoring and high availability.
Key features
- Icinga Director: A web-based tool to manage configuration, easier than editing config files.
- Distributed monitoring: Built-in support for distributed setups and HA.
- Plugin compatibility: Compatible with thousands of existing Nagios plugins.
- Configuration API: Automate config changes programmatically.
Why look for an Icinga alternative?
While Icinga modernizes Nagios, it inherits a lot of the old-world friction.
1. The configuration DSL
Icinga has its own configuration language and object model. Understanding inheritance, apply rules, and templates takes real time, and debugging why a check behaves a certain way often means tracing through multiple layers.
2. Self-hosted infrastructure
You run the Icinga server, the database (often MySQL or PostgreSQL), and the web interface. That is real maintenance, and it is the same burden Icinga inherited from Nagios, just polished.
3. State checks, not metrics
Icinga is fundamentally a state-check tool (OK/WARNING/CRITICAL). It handles performance data, but it is not a metrics and graphing platform the way modern tools are. You often pair it with Grafana for visualization.
4. Logs are out of scope
Icinga does not do log management. If you need to correlate a state change with logs, you are back to a second tool.
How to choose an alternative?
When comparing Icinga competitors, focus on what actually changes your workflow.
- Config model: Decide whether you want a config DSL, YAML, or a fully UI-driven experience. The DSL is the biggest Icinga friction.
- Hosted vs self-hosted: Do you want to run the stack or have someone run it?
- Metrics vs state: Do you need rich metrics and graphs, or is up/down state enough?
- Logs: If logs matter, check whether the tool includes them natively.
8 Best Icinga Alternatives
1. Simple Observability
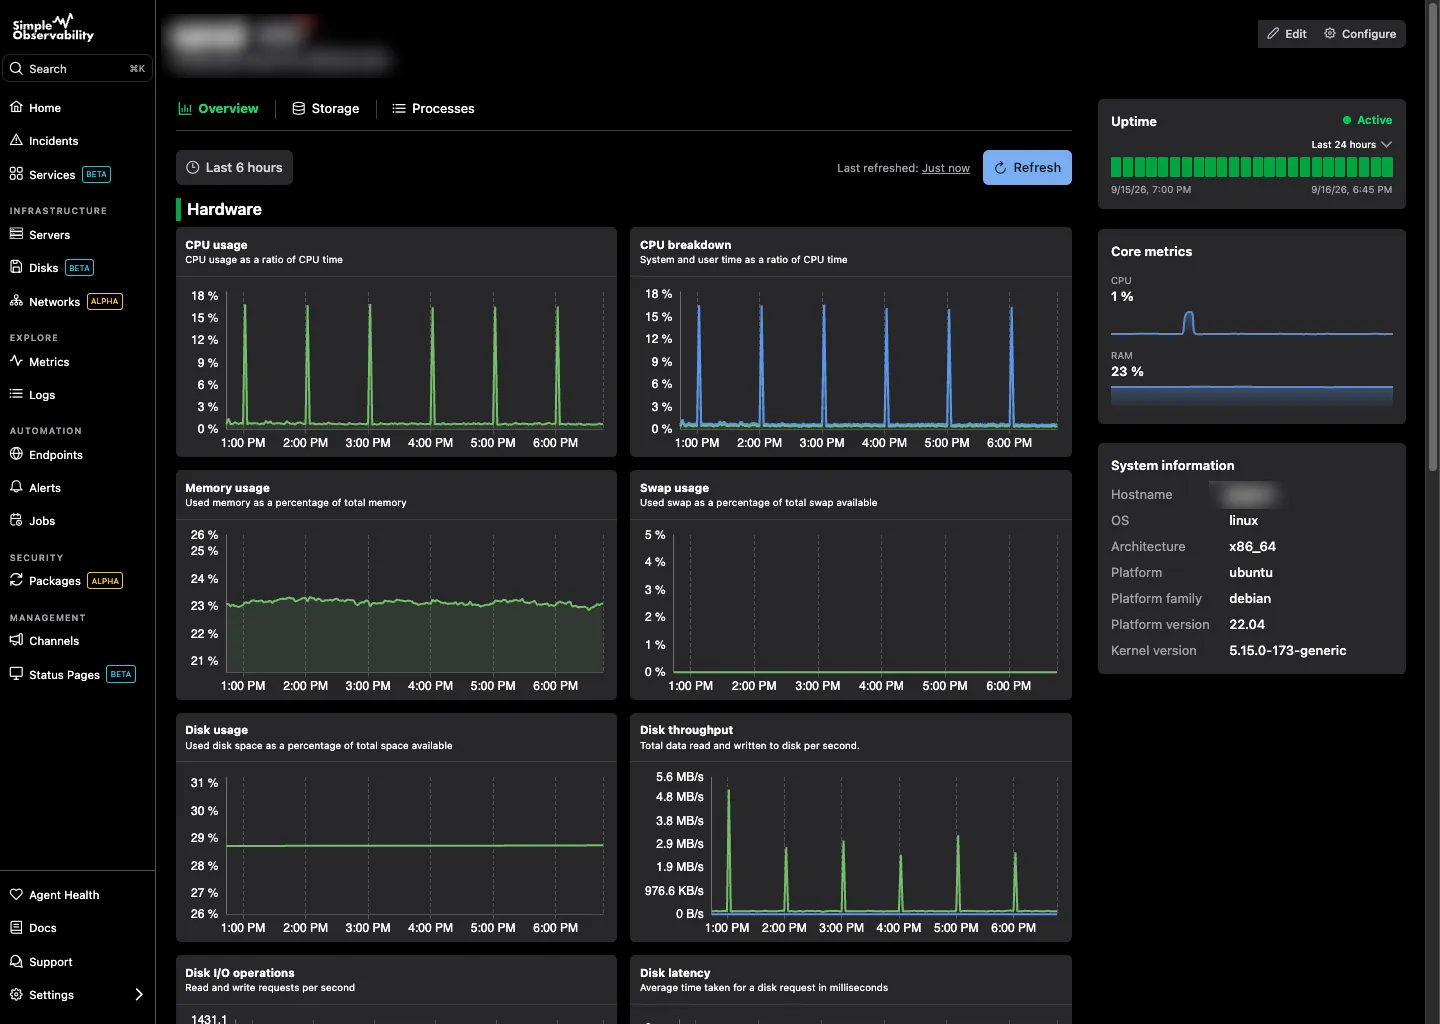
Simple Observability is built for teams that want the operational picture without the config DSL or the self-hosted infrastructure. It combines metrics, logs, and alerts in one dashboard, fully managed, at a fixed per-server price.
Key features
- Unified dashboard: CPU, memory, disk, and network alongside logs.
- Zero-config alerts: Sensible defaults from day one, no DSL or YAML.
- Lightweight agent: An open-source agent installed with one command.
- Fully managed: No server, database, or web interface to run.
Simple Observability vs Icinga Where Icinga is self-hosted and built around a configuration DSL, Simple Observability is fully managed and configured through the UI. You give up Nagios plugin compatibility, but you stop writing config and stop maintaining a monitoring server.
Pros
- No configuration language: UI-driven, with sane defaults out of the box.
- No operations: No database or web interface to run.
- Predictable pricing: Flat fee per server.
Cons
- No Nagios plugin compatibility: If you depend on specific check scripts, they do not carry over.
- Not network-device first: It is infrastructure monitoring, not a deep SNMP tool.
Best for: Teams that want metrics, logs, and alerts without the config DSL and self-hosted stack.
Price
- Free: $0 for 1 server.
- Paid: $3/mo per server for unlimited servers.
- Custom: Volume discounts for large fleets.
2. Zabbix
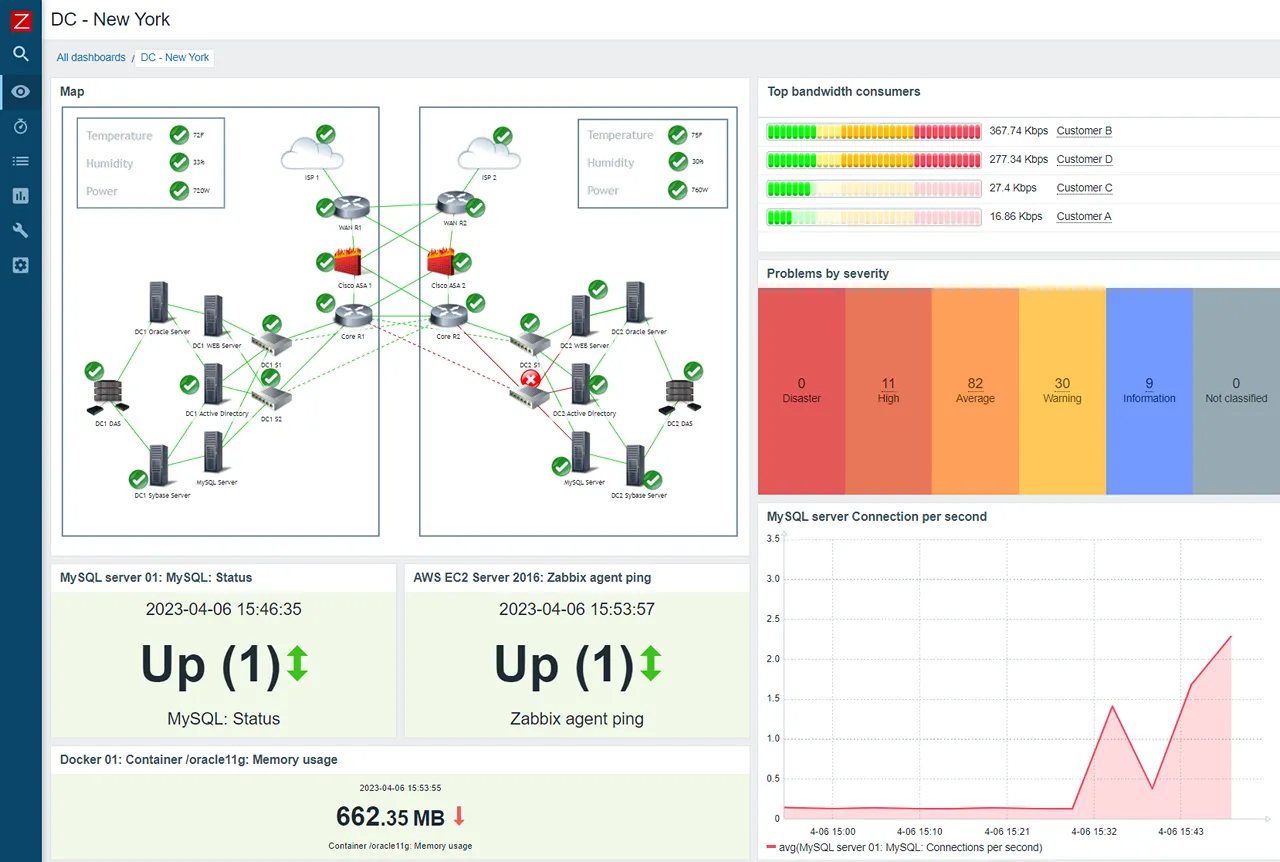
Zabbix is Icinga’s closest open-source competitor in scope. It covers network, server, and application monitoring, and is free to self-host with a broader built-in feature set than Icinga.
Key features
- Agent and agentless: SNMP, JMX, IPMI, or its own agent.
- Push and pull: Polling and trapping.
- Granular permissions: Strong multi-tenancy.
Pros
- Broader built-in: More metrics and graphing out of the box than Icinga.
- Open source: No feature-gated tiers.
- SaaS option: Zabbix Cloud offers a managed path.
Cons
- Complexity: Verbose XML templates, a learning curve similar to Icinga’s DSL.
- Self-hosted: You still run the server and database.
Best for: Large on-prem environments with dedicated monitoring teams.
Price Free to self-host. Zabbix Cloud starts at EUR 50/month.
3. Nagios
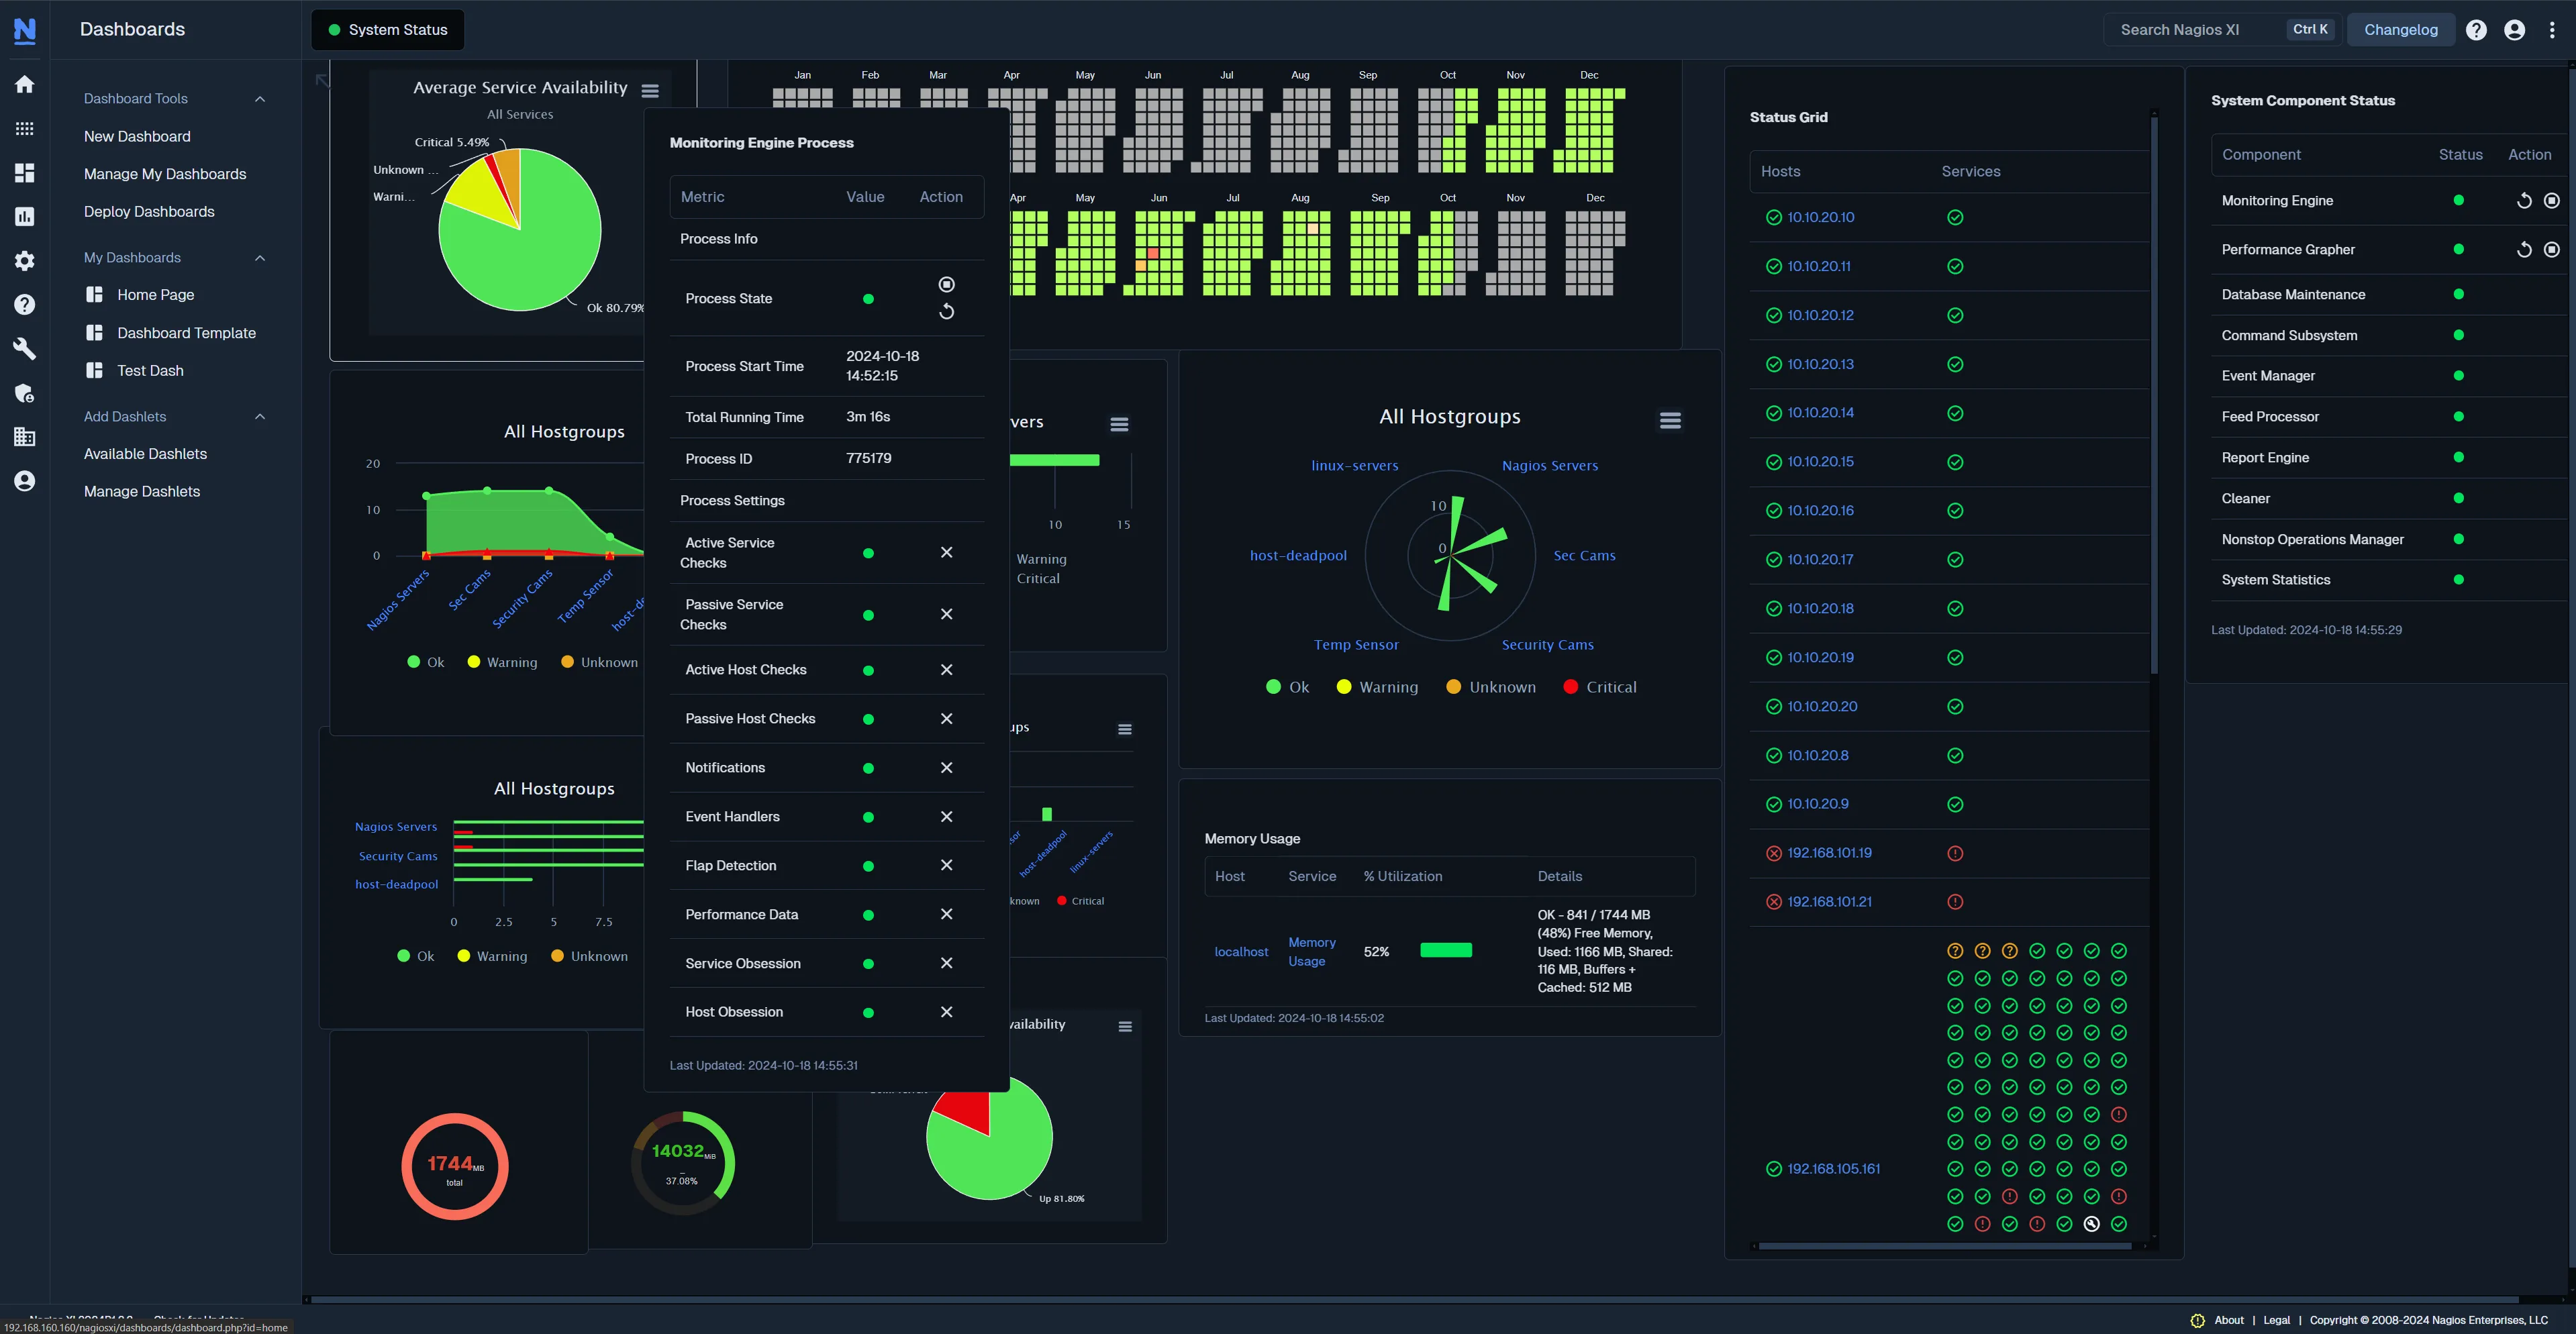
Nagios is the tool Icinga forked from. It is legacy by modern standards, but still widely deployed for its stability and check-script ecosystem.
Key features
- Plugin ecosystem: A script exists for almost any device.
- Binary state focus: Excellent for definitive OK/CRITICAL alerting.
Pros
- Reliability: Extremely stable and simple in its logic.
- Universal: Almost every sysadmin knows how to read a Nagios alert.
Cons
- Outdated: File-based config and a dated UI, even older than Icinga’s.
- Metrics: Fundamentally a status check tool, not a metrics tool.
Best for: Legacy environments or specific hardware checks only Nagios plugins support.
Price Nagios Core is free. Nagios XI starts at $2,495 for a standard license (up to 100 nodes).
4. Checkmk
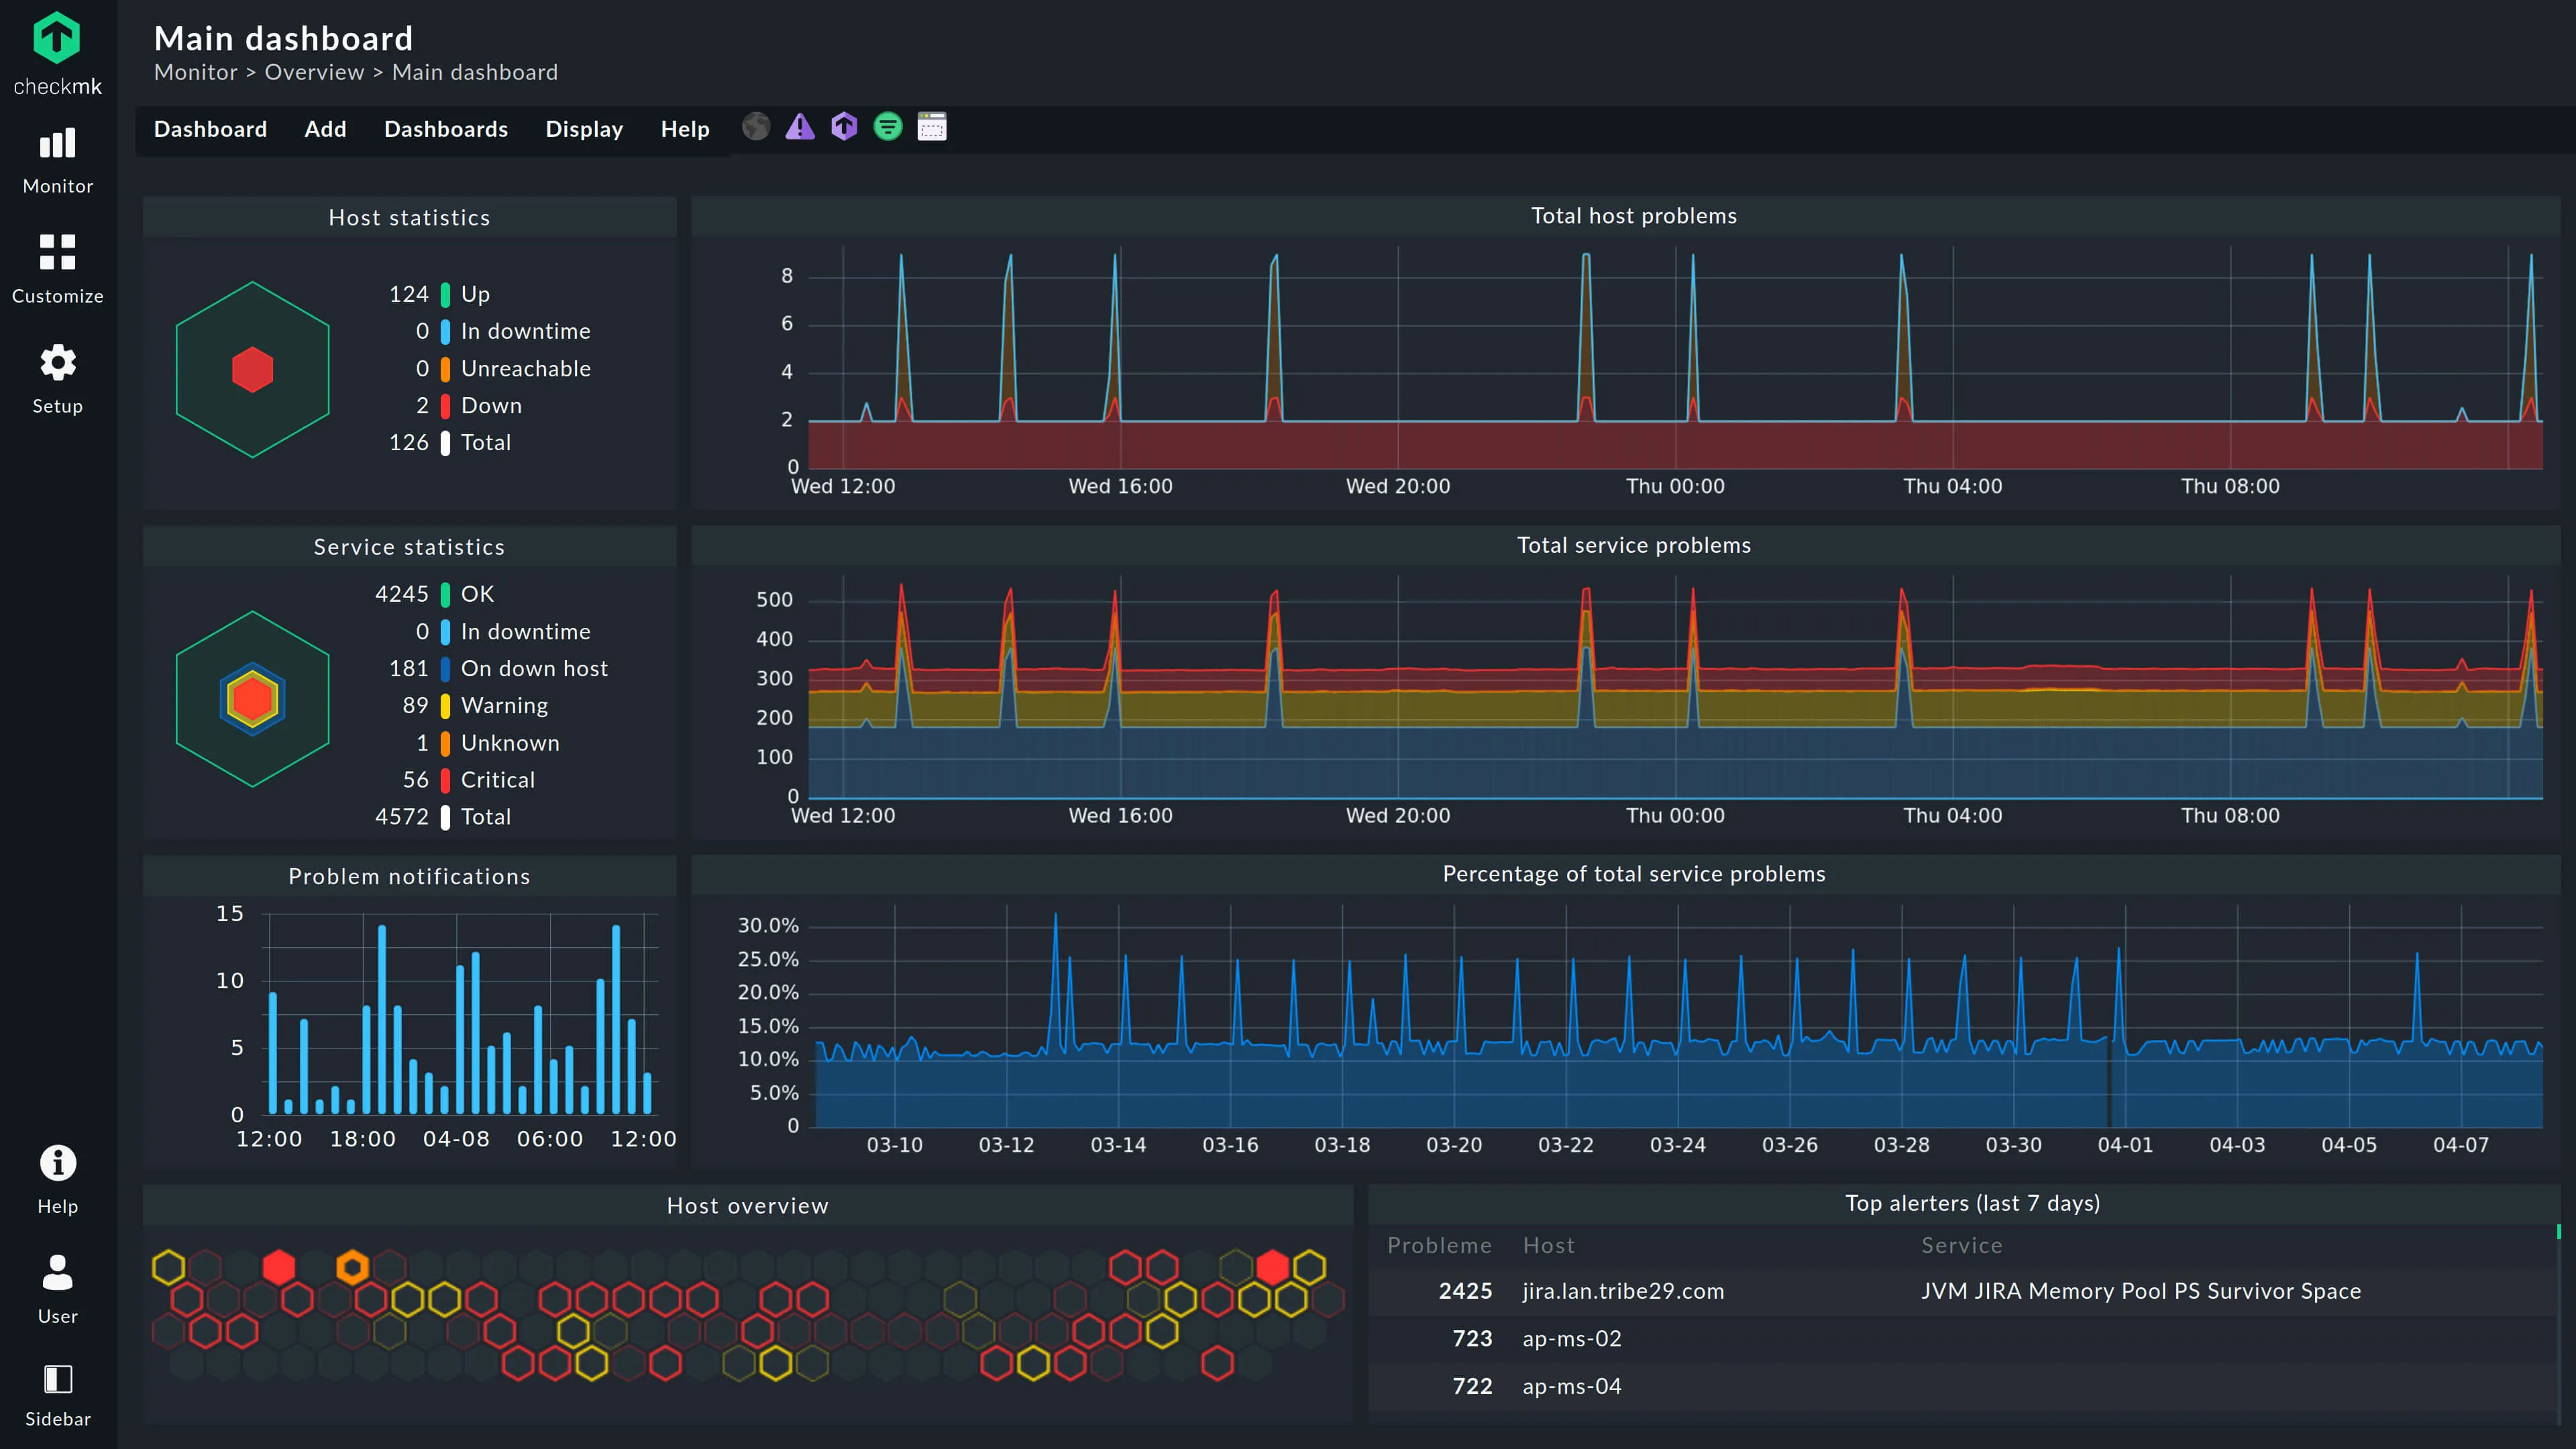
Checkmk is a comprehensive monitoring tool that excels in hybrid IT. It bridges Nagios-style checks and modern metric collection, and its auto-discovery reduces manual config.
Key features
- Hybrid monitoring: Bare metal, switches, and Docker containers.
- Automatic service discovery: Scans hosts and configures checks.
- 2,000+ plugins: A massive library, including Nagios plugin compatibility.
Pros
- All-in-one: State checks and metric performance.
- Auto-discovery: Far less manual config than Icinga’s DSL.
- Nagios compatibility: Like Icinga, it works with Nagios plugins.
Cons
- UI feels dated: Functional but cluttered.
- Learning curve: The rule engine has its own complexity.
Best for: Sysadmins managing mixed infrastructure who want Nagios compatibility with less manual config.
Price Open Source edition is free. Pro starts at EUR 190/mo (billed annually) for ~3,000 services. SaaS starts at ~EUR 7.20 per host/month.
5. Prometheus & Grafana
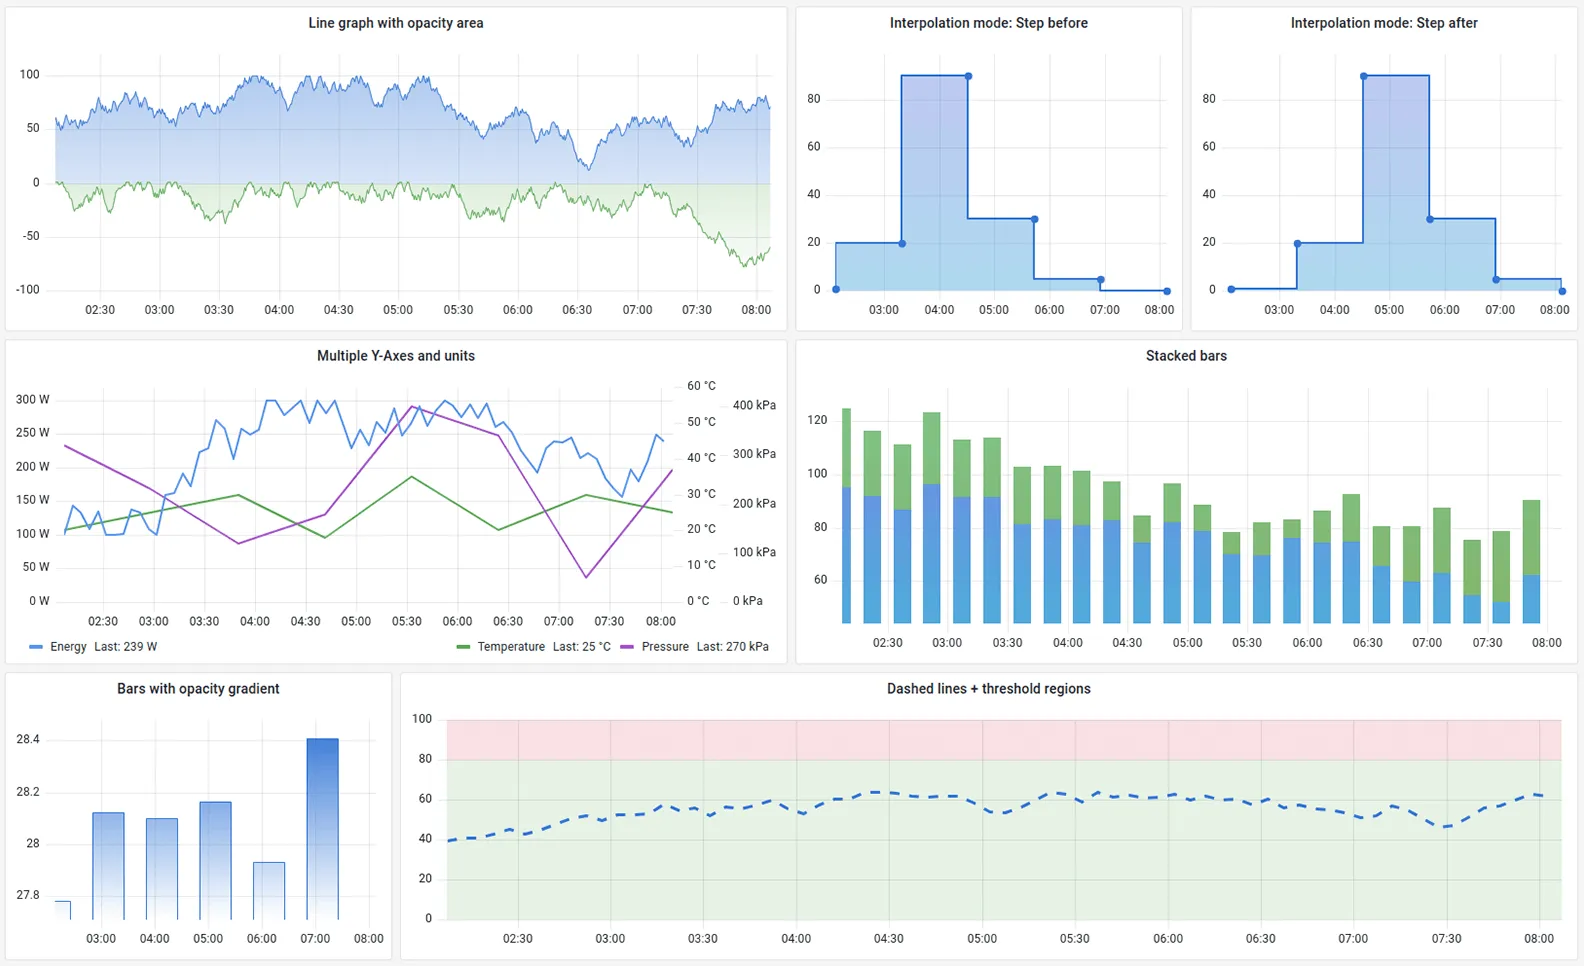
Prometheus paired with Grafana is the open-source standard for cloud-native metrics. It is a different category from Icinga, focused on metrics dashboards rather than state checks.
Key features
- Multi-dimensional data model: Powerful queries with PromQL.
- Huge exporter ecosystem: Metrics for almost everything.
- Alertmanager: Sophisticated alert routing.
Pros
- Industry standard: The de facto choice for Kubernetes.
- Open source: Free to self-host.
- Rich metrics: Far better graphing than Icinga.
Cons
- Complexity: You maintain a stack, not a product.
- No state checks: It is metrics-first, not the OK/CRITICAL model Icinga users know.
- No logs: Metrics only.
Best for: Platform engineering teams with SRE resources running cloud-native workloads.
Price Free (open source). Managed options like Grafana Cloud are usage-based.
6. Datadog
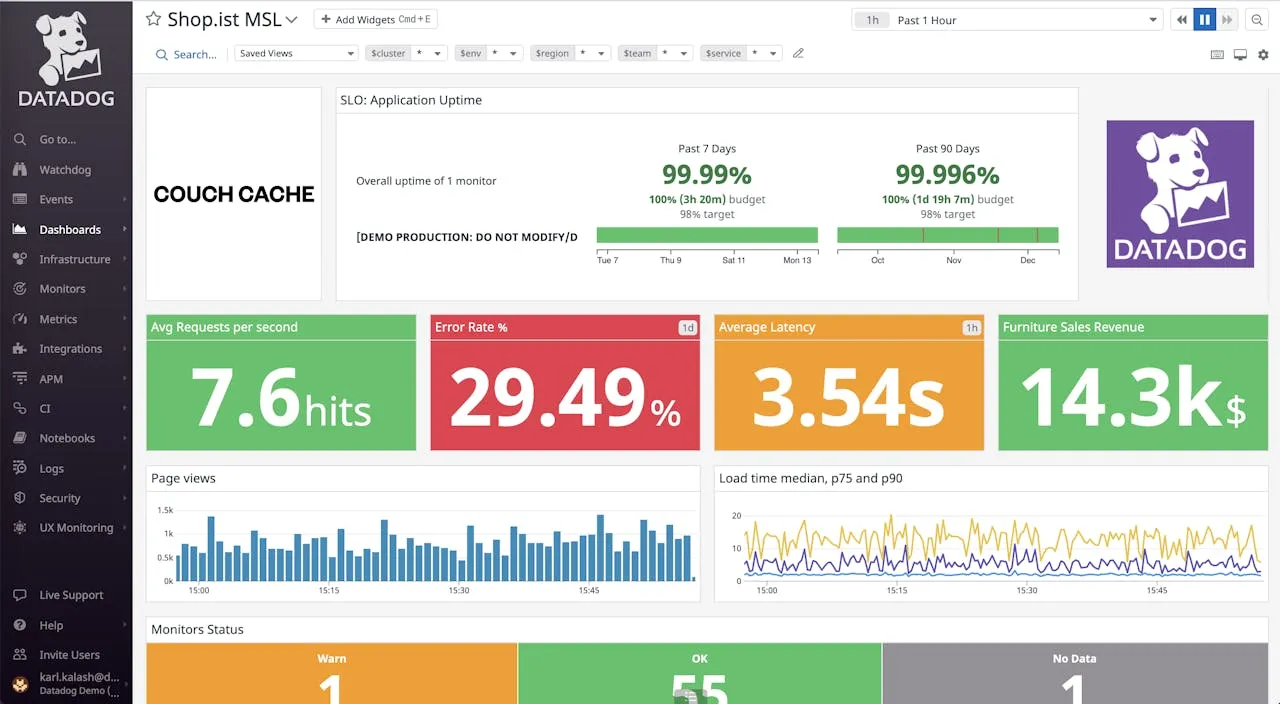
Datadog is the full observability platform on this list. It is the managed, cloud-native end of the spectrum from Icinga’s self-hosted model.
Key features
- Full-stack observability: Metrics, logs, and traces in one place.
- 400+ integrations: Broad cloud and SaaS coverage.
- Managed: No self-hosted infrastructure.
Pros
- Polished UI: Fast, intuitive, and cloud-native.
- Logs included: Solves the log gap Icinga leaves open.
Cons
- Expensive: Per-host plus per-feature billing.
- Vendor lock-in: Proprietary agent and data format.
Best for: Large teams that need full observability and a managed service.
Price Infrastructure starts at $15/host/mo. Logs, APM, and custom metrics billed separately.
7. Netdata
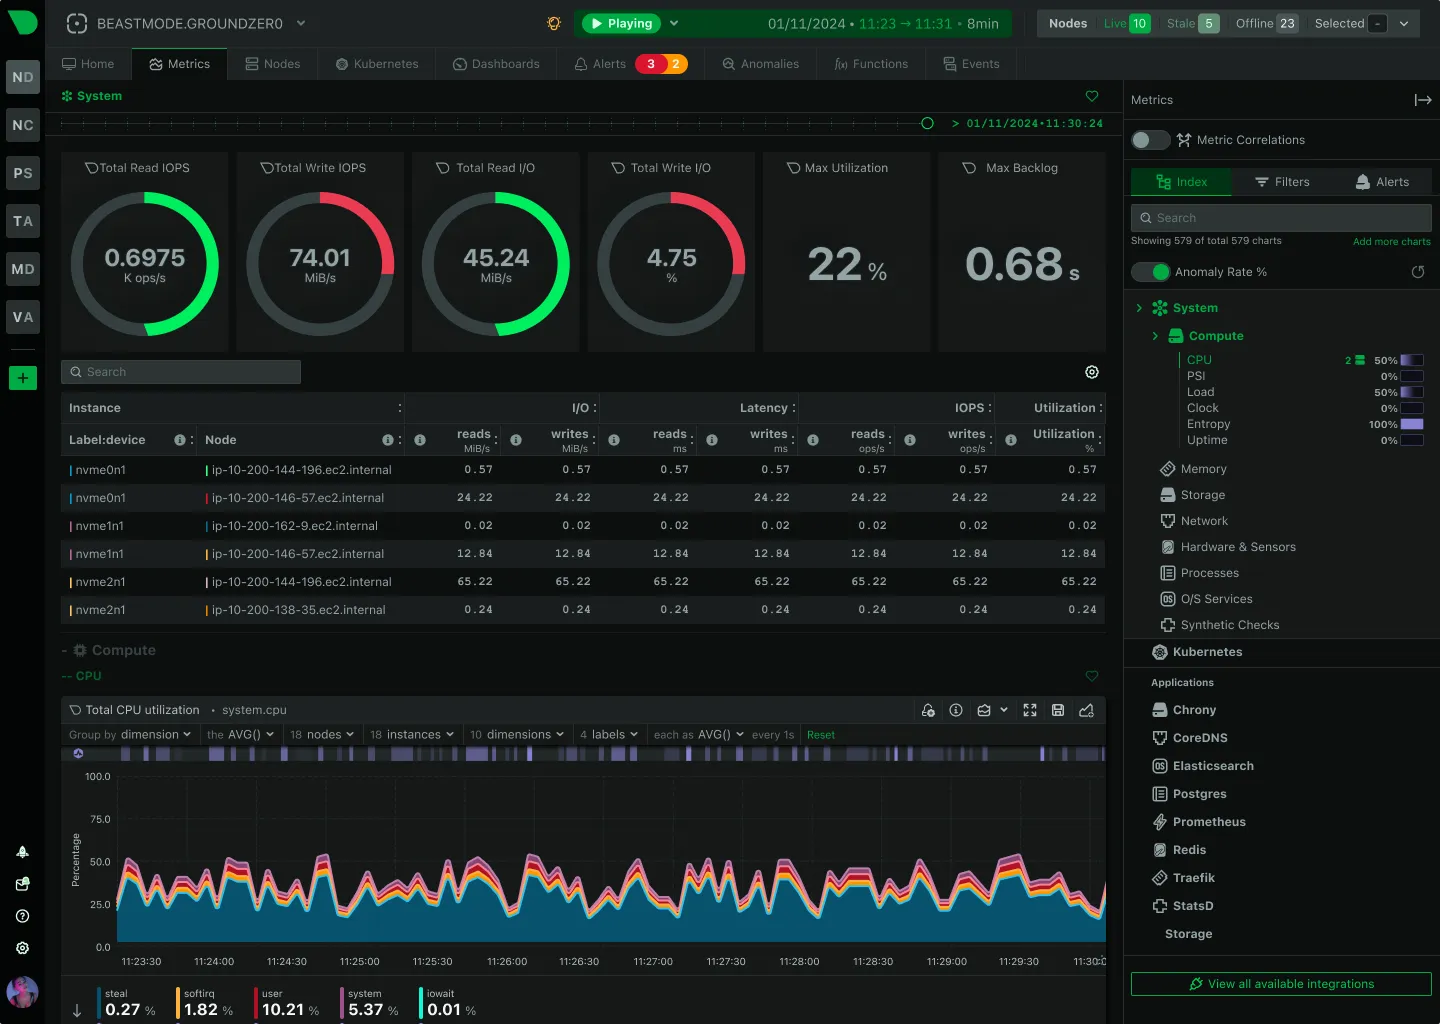
Netdata focuses on real-time, high-resolution single-node monitoring. It auto-detects everything on the host, the opposite of Icinga’s config-first approach.
Key features
- Real-time metrics: Second-level granularity.
- Unsupervised ML: Built-in anomaly detection.
- Auto-discovery: Automatically detects services and apps.
Pros
- Instant visibility: Hundreds of charts the moment you install.
- No config: Auto-detects everything, unlike Icinga’s manual objects.
Cons
- Scaling complexity: Fleet-wide aggregation needs more work than centralized tools.
- Higher resource usage: On-host ML costs CPU and RAM.
- Not state checks: It is metrics, not the OK/CRITICAL model.
Best for: Teams that want instant, high-resolution visibility with zero config.
Price Free for up to 5 nodes. Business plans start around $4.50/node/month.
8. SigNoz
SigNoz is an open-source observability platform built on OpenTelemetry and ClickHouse. It unifies metrics, logs, and traces, going beyond Icinga’s state-check model.
Key features
- Metrics, logs, and traces: All three pillars in one place.
- OpenTelemetry native: Broad language and framework support.
- ClickHouse backend: Fast queries at scale.
Pros
- Self-hostable: Keep data on your own infrastructure.
- Logs included: Solves the log gap Icinga leaves open.
Cons
- Newer project: Smaller community than Icinga or Zabbix.
- Self-hosting ClickHouse: Adds operational complexity of its own.
- Not Nagios-compatible: No Nagios plugin support.
Best for: Teams that want a self-hosted, open-source platform that unifies metrics and logs.
Price Self-hosted is free. SigNoz Cloud starts at $49/month (usage-based).
Conclusion
Icinga is a real upgrade over Nagios if you want a modern UI, an API, and distributed monitoring while keeping plugin compatibility. But it inherits the config DSL, the self-hosted infrastructure, and the state-check-first model, which is a lot to maintain.
- For zero-config and managed: Try Simple Observability. No DSL, no self-hosted stack, fixed price.
- For a broader open-source successor: Zabbix is the closest heavyweight.
- For cloud-native metrics: Prometheus + Grafana is the standard.
Choose based on whether you want to keep the Nagios model or leave it behind. For a head-to-head breakdown, see our Icinga comparison page, and for the Nagios angle, our Nagios alternative guide goes deeper.