
- OS monitoring watches the operating system layer: CPU, memory, disk, network, processes, services, and security logs.
- For OS visibility without a steep learning curve, Simple Observability is the simplest starting point.
- ManageEngine OpManager and Nagios XI cover deep, cross-platform OS monitoring for larger fleets.
- Domotz fits MSPs that need OS inventory and disk status across many distributed sites.
An operating system can fail quietly. CPU creeps toward 100%, a disk fills up overnight, a critical service stops, and the first sign is an outage report from a user. OS monitoring exists to surface those signals at the system layer before they reach your application.
The challenge is that teams run a mix of Windows, Linux, and Unix machines, and most tools cover only part of that picture or come with a steep setup cost. This guide breaks down what OS monitoring actually tracks and the tools that do it well. For Linux-specific guidance, see our Linux server monitoring and Ubuntu monitoring guides. For Windows, see our Windows monitoring guide.
What is OS monitoring?
OS monitoring is the practice of collecting and tracking metrics from the operating system layer of a server or device. It sits between hardware and your applications, watching the resources and services those apps depend on.
An unmonitored OS can degrade for hours before anything breaks at the app level. RAM may climb slowly because of a memory leak, or a disk may fill up from a runaway log. By the time requests start failing, the root cause is already buried in the system. Real-time OS monitoring catches these issues early, tracking performance, flagging resource exhaustion, and surfacing security events like failed logins so teams can act before users notice.
What to monitor on an operating system
OS monitoring focuses on a specific set of system-layer signals. The tools that rank for this query converge on the same categories.
Performance resources. CPU usage, memory utilization, disk space, and disk I/O are the foundation. Sustained CPU saturation slows every process. Running out of RAM triggers swapping and crashes. A full disk or overloaded I/O pipeline cripples the system silently. Most tools collect these every second or minute and alert when thresholds are crossed.
Processes and services. The OS runs many background services and processes, and their health is the base of system stability. Monitoring tracks service state (running, stopped) and per-process resource use, then alerts the moment a critical service dies or a process spins out of control.
Network and security. Network throughput and connection counts reveal both performance and security issues, from bandwidth spikes to possible data exfiltration. On the security side, OS monitoring watches event logs, failed login attempts, and unauthorized access, which matters for compliance as much as uptime.
Quick summary
| Tool | Best for | Pricing model |
|---|---|---|
| Simple Observability | Small teams wanting OS metrics and logs without setup overhead | Free tier, flat per-server plans |
| ManageEngine OpManager | Mixed Windows, Linux, and virtual environments | Free edition, paid per-device licensing |
| Nagios XI | Large fleets needing deep process and security monitoring | Commercial license per node |
| Domotz | MSPs monitoring many distributed devices | Per-device subscription |
OS monitoring tools
Simple Observability
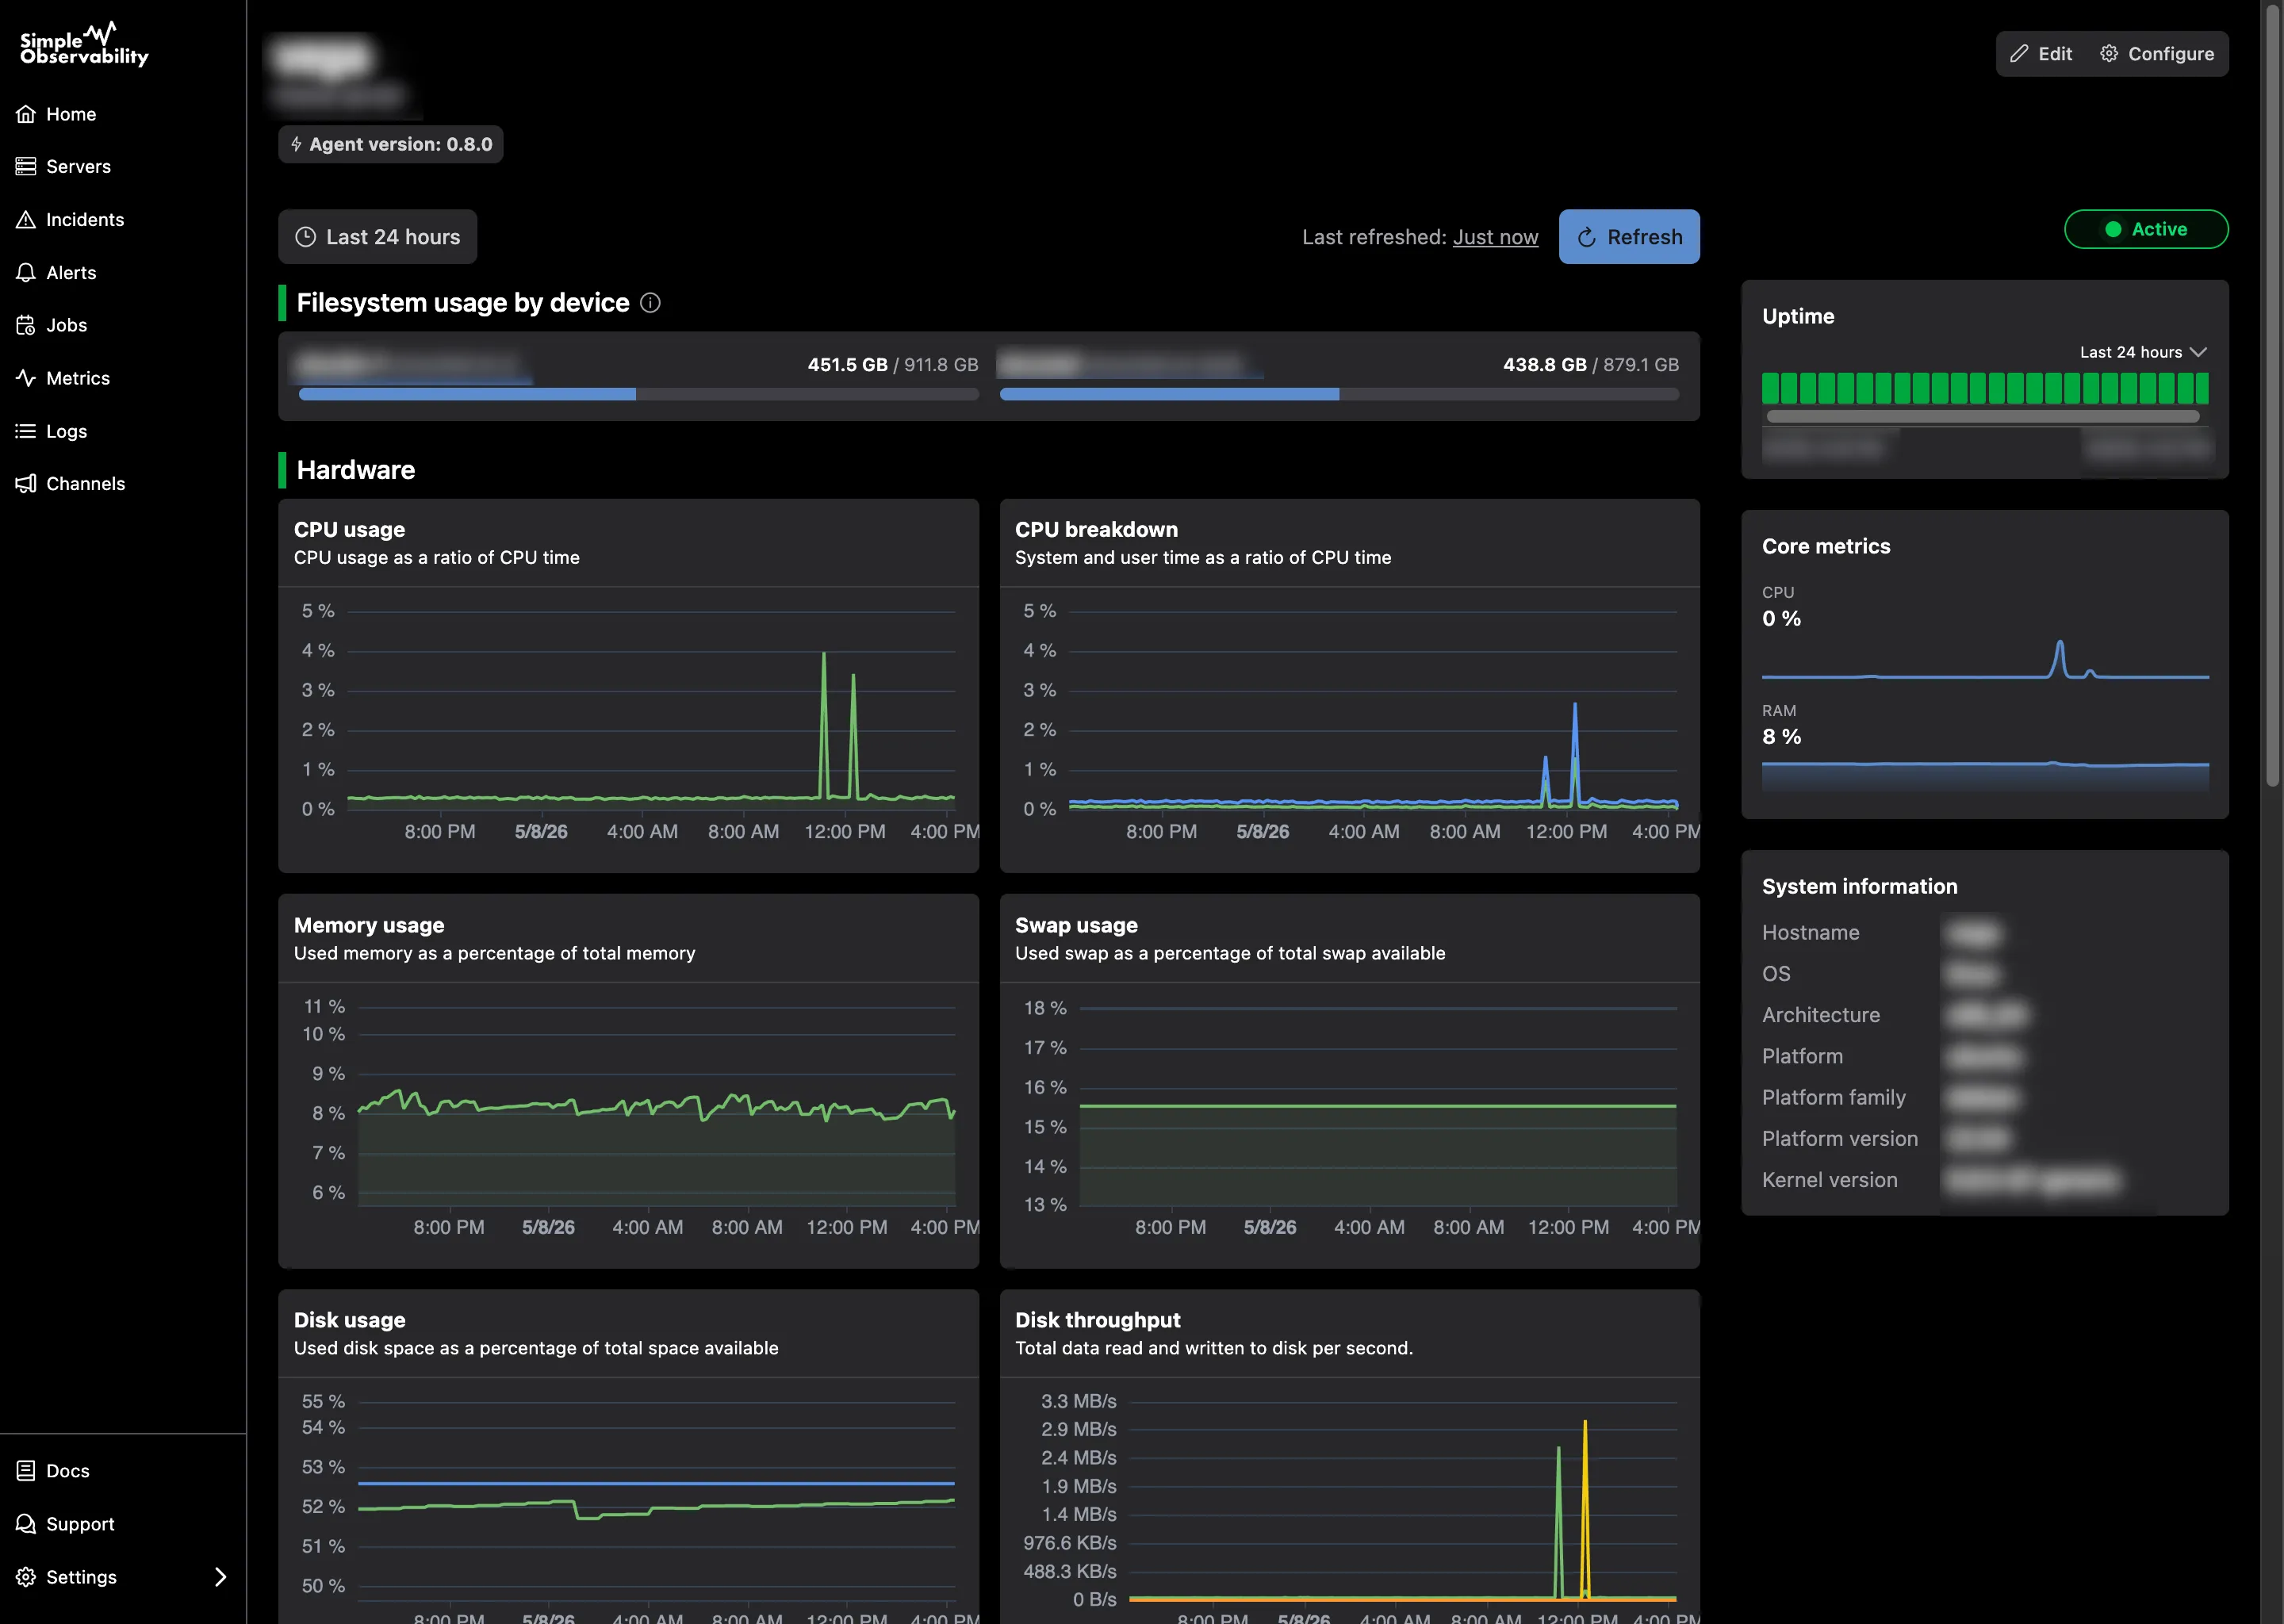
Simple Observability is a lightweight monitoring platform that collects OS-level metrics and logs through a single agent. It gives a unified view of server health without the configuration overhead typical of enterprise tools.
The open-source agent installs in one command and runs across Linux distributions. Metrics, logs, and alerts are configured from a web UI, so there are no config files to edit by hand.
Key features
- One-command agent install with metrics and logs in a unified view
- Web-based configuration for metrics, alerts, and dashboards
- Threshold alerts and ready-to-use reports out of the box
Pros
- Quick to set up, even for users new to monitoring
- Transparent, flat per-server pricing with no per-metric surprises
- Open-source agent that is auditable
Cons
- Less granular customization than enterprise suites for advanced users
Best for: small teams and solo operators who want OS visibility fast.
Price
- Free: one server, 50 metrics, low log volume
- Paid: $3/month per server, 100 metrics per server, high log volume, unlimited servers
- Custom: volume discounts and custom retention for large infrastructures
See your OS metrics in minutes with a single agent. No config files, no per-metric billing.
ManageEngine OpManager
ManageEngine OpManager is an agentless OS monitoring tool that covers Windows, Linux, and virtual environments through SNMP and WMI. It is built for server administrators who manage a mix of operating systems and want a single consolidated view.
On Windows it monitors services, processes, event logs, and components like Active Directory and Exchange. On Linux it tracks resource utilization, workload, memory, disk, and process counts. Virtual hosts such as VMware, Hyper-V, and Citrix Xen are monitored alongside their VMs.
Key features
- Agentless monitoring via SNMP and WMI across Windows, Linux, and VMs
- Windows service, process, and event log monitoring
- Customizable dashboard with 100+ widgets and workflow automation
Pros
- Broad OS and virtualization coverage from one console
- Agentless collection lowers deployment friction on Windows
- Strong fit for mixed enterprise environments
Cons
- Interface and licensing can feel complex for small teams
- Full value unlocks only in paid editions beyond the free tier
Best for: mid-to-large teams managing mixed Windows, Linux, and virtual infrastructure.
Price
- Free edition for small fleets, with paid editions licensed per device on tiered plans
Nagios XI
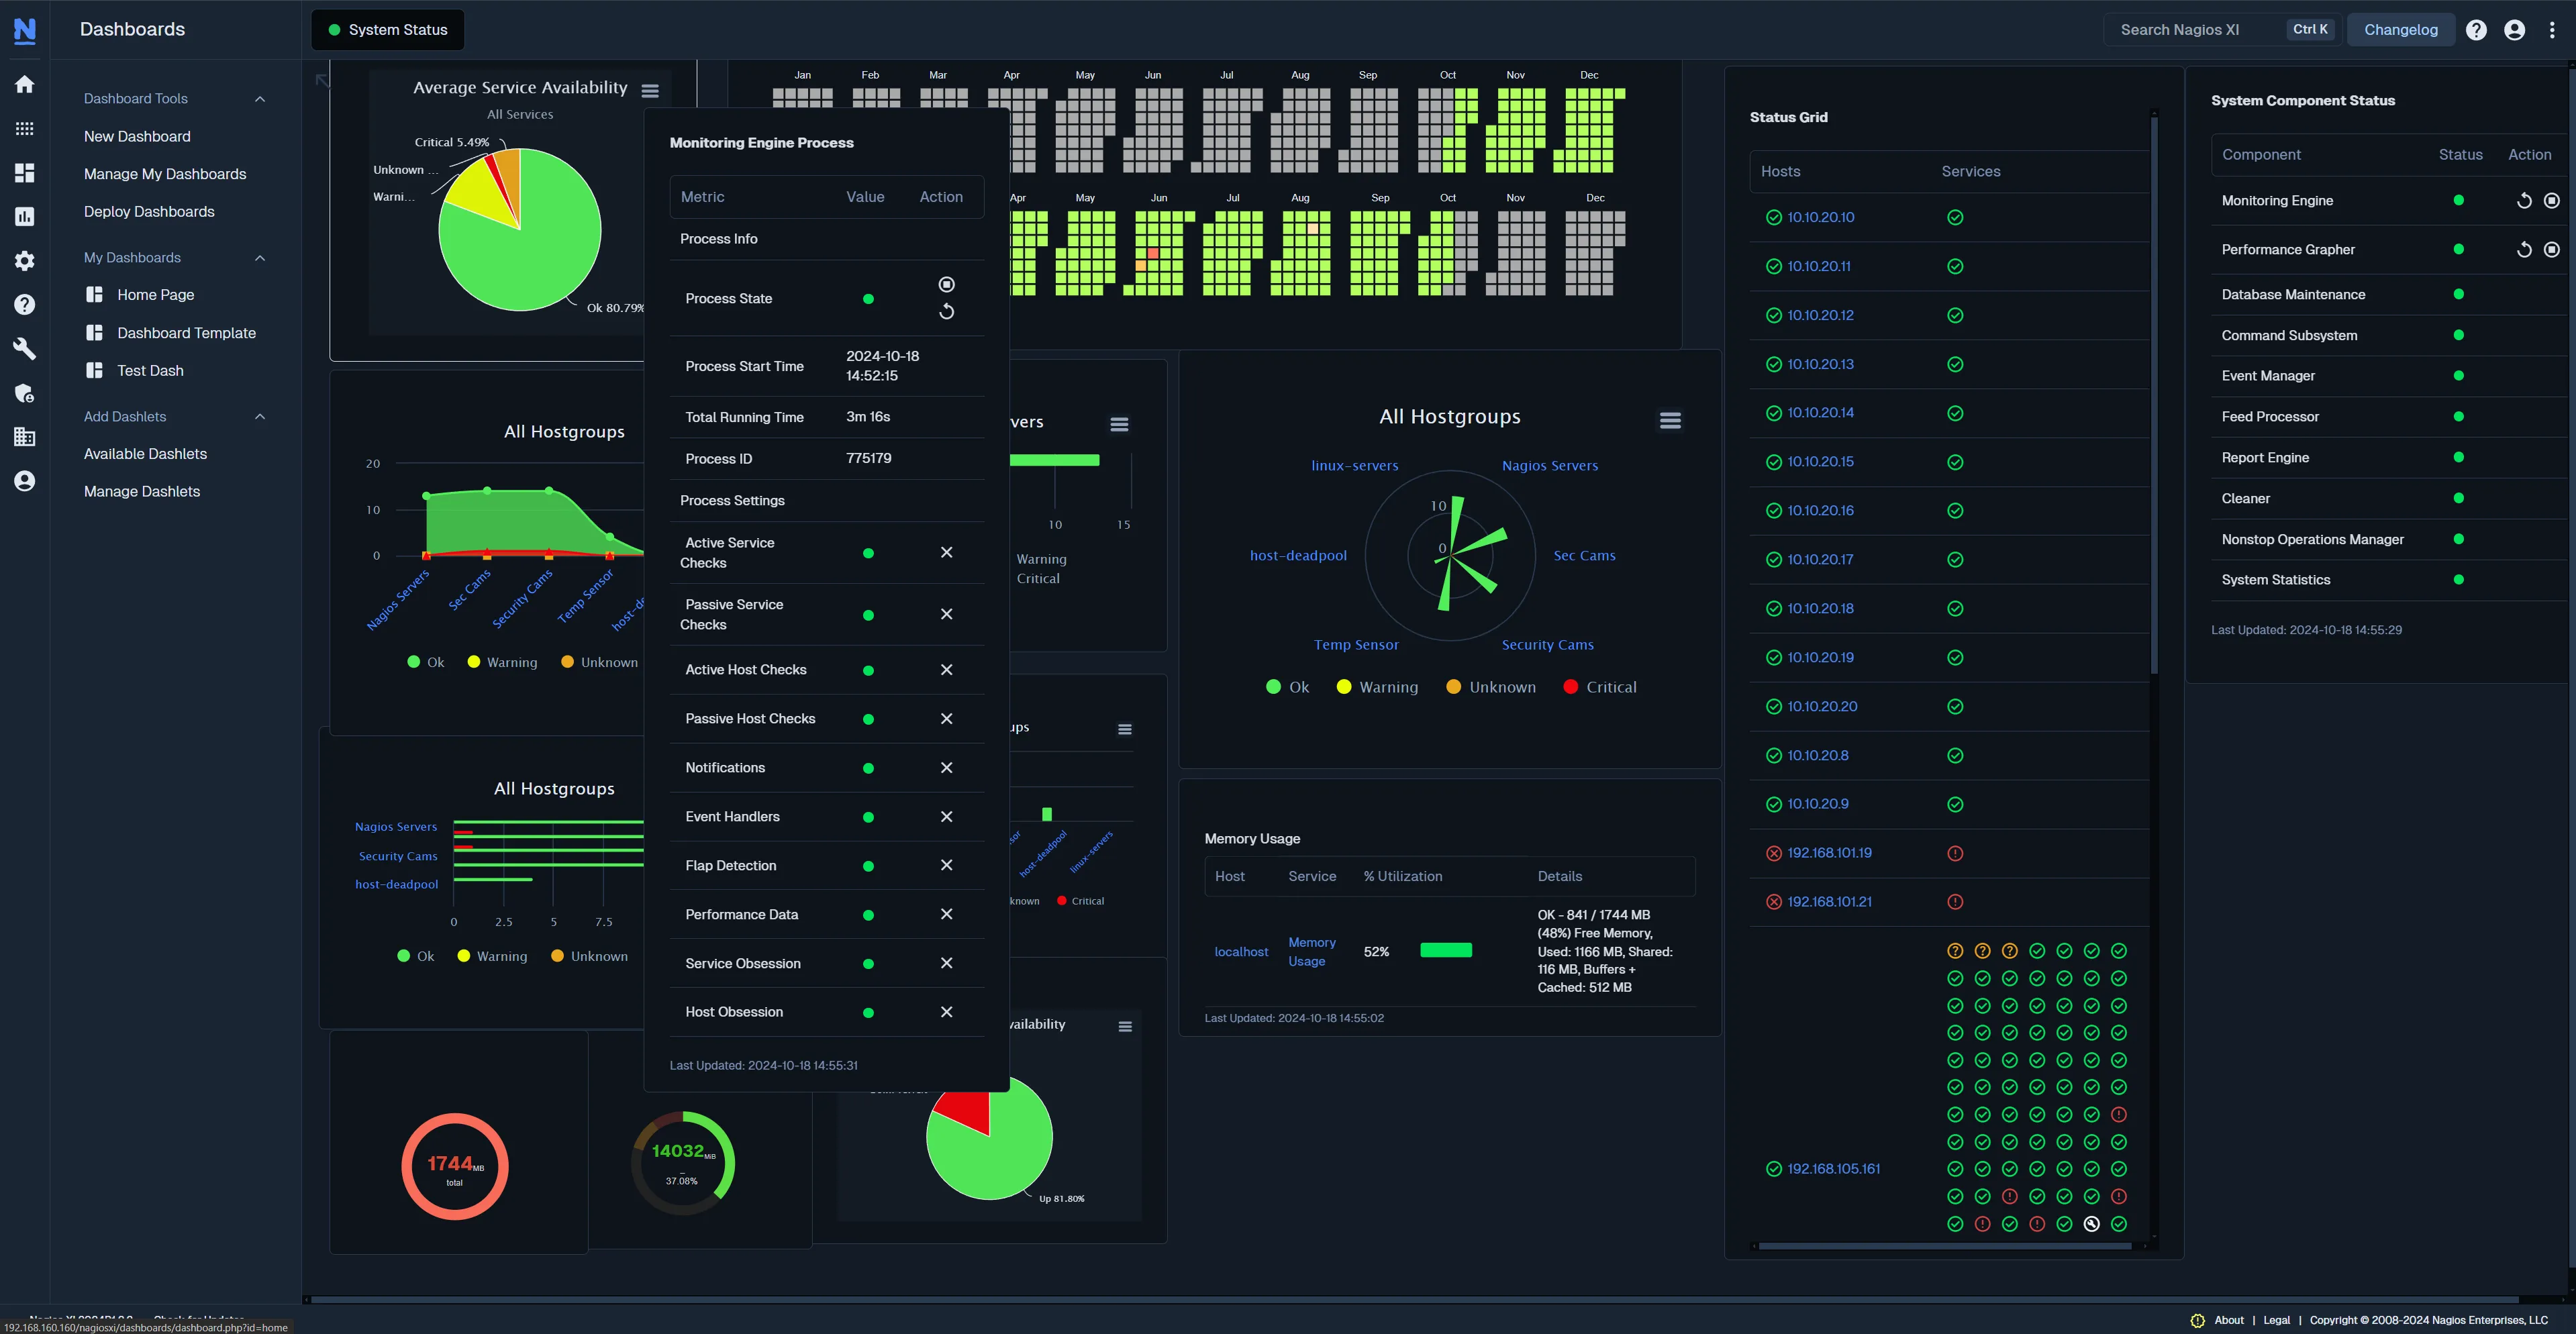
Nagios XI is an enterprise monitoring platform that tracks OS performance, processes, services, and security across Windows, Linux, macOS, and Unix. It is built for large, distributed fleets that need reliable alerting and high scalability.
Its OS monitoring covers CPU load, memory, disk I/O, process and service state, and security events like failed logins. A large plugin ecosystem and configuration wizards let teams extend monitoring to almost any system component.
Key features
- Real-time CPU, memory, disk, process, and service monitoring across platforms
- Security and compliance tracking through event logs and login monitoring
- Extensible through plugins, APIs, and configuration wizards
Pros
- Highly flexible and scalable for large, distributed environments
- Strong, predictable alerting and escalation rules
- Broad platform and plugin support
Cons
- Setup and configuration take time to master
- Web UI feels dated next to newer tools
- Commercial licensing is a significant investment at scale
Best for: large organizations that need deep, customizable OS and security monitoring at scale.
Price
- Nagios XI commercial licensing starts at $2,495 for a 100-node license
Domotz
Domotz is an agent-native network monitoring platform aimed at MSPs and IT teams managing many distributed sites. Its OS monitoring feature extracts operating system details, disk status, and inventory from devices over SSH or WinRM.
Rather than deep performance metrics, Domotz pulls OS name, version, architecture, serial number, build number, and disk information such as BitLocker status. It works across Windows, macOS, Linux, VMware ESXi, Dell iDRAC, HP iLO, and Raspberry Pi OS, fitting teams that monitor networks and endpoints together.
Key features
- OS inventory and disk status collected over SSH or WinRM
- Coverage across Windows, macOS, Linux, ESXi, iDRAC, and iLO
- Unified with network monitoring across multiple sites
Pros
- One platform for network, device, and OS inventory across sites
- Simple per-device pricing that scales predictably for MSPs
- Fast deployment across distributed locations
Cons
- OS monitoring focuses on inventory and disk status, not deep performance metrics
- Less suited for teams that need granular CPU, memory, or process alerting
Best for: MSPs and IT teams that want OS inventory and disk status alongside network monitoring.
Price
- $1.50 per device, with a 14-day free trial
How to choose an OS monitoring tool
Choosing an OS monitoring tool comes down to four questions.
Which operating systems do you run? If your fleet is mixed Windows, Linux, and Unix, pick a tool with confirmed cross-platform support. ManageEngine and Nagios cover all three, while lighter tools may focus on Linux.
Do you need performance metrics or inventory? Some teams need per-second CPU, memory, and process alerts. Others, especially MSPs, mainly need OS version, disk, and inventory data across devices. Domotz serves the second case, while Simple Observability, ManageEngine, and Nagios serve the first.
Agent or agentless? Agentless collection through SNMP or WMI lowers deployment friction but reaches fewer metrics. An agent gives deeper, more reliable data but must be installed and maintained on every host.
How does pricing scale? Per-server flat pricing stays predictable as you grow. Per-device or per-node licensing fits MSPs but can climb fast in large fleets. Match the model to how your infrastructure actually expands.
Conclusion
The right OS monitoring setup catches system-level problems before they reach your application. For most small teams, that means a lightweight agent that reports CPU, memory, disk, processes, and services without a steep setup curve, which is where Simple Observability fits. Larger or mixed-environment teams get more from ManageEngine OpManager or Nagios XI, while MSPs managing many sites often prefer Domotz for its combined network and OS inventory coverage. Start with the metrics that matter to your operating system, then pick the tool whose depth and pricing match your fleet.