


Windows Server remains a cornerstone of IT infrastructure for thousands of businesses. Whether you are running a legacy legacy application, a modern .NET environment, or a critical database, ensuring your Windows servers are healthy is not optional. It is the difference between a restful night and an emergency 2 a.m. troubleshooting session.
In 2026, the landscape of Windows monitoring has evolved. We have moved beyond basic uptime checks. Modern teams require deeper visibility into system performance, security signals, and application logs. However, Windows monitoring often feels like a choice between two extremes. On one side, you have built-in Microsoft tools that are powerful but fragmented. On the other, you have enterprise observability platforms that are prohibitively complex and expensive.
This guide aims to fill that gap. We will explore the fundamental principles of Windows monitoring, the specific metrics you should track, and the tools that help you do it effectively without the enterprise overhead. Understanding why server monitoring matters is the first step toward building a reliable infrastructure.
What is Windows monitoring?
Windows monitoring is the continuous process of collecting and analyzing data from your Windows operating system and the applications running on top of it. It involves observing the physical and virtual resources of the server to ensure they are operating within expected parameters.
A common mistake is thinking of monitoring as just a dashboard. In reality, effective Windows monitoring consists of three layers.
Infrastructure metrics
These are the numeric values that represent the “vital signs” of your hardware or VM. Think of CPU utilization, memory pressure, and disk latency. These are usually collected via Performance Counters (PerfMon).
Event logs
Windows records almost everything that happens in the system within Event Logs. This includes service start/stop events, application crashes, security logins, and system errors. If metrics tell you when a problem occurred, logs tell you why it happened.
Application health
This layer focuses on the software your users actually care about. Is IIS responding to requests? Is the SQL Server buffer cache hit ratio healthy? Monitoring the application layer ensures that even if the server is “up,” the service is actually working.
Why Windows is different from Linux monitoring
If you are coming from a Linux background, Windows monitoring can feel unfamiliar. In Linux, “everything is a file,” and you often collect metrics by reading text files in /proc.
Windows uses a more structured approach. Nearly all performance data is exposed through the Performance Counter system. Accessing this data traditionally required specialized APIs or WMI (Windows Management Instrumentation). While WMI is powerful, it is also notoriously resource-heavy. Modern monitoring tools in 2026 focus on using more efficient methods like the Performance Counters API or specialized exporters.
Performance counters vs. WMI
When you start monitoring Windows, you will likely encounter two main ways of getting data: Windows Management Instrumentation (WMI) and the Performance Counter system. Understanding the difference is key to keeping your server performant.
| Feature | Windows Management Instrumentation (WMI) | Performance Counters |
|---|---|---|
| What it is | Infrastructure for managing OS data and operations. | Mechanism for high-frequency data collection. |
| Visibility | Almost anything (serial numbers, CPU temperature). | Numeric values updated in memory in real-time. |
| Overhead | Known for high CPU overhead; can cause performance issues. | Significantly “cheaper” and much more efficient to query. |
Most modern monitoring agents prefer the Performance Counter API for tracking metrics like CPU and Disk usage, reserving WMI only for static information that does not change often, like the OS version or the total physical RAM installed.
# Get a list of available processor performance counters
Get-Counter -ListSet Processor | Select-Object -ExpandProperty Counter

# Query real-time CPU utilization Every 1 second
Get-Counter -Counter "\Processor(_Total)\% Processor Time" -SampleInterval 1 -MaxSamples 5
What to monitor in Windows
The sheer volume of data Windows can export is staggering. If you try to monitor everything, you will end up with a wall of noise. For most environments, you should focus on the following core areas.
CPU performance and bottlenecks
CPU usage is the most visible metric, but it is often a lagging indicator. You need to look deeper than just a percentage.
| Metric | Description | Critical Threshold |
|---|---|---|
| % Processor time | Basic utilization. | > 80% consistently |
| Processor queue length | Threads waiting for CPU. | > 2x number of cores |
| Context switches/sec | CPU overhead managing threads. | High/unusual spikes |
Memory and resource pressure
Windows is aggressive about using RAM for caching. Seeing high memory usage is not always a bad sign, but seeing memory pressure is.
| Metric | Description | Risk |
|---|---|---|
| Available MBytes | Physical memory left for OS/Apps. | < 5-10% of total RAM |
| Pages/sec | Hard page faults (disk swapping). | High rates kill performance |
| Committed bytes | Total virtual memory promised. | Approaching RAM + Page file |
Disk I/O and latency
Disk performance is the most common cause of “silent” slowness. A server can have a 0% CPU load but feel completely unresponsive because the disk subsystem is overwhelmed.
| Metric | Description | Target |
|---|---|---|
| Avg. Disk sec/Read & Write | Measures latency in seconds. | < 10ms (Excellent), > 50ms (Bottleneck) |
| % Disk time | Percentage of time disk is busy. | High sustained use is risky |
| Disk queue length | I/O requests waiting for disk. | Correlate with high latency |
Network throughput and health
| Metric | Description | Target |
|---|---|---|
| Bytes total/sec | Basic bandwidth usage. | Identify spikes/transfers |
| Output queue length | Packets waiting to be sent. | Should be 0 |
| Packets received errors | Corrupted or failed packets. | Should be 0 |
Monitoring Windows services and processes
Beyond the core hardware metrics, you must ensure that your critical background processes are actually running. Windows uses “Services” to manage everything from your web server (IIS) to your database (SQL Server).
# Check the status of a specific service (e.g., World Wide Web Publishing Service)
Get-Service -Name W3SVC

# List all services that are set to start automatically but are currently stopped
Get-Service | Where-Object { $_.StartType -eq 'Automatic' -and $_.Status -eq 'Stopped' }- Service health: You should monitor the state of any service required for your application to function. A service that is set to “Automatic” but is currently “Stopped” is a clear signal of an issue, likely a crash or a failed dependency.
- Process working set: This measures the amount of physical memory currently being used by a specific process. If a specific application’s working set keeps growing without ever dropping, you have a memory leak.
- Handle count per process: A “handle” is a reference to a system resource (like a file or a registry key). If a process’s handle count increases continuously, it is failing to release resources, which will eventually lead to system-wide instability.
- User input delay: In Remote Desktop (RDS) environments, monitoring the delay between a user’s input and the application’s response is critical for understanding the actual user experience, which hardware metrics might miss.
Windows event logs
Metrics give you the “what,” but Event Logs give you the “who” and “how.” You should focus on these four main logs:
- System log: Critical for hardware issues, driver failures, and OS-level errors.
- Application log: Where your software (and third-party apps) records its errors and warnings.
- Security log: Essential for auditing. You should watch for failed logins, account lockouts, and changes to administrative groups.
- Setup log: Useful during updates and new software installations.
# Get the 10 most recent error events from the System log
Get-WinEvent -LogName System -MaxEvents 10 | Where-Object { $_.LevelDisplayName -eq "Error" }

# List all 'Critical' events in the last 24 hours
Get-WinEvent -FilterHashtable @{LogName='System'; Level=1; StartTime=(Get-Date).AddDays(-1)}
In 2026, you should not be manually scrolling through these logs in Event Viewer. You need a way to centralize and alert on specific “Error” or “Critical” level events.
Common approaches and tools
Choosing a monitoring tool for Windows depends on the size of your environment and the level of complexity you are willing to manage. Here are the most common approaches used by teams today.
Microsoft native tools (Sysinternals and PerfMon)
Microsoft provides powerful tools out of the box. Performance Monitor (PerfMon) is the standard for real-time and historical metric analysis on a single machine. For deep troubleshooting, the Sysinternals suite (including Process Monitor and Process Explorer) is indispensable.
- Who it is for: Ad-hoc troubleshooting and deep-dive analysis of specific performance issues.
- Pros: Free, built-in (or easily downloadable), and extremely detailed.
- Cons: No centralized alerting or historical storage across multiple servers. It is a manual, one-server-at-a-time approach.
Open-source stacks (Prometheus and Grafana)
The most popular open-source approach in 2026 is using the windows_exporter to collect metrics and send them to a Prometheus server, with Grafana for visualization.
- Who it is for: Teams comfortable managing their own Linux-based monitoring infrastructure to monitor their Windows fleet.
- Pros: Highly customizable, huge ecosystem, and no licensing costs for the software.
- Cons: Significant operational burden. You have to manage the exporters, the Prometheus server, and the Grafana dashboards. Setting up Windows-specific alerts requires deep knowledge of the exporter’s metrics.
Simple Observability
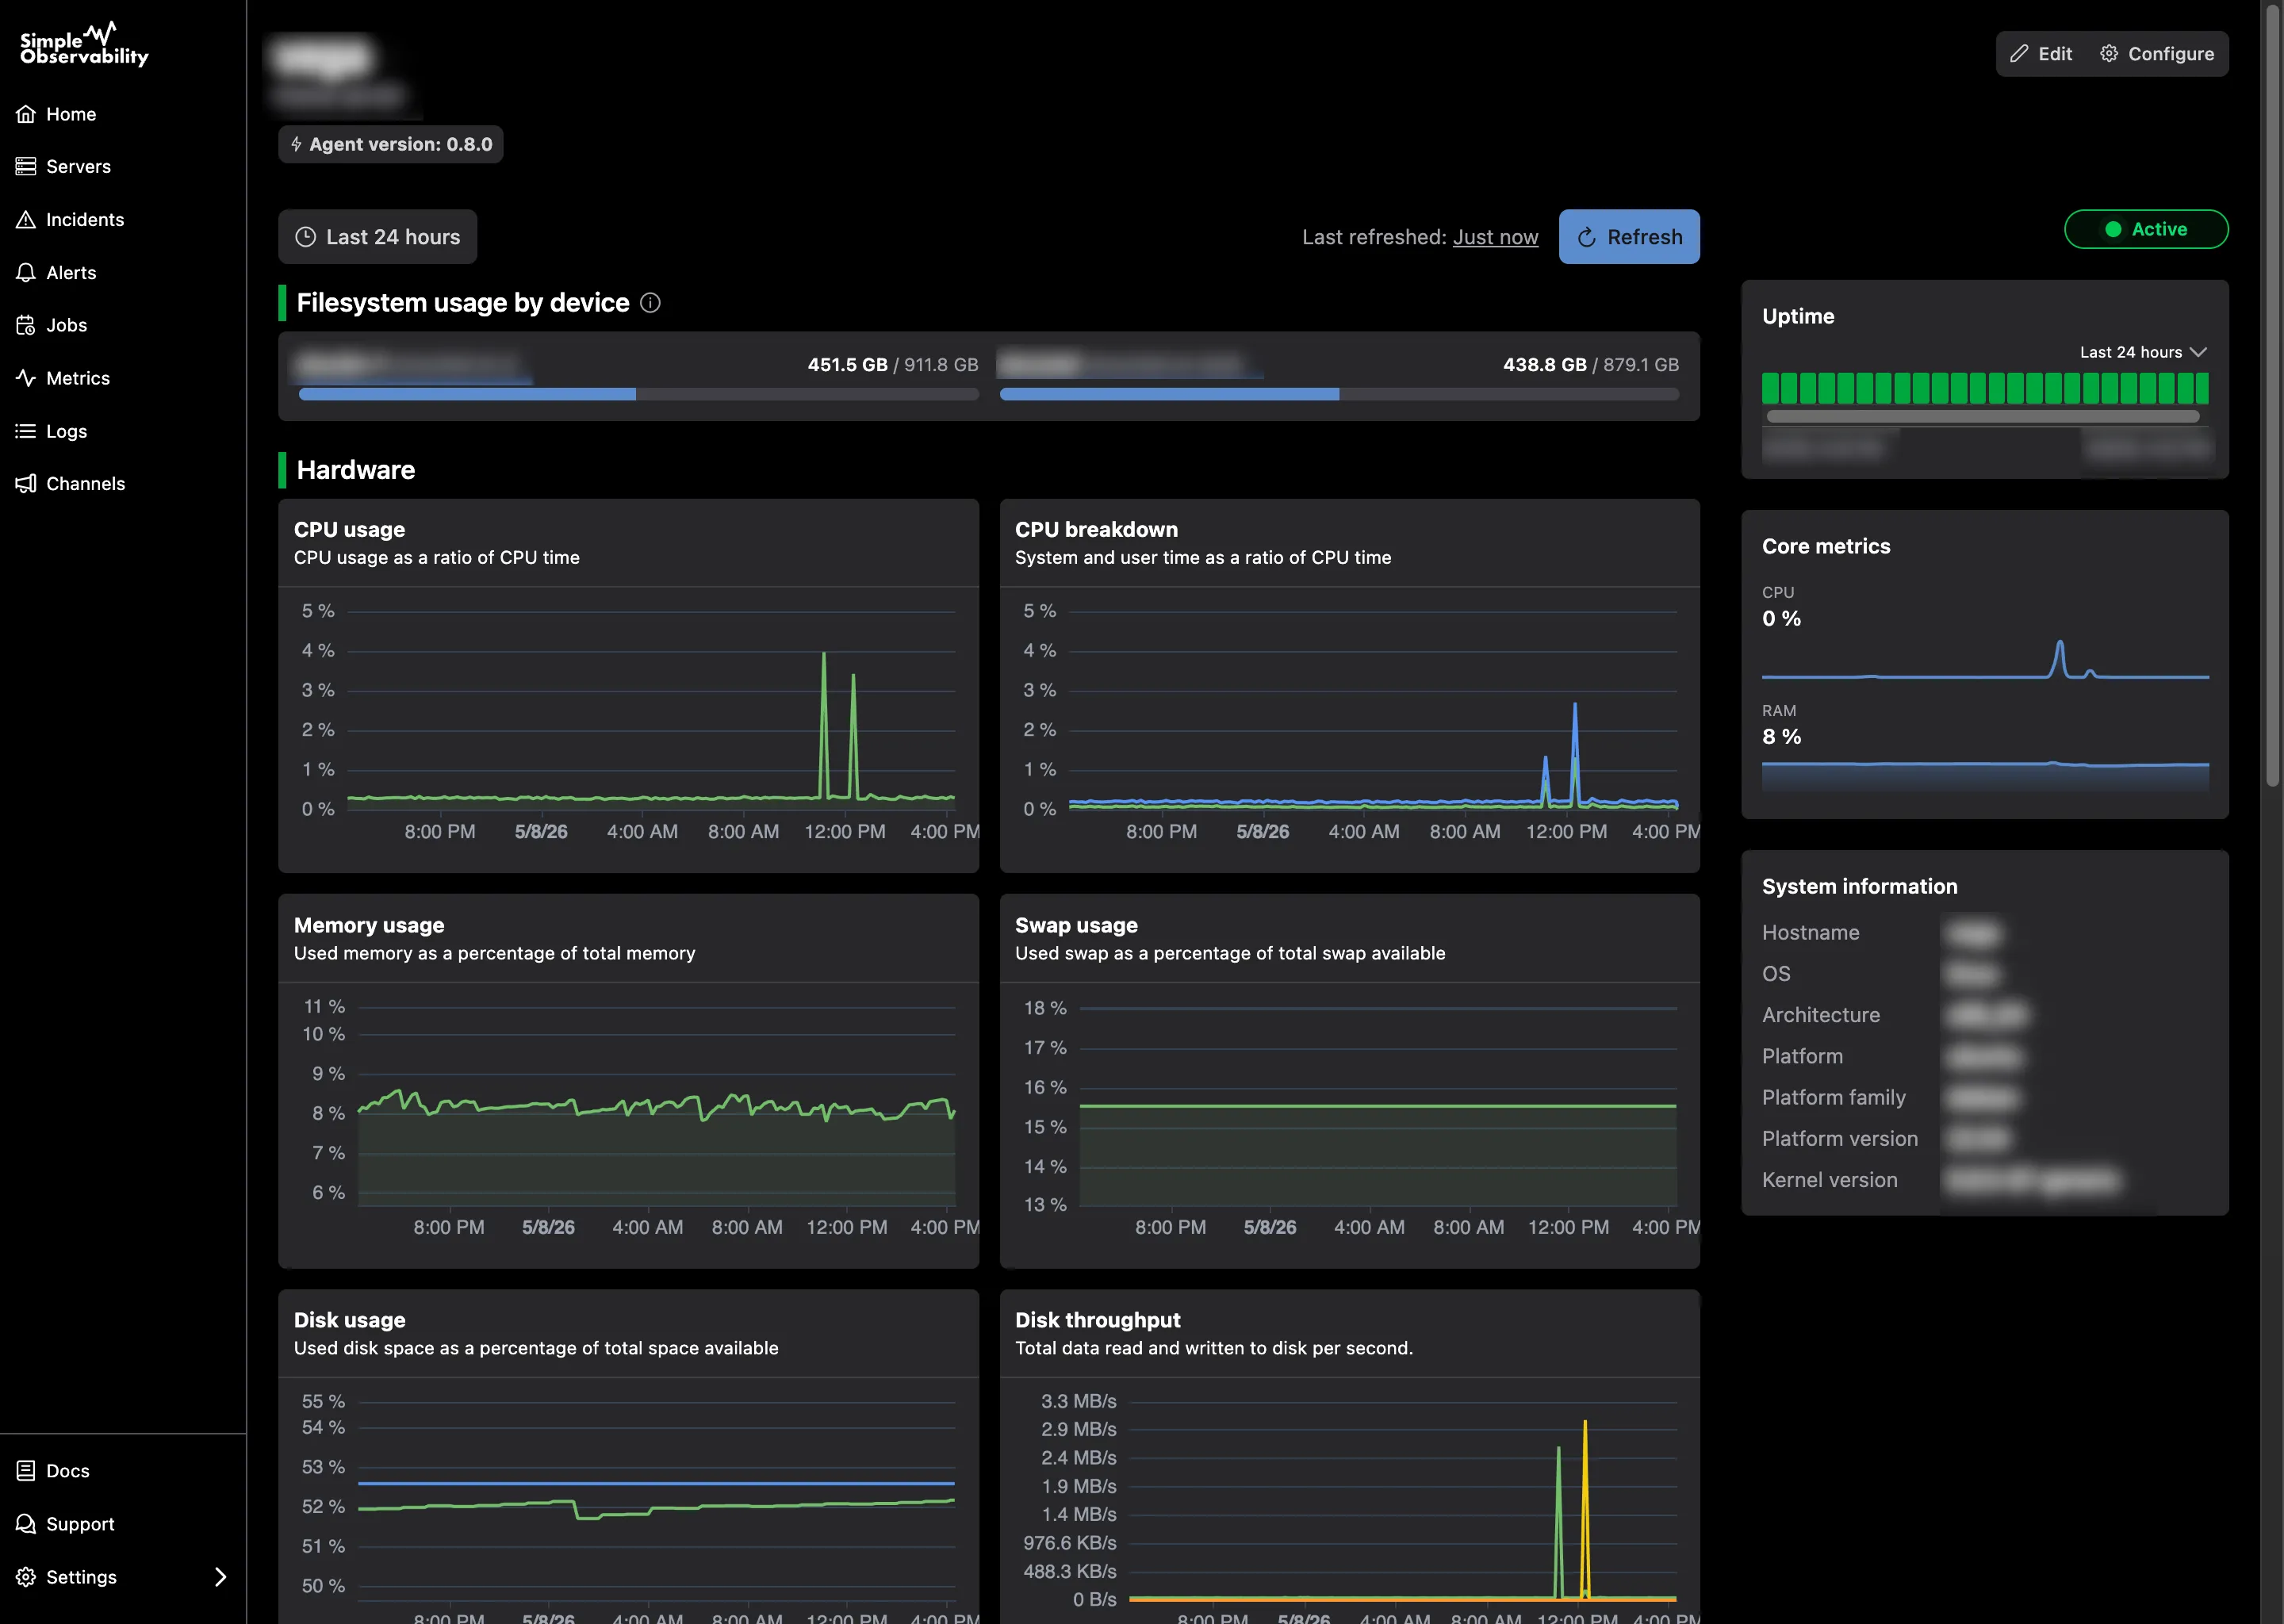
Simple Observability offers a lightweight, unified approach to monitor metrics, logs, and alerts on Windows servers without the complexity of traditional stacks. It is designed to be a “set and forget” solution for teams who might find our Windows product page informative but are looking for a deeper educational guide first. Many teams looking for Netdata alternatives for Windows find this unified approach particularly valuable.
- Who it is for: Sysadmins and developers who want production-grade visibility across multiple servers with a one-command setup.
- Pros: Combines metrics and event logs in one UI, automatic setup of critical Windows alerts, and very low resource footprint.
- Cons: Not intended for enterprises with thousands of servers and ultra-specialized niche requirements.
Enterprise platforms (Zabbix, SolarWinds, Dynatrace)
These are the “big hitters” of the monitoring world. They offer everything from asset management to AI-driven anomaly detection. However, many teams are looking for Zabbix alternatives because of the sheer complexity and cost of these platforms.
- Who it is for: Large enterprises with massive, heterogeneous environments.
- Pros: Comprehensive features and professional support.
- Cons: Expensive licensing, steep learning curve, and often requires a dedicated team just to manage the monitoring tool itself.
Comparison of Windows monitoring tools
| Tool | Type | Complexity | Best for… |
|---|---|---|---|
| PerfMon | Native Tool | Low | Quick local debugging |
| Prometheus | Open Source | High | Custom, DIY fleets |
| Simple Observability | SaaS/Unified | Low | Small-to-mid teams |
| Zabbix | Enterprise | High | Large scale environments |
| Datadog | SaaS/APM | Medium | Full-stack observability |
Best practices for Windows monitoring
Setting up a tool is only the first step. To ensure your monitoring is actually useful, you should follow these industry best practices.
One of the biggest mistakes teams make is setting up too many alerts. If you get an email every time a CPU spikes to 90% for a few seconds, you will soon start ignoring your inbox. This is “alert fatigue.”
Instead, focus on sustained issues. Set your alerts to fire only when a metric stays above a threshold for a specific duration (e.g., 5-10 minutes). For Windows specifically, ensure you are alerting on “Critical” and “Error” events in the System and Application logs, but filter out the “Information” noise.
Establish a performance baseline
You cannot know if your server is performing poorly if you do not know what “normal” looks like. After setting up your monitoring, spend a week observing the metrics. What is the typical CPU load during business hours? How much RAM is usually free? Use this data to set realistic alert thresholds rather than relying on generic defaults.
Use lightweight agents
Windows servers are often resource-constrained. Avoid monitoring tools that use heavy Java-based agents or rely heavily on WMI. Look for agents written in performant languages like Go or Rust that have a minimal impact on the host system’s CPU and memory. We believe that lightweight is a metric, not just an adjective, and we prioritize efficiency in every component.
Combine metrics and logs
Never monitor metrics in a vacuum. A spike in CPU usage means very little if you cannot correlate it with an error in the Event Log. A unified approach, where you can see your graphs and your logs on the same timeline, will reduce your “Mean Time to Resolution” (MTTR) significantly.
Monitor from the outside-in
Internal metrics tell you if the server is healthy, but they do not tell you if your users can actually reach your application. Always combine your internal Windows monitoring with external uptime checks. This ensures that even if the server is “green,” you are alerted if a firewall change or a DNS issue breaks connectivity.
Conclusion
Windows monitoring in 2026 does not have to be a choice between “complex” and “incomplete.” By focusing on the core signals, specifically the CPU queues, memory pressure, disk latency, and critical event logs, you can build a robust monitoring strategy that scales with your needs.
Whether you choose to build a custom stack with Prometheus, use the built-in Microsoft tools for local debugging, or opt for a unified platform like Simple Observability, the key is to move from reactive troubleshooting to proactive management.
For teams looking for a ready-to-use Windows monitoring solution, Simple Observability offers a one-command setup and unified metrics + logs. It allows you to spend less time managing your monitoring and more time managing your infrastructure.