
NGINX acts as the “front door” of your infrastructure, but it doesn’t come with built-in dashboards. To monitor it effectively, you typically rely on two native signals: the stub_status module for real-time saturation metrics, and access logs for request-level latency tracking. This guide covers how to configure both.
What NGINX exposes natively for monitoring
Before you reach for a monitoring tool, you must understand the three primary surfaces through which NGINX exposes its internal state. These surfaces differ in their granularity, the type of data they provide, and how they are consumed by external systems.
- Status Endpoints: These provide real-time, global counters. They are updated in memory and are extremely lightweight to query. They are best for tracking the overall “saturation” of the NGINX instance.
- APIs (NGINX Plus): Available only in the commercial version, these APIs provide high-resolution JSON data. They allow for per-service, per-upstream, and per-cache visibility that isn’t available in the open-source version.
- Logs: This is where the most granular data lives. Access logs record every single interaction between a client and NGINX, while error logs record internal issues. Logs are the only source of truth for request-level latency and individual status codes.
It’s important to distinguish between the two versions of NGINX: NGINX Open Source (OSS) and NGINX Plus. While NGINX OSS is the foundation of the internet, its native monitoring capabilities are intentionally focused on global metrics. NGINX Plus offers significantly more depth through its dynamic API, which is essential for large-scale environments requiring precise telemetry for hundreds of different services.
In the following sections, we will dive deep into how to leverage these surfaces, starting with the ubiquitous stub_status module.
Monitoring NGINX with stub_status
The stub_status module is the primary (and often only) source of real-time metrics for NGINX Open Source. It provides a simple, plain-text output that reveals the internal connection state of your server.
What is stub_status?
The ngx_http_stub_status_module tracks a small set of global counters that measure the load on the server and the state of its worker processes. It doesn’t look at individual requests; instead, it looks at the connections that those requests travel over. While it doesn’t offer per-virtual-host or per-route metrics, it’s vital for understanding if your NGINX instance is becoming saturated or if there’s a problem with the connection lifecycle.
How to enable stub_status
To use stub_status, it must be enabled in your configuration. Most package-managed versions of NGINX include this module by default.
Configuration Example
You should create a dedicated location block. For security, it’s critical to restrict access. Exposing your status metrics to the public internet is a security risk as it can reveal traffic patterns to attackers.
server {
    listen 127.0.0.1:80;
    server_name localhost;

    location /nginx_status {
        stub_status;
        allow 127.0.0.1;   # Allow local access
        allow ::1;         # Allow local IPv6 access
        deny all;          # Deny everyone else
    }
}
This configuration block usually goes into a separate file in /etc/nginx/sites-enabled/ or directly inside the http block of nginx.conf.
Applying the Changes
After updating your configuration, always validate the syntax before reloading to prevent downtime:
sudo nginx -tIf the test is successful, reload NGINX. This signals the master process to start new worker processes with the new configuration and gracefully shut down old ones:
sudo systemctl reload nginxTesting and Understanding Output
You can verify the endpoint is working using curl:
curl http://127.0.0.1/nginx_statusThe output is minimalist by design:
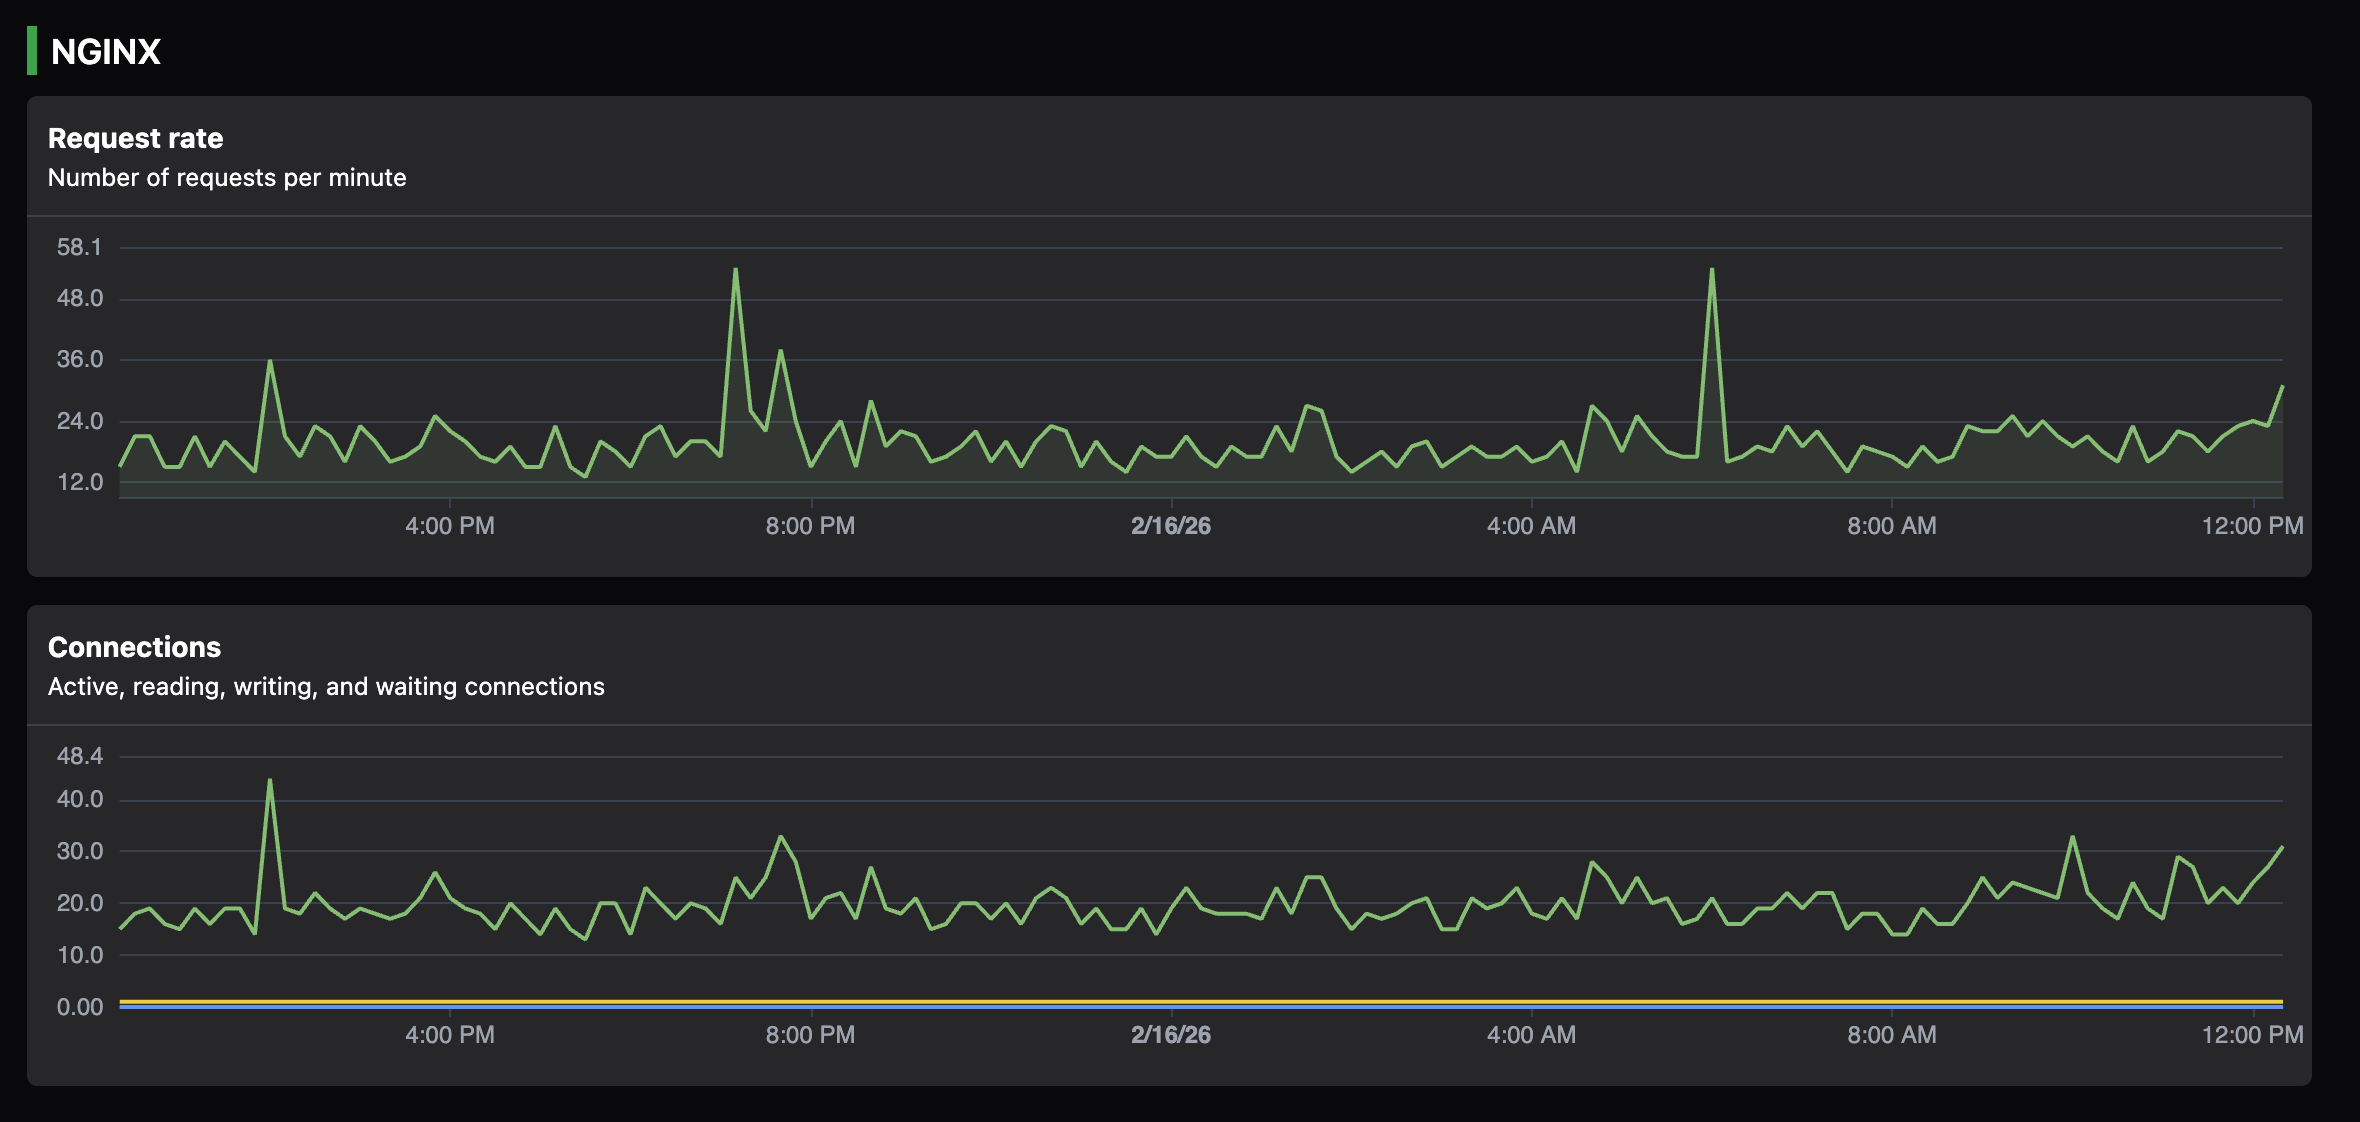
Active connections: 291
server accepts handled requests
 16630948 16630948 31070465
Reading: 6 Writing: 179 Waiting: 106
While these raw numbers are useful for scripts, visualizing them gives you immediate insight into traffic patterns:
What these metrics mean
Understanding these counters is the first step in NGINX monitoring. Each one tells a specific part of the story:
- Active connections: The total number of currently open client connections. This includes connections that are actively transmitting data and those that are idle.
- server accepts: The total number of accepted client connections since NGINX started.
- handled: The total number of handled connections. In a healthy system, this should equal
accepts. Ifhandledis lower thanaccepts, it means NGINX is dropping connections, often because it has reached theworker_connectionslimit. - requests: The total number of client requests. Because of keep-alive connections, a single connection can serve many requests. The ratio of
requeststohandledconnections is a good measure of your keep-alive efficiency. - Reading: NGINX is currently reading the request header from the client. High numbers here can indicate slow clients or potential “Slowloris” type attacks.
- Writing: NGINX is currently writing the response back to the client. This is where active work happens.
- Waiting: These are keep-alive connections where NGINX is waiting for the client to send another request. High numbers here are generally fine, but they do consume memory and connection slots.
Limitations of stub_status
While stub_status is excellent for tracking basic saturation, it has significant blind spots that every engineer should be aware of:
- Global context only: You cannot see which specific domain (Server Name) is causing load. If you host ten different sites on one NGINX instance,
stub_statusaggregates them all. - No status codes: It doesn’t tell you if you are serving successful 200s or failing with 500s.
- No latency insights: It tells you how many requests are happening but gives zero indication of how long they take to process.
- Cumulative counters: These are absolute numbers since the process started. To get a “per second” rate, you need a monitoring tool to pull the data at intervals and calculate the change over time.
Monitoring with the NGINX Plus API
For teams that require deeper visibility and can justify the cost, NGINX Plus provides a RESTful JSON API. This is not just an upgrade to stub_status; it is an entirely different level of telemetry.
The NGINX Plus API provides real-time data for:
- HTTP upstreams: See exactly which backend server is slow or failing.
- Server zones: Get traffic and error stats for every individual
serverblock. - Caches: Monitor cache hit ratios and capacity.
- Resolvers: Check the health and latency of DNS resolution.
Explicitly, this API is not available in open-source NGINX. It requires a commercial license from F5. Because it is a specialized feature, many general-purpose monitoring tools—including Simple Observability—do not support it. Instead, they focus on extracting similar insights from logs, which works across both OSS and Plus versions. If you are using Open Source NGINX, the following sections on logs will be your primary path to granular visibility.
Monitoring NGINX through Logs
If stub_status is the “pulse,” logs are the “narrative.” They’re the most critical source for detailed troubleshooting and understanding the user experience.
Access logs vs. error logs
- Access logs: These record every request. They’re the primary source for calculating latency (p99), status code distributions, and traffic patterns.
- Error logs: These record internal issues (e.g., “upstream timed out” or “file not found”). If a request fails, the access log tells you that it failed, but the error log usually tells you why. For example, an access log might show a 502 Bad Gateway, but the error log will specify if it was a “connection refused” or a “read timeout” from the upstream.
Building a monitoring-friendly access log
By default, the NGINX combined log format is designed for humans to read, not for monitoring systems to parse. To get real observability, you should define a custom log_format that includes performance metrics.
log_format monitoring_format '$remote_addr - $remote_user [$time_local] '
                             '"$request" $status $body_bytes_sent '
                             '"$http_referer" "$http_user_agent" '
                             'rt=$request_time urt=$upstream_response_time';

access_log /var/log/nginx/access.log monitoring_format;
Key fields for observability:
- $status: Essential for calculating error rates. Watch for spikes in 5xx (server errors) or 4xx (client errors).
- $request_time: The total time NGINX spent on the request, measured in seconds with millisecond resolution. This starts when NGINX reads the first bytes from the client and ends when the last bytes of the response are sent. This is your primary “latency” metric.
- $upstream_response_time: The time the backend application took to respond, also in seconds with millisecond resolution. This measures from establishing the upstream connection until receiving the last byte of the response. By comparing this to
$request_time, you can determine if a slowdown is happening in NGINX itself or in your application code. - $body_bytes_sent: Used to track bandwidth and identify unusually large (or small) responses.
Why logs are essential for metrics
You cannot get a p99 latency metric from a status endpoint. You can only get it by looking at the distribution of individual request times in the logs. Similarly, calculating a “Success Rate” (2xx/3xx vs Total) requires looking at status codes. This is why any serious NGINX monitoring strategy must include log analysis. While metrics give you the alert, logs give you the diagnosis.
How monitoring tools collect these signals
Monitoring systems generally use one of three conceptual patterns to ingest NGINX signals. Understanding these patterns helps you choose the right tool for your scale and complexity.
1. Polling (Pull Method)
The monitoring tool or an agent (like a Telegraf plugin or a custom script) periodically makes an HTTP request to /nginx_status. It parses the text, calculates the rates (deltas), and sends the data to a database. This is simple and works well for basic metrics, but it is limited by the polling frequency.
2. Scraping (Prometheus Style)
An “exporter” process sits next to NGINX, converts the raw status and log data into a format that Prometheus understands (OpenMetrics), and waits for the central Prometheus server to “scrape” it. This is the standard in Kubernetes environments but requires maintaining the exporter lifecycle.
3. Tailing and Parsing
This is the most powerful method for high-fidelity observability. An agent stays attached to the log files (tailing). Every time a new line is written, the agent parses it in real-time. It can then aggregate these into metrics—calculating average latency, error rates, and request counts—without ever needing an HTTP status endpoint. This provides the most granular view but requires more CPU resources for the parsing work.
How Simple Observability integrates with NGINX
Simple Observability provides a unified approach to NGINX monitoring by combining the strengths of both status endpoints and logs. It is designed for engineers who want production-grade visibility without the complexity of setting up complex exporters or manual log parsers.
The Integration Mechanism
Simple Observability uses a hybrid approach to maximize visibility while minimizing configuration:
- Metric Discovery: The Simple Observability agent automatically searches for a configured
stub_statusendpoint onlocalhost. Once found, it begins polling for connection-level metrics (Active, Reading, Writing, etc.). - Log Tailing: The agent tails the standard NGINX log directories (e.g.,
/var/log/nginx/). It is pre-configured to understand standard NGINX log formats and can be adapted to custom one-line formats, making your logs searchable and accessible. - No NGINX Plus Requirement: Simple Observability works with the signals available in the open-source version. It does not use the NGINX Plus API, making it accessible to all users.
What this achieves
By combining these two streams, Simple Observability gives you visibility into your NGINX server:
- Is the server saturated? (via stub_status metrics)
- What’s happening in my logs? (via searchable access and error logs)
You get connection-level metrics and searchable logs, all managed through a single, lightweight agent. This provides visibility into both the overall health of your NGINX instance and the ability to investigate specific requests when issues arise.
NGINX monitoring best practices
To get the most out of your monitoring setup, keep these three principles in mind:
- Isolate your status endpoint: Never listen on public interfaces. Use
127.0.0.1and restrict access viaallow/denydirectives. Monitoring data is sensitive information about your traffic. - Monitor both NGINX and the backend: Always include
$upstream_response_timein your logs. If you only monitor NGINX latency, you won’t know if the problem is NGINX’s configuration or a slow database query in your application. - Alert on saturation and errors, not just “up/down”: A running NGINX process that is dropping 50% of its connections is effectively down, even if the process is “running.” Set alerts on your
handled/acceptsratio and your 5xx error rate. - Use keep-alive: Monitor the ratio of
requeststohandledconnections. If it’s close to 1:1, you aren’t benefiting from keep-alive, which increases latency for your users.
Conclusion
NGINX exposes limited but extremely useful native signals. By enabling stub_status and properly configuring your access logs, you unlock the primary signals needed to understand throughput, latency, and errors.
Effective monitoring is the key to maintaining a high-performance web infrastructure. It bridges the gap between raw data and actionable insights, allowing you to catch issues before they impact your users. Whether you are using a manual setup or a unified tool like Simple Observability, the goal is the same: visibility into the critical path of your traffic.
Monitoring shouldn’t be an afterthought; it should be built into your configuration from day one. With the right signals, NGINX becomes more than just a proxy - it becomes your most powerful tool for operational excellence.