
Ubuntu servers run everything from homelab setups to production fleets, but most administrators still rely on manual SSH sessions and htop to check if things are healthy. That works for a single machine. It falls apart the moment you manage three or more servers and need alerts before users notice a problem.
The right ubuntu monitoring setup depends on your fleet size, budget, and whether you need historical data for capacity planning. Below is a comparison of the best tools available, from managed platforms with alerting to free command-line utilities you can install in seconds. For a deeper dive into Linux monitoring in general, see our Linux server monitoring and Linux log monitoring guides.
Quick summary
| Tool | Best for | Pricing |
|---|---|---|
| Simple Observability | Small teams needing metrics, logs, and alerts without setup | Free for 1 server; $3/server/month |
| Netdata | Real-time, per-second visibility on a single node | Free (OSS); $6/node/month for cloud |
| Prometheus + Grafana | Teams who want full control over their monitoring stack | Free (OSS) |
| Zabbix | Large, hybrid environments with legacy hardware | Free (OSS); cloud from $50/month |
| Nagios | Organizations with existing plugin ecosystems | Core free; XI from $1,995/100 nodes |
| htop | Quick, interactive process monitoring over SSH | Free |
| btop | A visually rich, modern alternative to htop | Free |
| Glances | Cross-platform monitoring with web UI and API | Free |
| nmon | IBM-style performance analysis with CSV export | Free |
| atop | Historical logging and per-process resource tracking | Free |
Managed and SaaS ubuntu monitoring tools
These platforms provide centralized dashboards, alerting, and historical data retention. They require installing an agent on each Ubuntu server but handle the storage, visualization, and notification layer for you.
Simple Observability
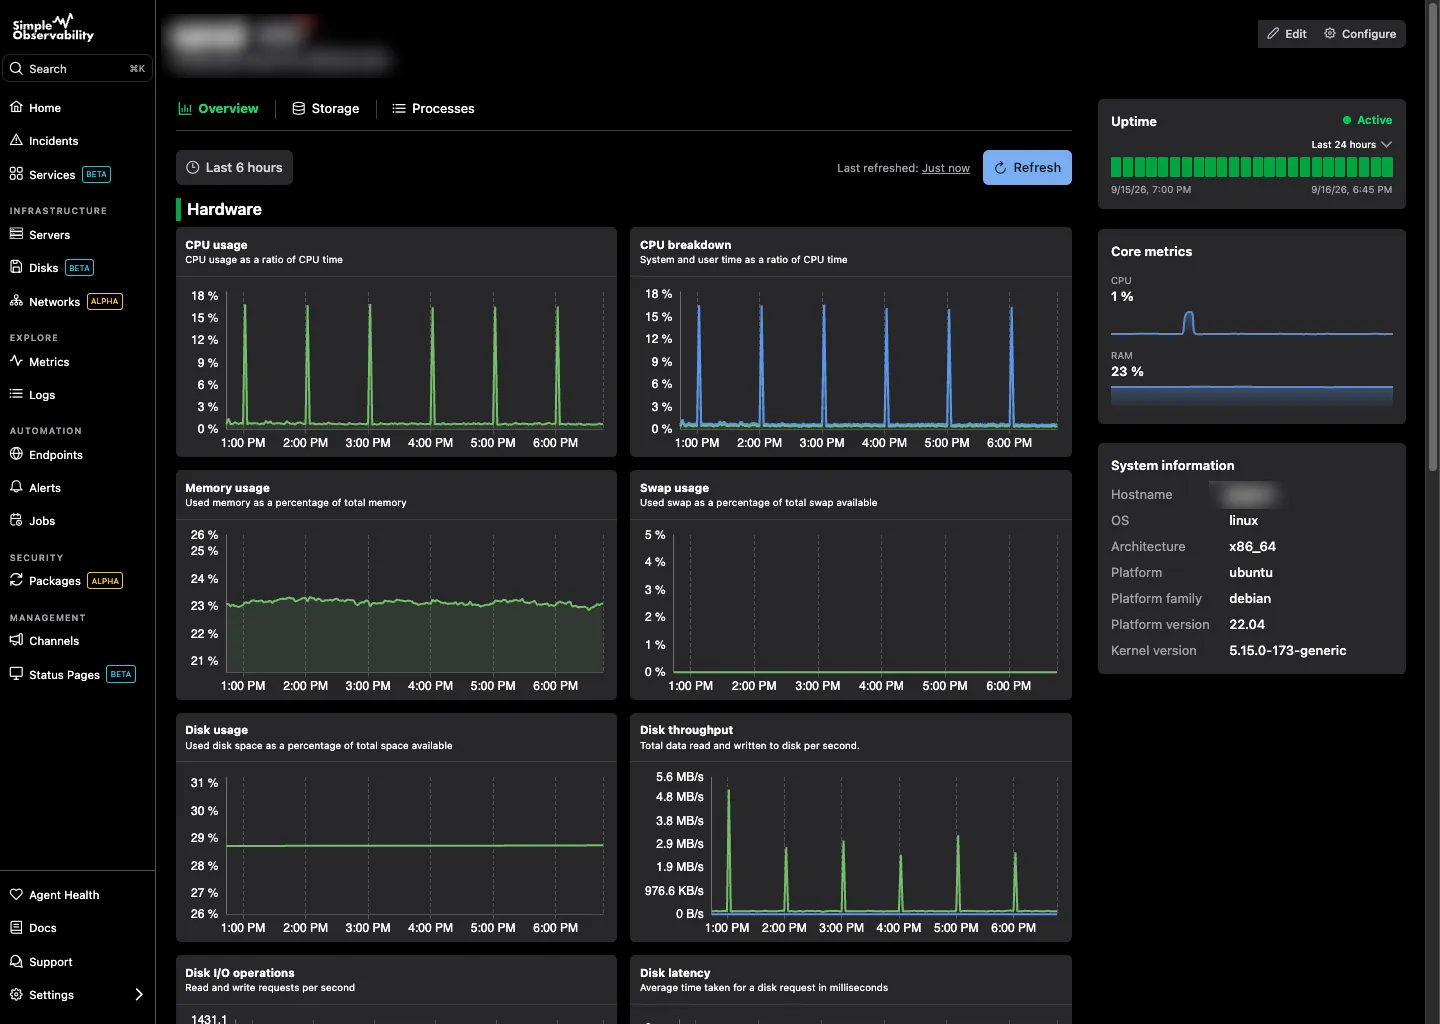
Simple Observability is a unified monitoring platform built for teams that want metrics, logs, and alerts without maintaining a separate stack. On Ubuntu, installation is a single command that deploys a lightweight agent. The agent auto-detects systemd services, starts collecting CPU, memory, disk, and network metrics, and tails journald logs without manual configuration.
The platform is designed around the idea that most teams do not need hundreds of niche metrics. They need the right signals, correlated with logs, delivered with alerts that fire before things break. Pricing is per server with no ingestion-based surprises.
Key features
- One-command agent install with auto-detection of running services
- Unified metrics and logs in a single interface, including journald
- Zero-config alert rules for common failure patterns (disk full, high CPU, service down)
- Cron job monitoring and process tracking built in
Pros
- Fastest setup time among managed options, under five minutes per server
- Flat per-server pricing with no ingestion fees or custom metric charges
- Lightweight agent with minimal resource overhead on Ubuntu
Cons
- Fewer niche integrations than enterprise platforms like Datadog
- Limited support for custom PromQL queries or user-built dashboards
Best for: Small teams and solo IT managers running 1 to 20 Ubuntu servers who need alerts and log correlation without managing infrastructure.
Price Free for 1 server. Standard plan at $3/server/month. Advanced plan at $4/server/month with higher metric and log limits. Start monitoring your Ubuntu servers in under five minutes.
Netdata
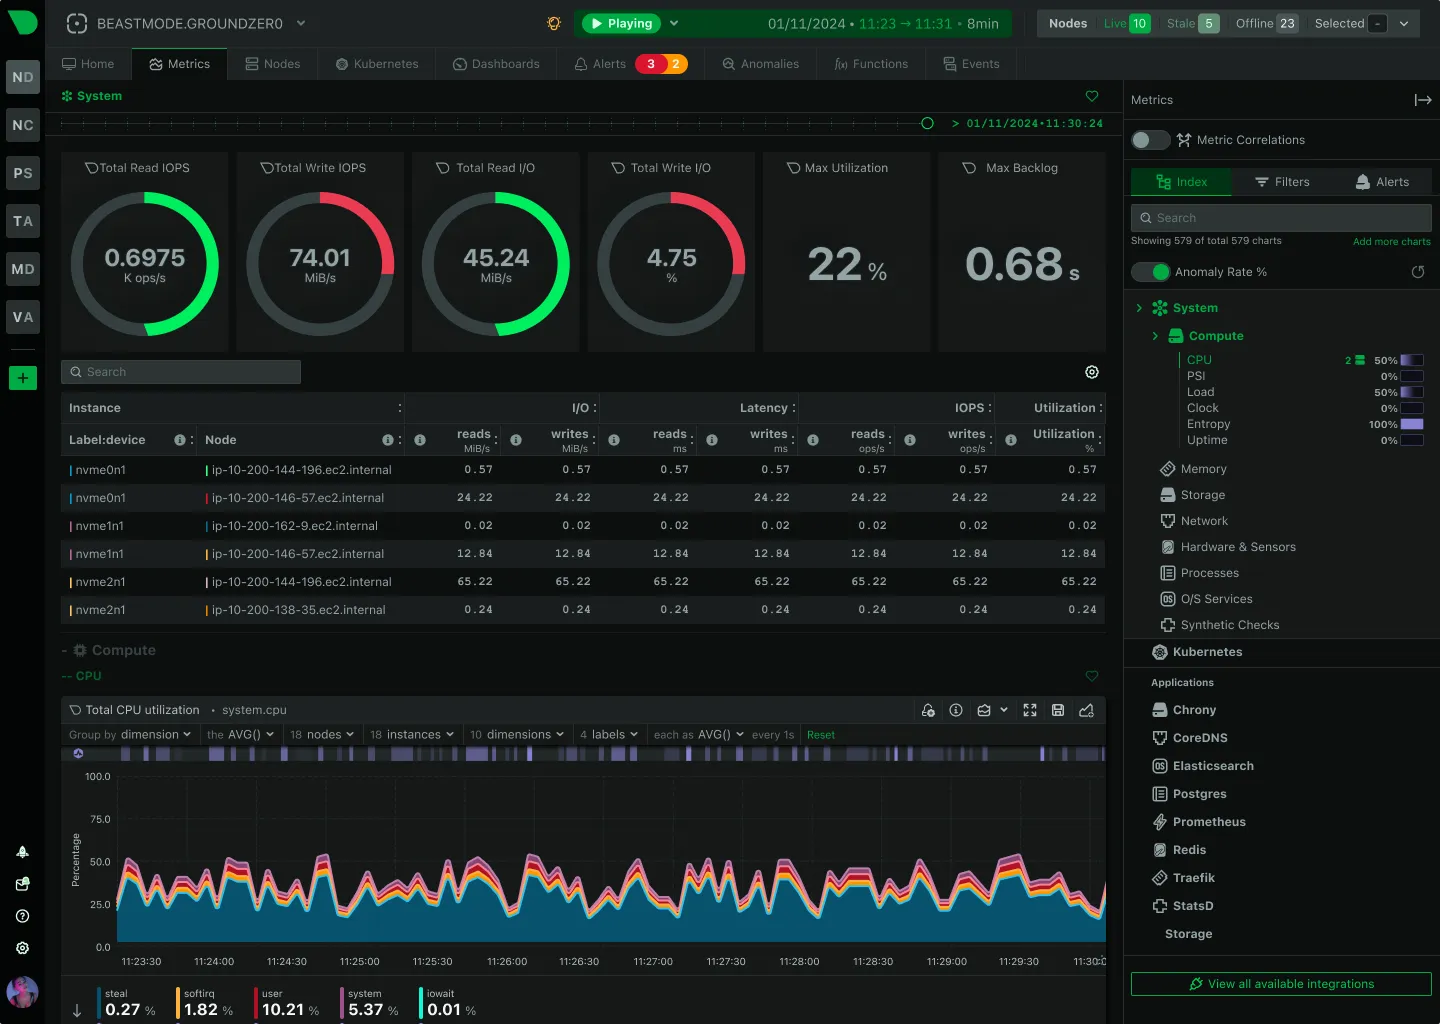
Netdata is an open-source monitoring agent known for per-second metric collection. Install it on Ubuntu with a single script and you immediately get hundreds of metrics with pre-built dashboards covering CPU, memory, disk I/O, network, and applications. It also includes machine-learning-based anomaly detection that learns your workload patterns and flags outliers without manual threshold tuning.
The trade-off is scale. Netdata works beautifully on a single node, but centralized monitoring across multiple Ubuntu servers requires Netdata Cloud (paid) or configuring streaming between parent and child nodes. The agent is also more resource-intensive than lighter alternatives.
Key features
- Per-second data collection for real-time troubleshooting
- Anomaly detection powered by unsupervised machine learning
- Auto-discovery of running services like Nginx, MySQL, and Docker
Pros
- Fastest time-to-value for real-time visibility on a single server
- Zero configuration required after installation
- Strong community and extensive documentation
Cons
- Resource usage is higher than lighter agents
- Centralized multi-server monitoring requires paid cloud plan
- Log management features are less mature than dedicated log platforms
Best for: Developers who need immediate, deep visibility into a single Ubuntu node for real-time troubleshooting.
Price Free and open-source for self-hosted. Netdata Cloud starts at $6 per node per month.
Prometheus + Grafana
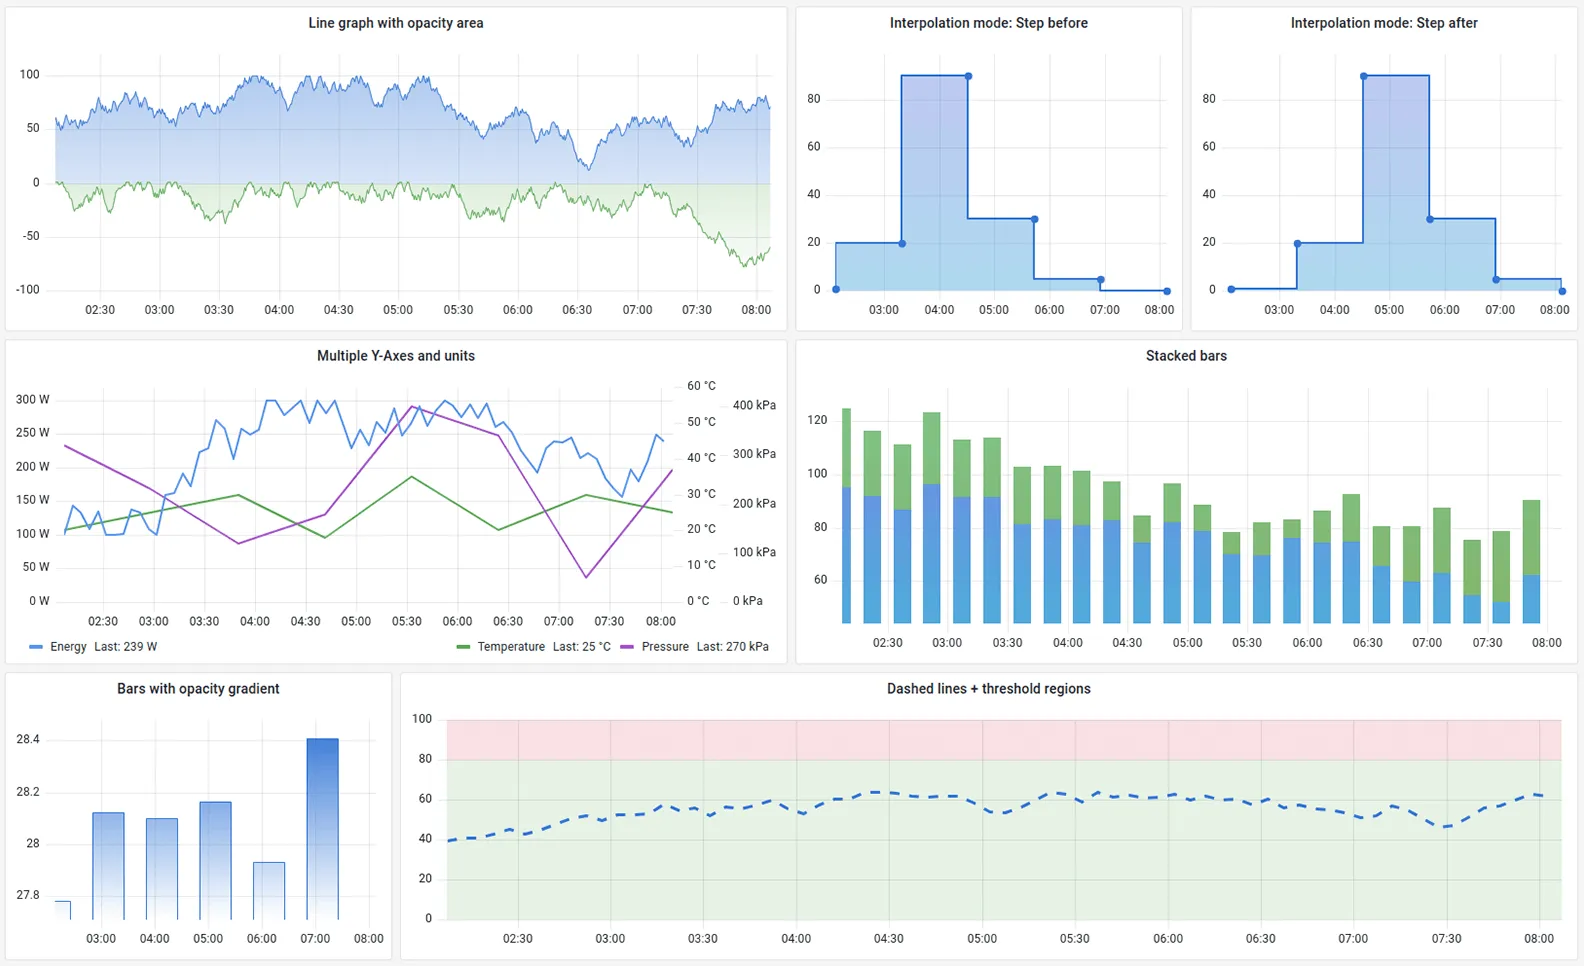
Prometheus and Grafana are the open-source standard for metrics collection and visualization. You install node_exporter on each Ubuntu server to expose system metrics, run a Prometheus instance to scrape and store them, and use Grafana to build dashboards. For alerting, you add Alertmanager. For logs, you add Loki and Promtail.
This gives you total control over every component. The ecosystem is enormous, with exporters available for nearly any software you might run on Ubuntu. The cost is operational: initial setup takes hours, every component needs its own storage and backup strategy, and when Prometheus goes down, your monitoring goes with it.
Key features
- PromQL query language for multi-dimensional metric analysis
- Service discovery for dynamically finding targets in Kubernetes or cloud environments
- Thousands of community-built dashboards and exporters
Pros
- No licensing costs and no vendor lock-in
- Massive community support and documentation
- Fully customizable dashboards and alerting logic
Cons
- High maintenance burden across multiple components
- No native log support without adding Loki and Promtail
- Requires a dedicated server or container to run the stack
Best for: Teams with infrastructure experience who want total control and are comfortable maintaining multiple services.
Price Free and open-source.
Zabbix
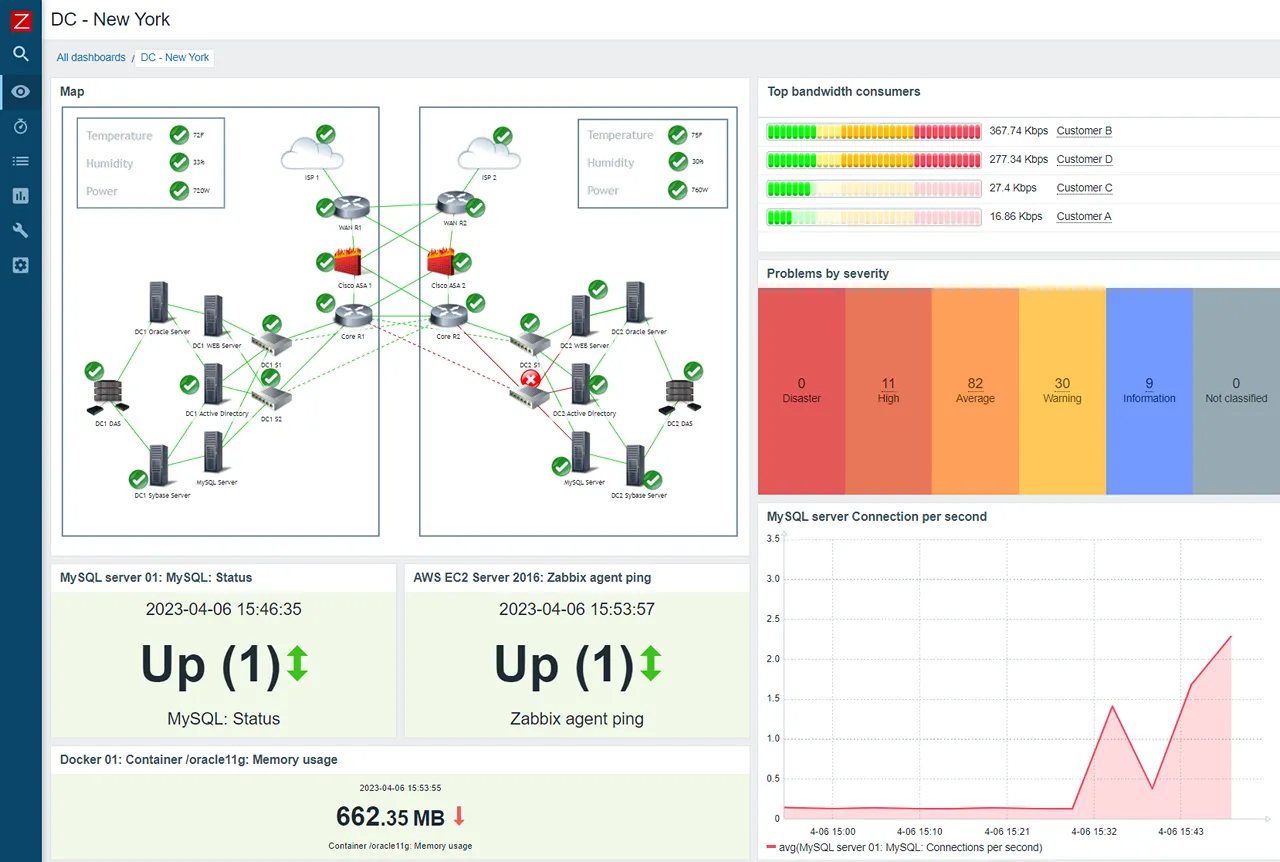
Zabbix is a mature, enterprise-grade monitoring platform that excels at hybrid environments. It supports agent-based and agentless monitoring, meaning it can track Ubuntu servers alongside network switches, IPMI devices, and Windows machines. The agent installs cleanly on Ubuntu via apt and provides detailed system metrics, process monitoring, and log monitoring.
The platform offers auto-discovery, template-based monitoring, and a robust alerting system with escalation and notification channels. It is highly scalable, capable of monitoring thousands of devices through distributed proxies. The trade-off is complexity. Zabbix requires a database backend (MySQL or PostgreSQL), a web frontend, and significant configuration time.
Key features
- Agent and agentless monitoring with SNMP, JMX, and IPMI support
- Distributed monitoring through Zabbix proxies for remote locations
- Template-based configuration with auto-discovery
Pros
- Proven reliability at massive scale across global environments
- Completely free with no hidden licensing tiers
- Granular permissions for multi-tenant environments
Cons
- Steep learning curve requiring weeks to configure properly
- Dated interface that feels like software from the 2000s
- Log management is less capable than dedicated log platforms
Best for: Larger fleets with a mix of Ubuntu servers and legacy infrastructure where ops staff can dedicate time to configuration.
Price Free and open-source. Zabbix cloud starts at $50/month.
Nagios
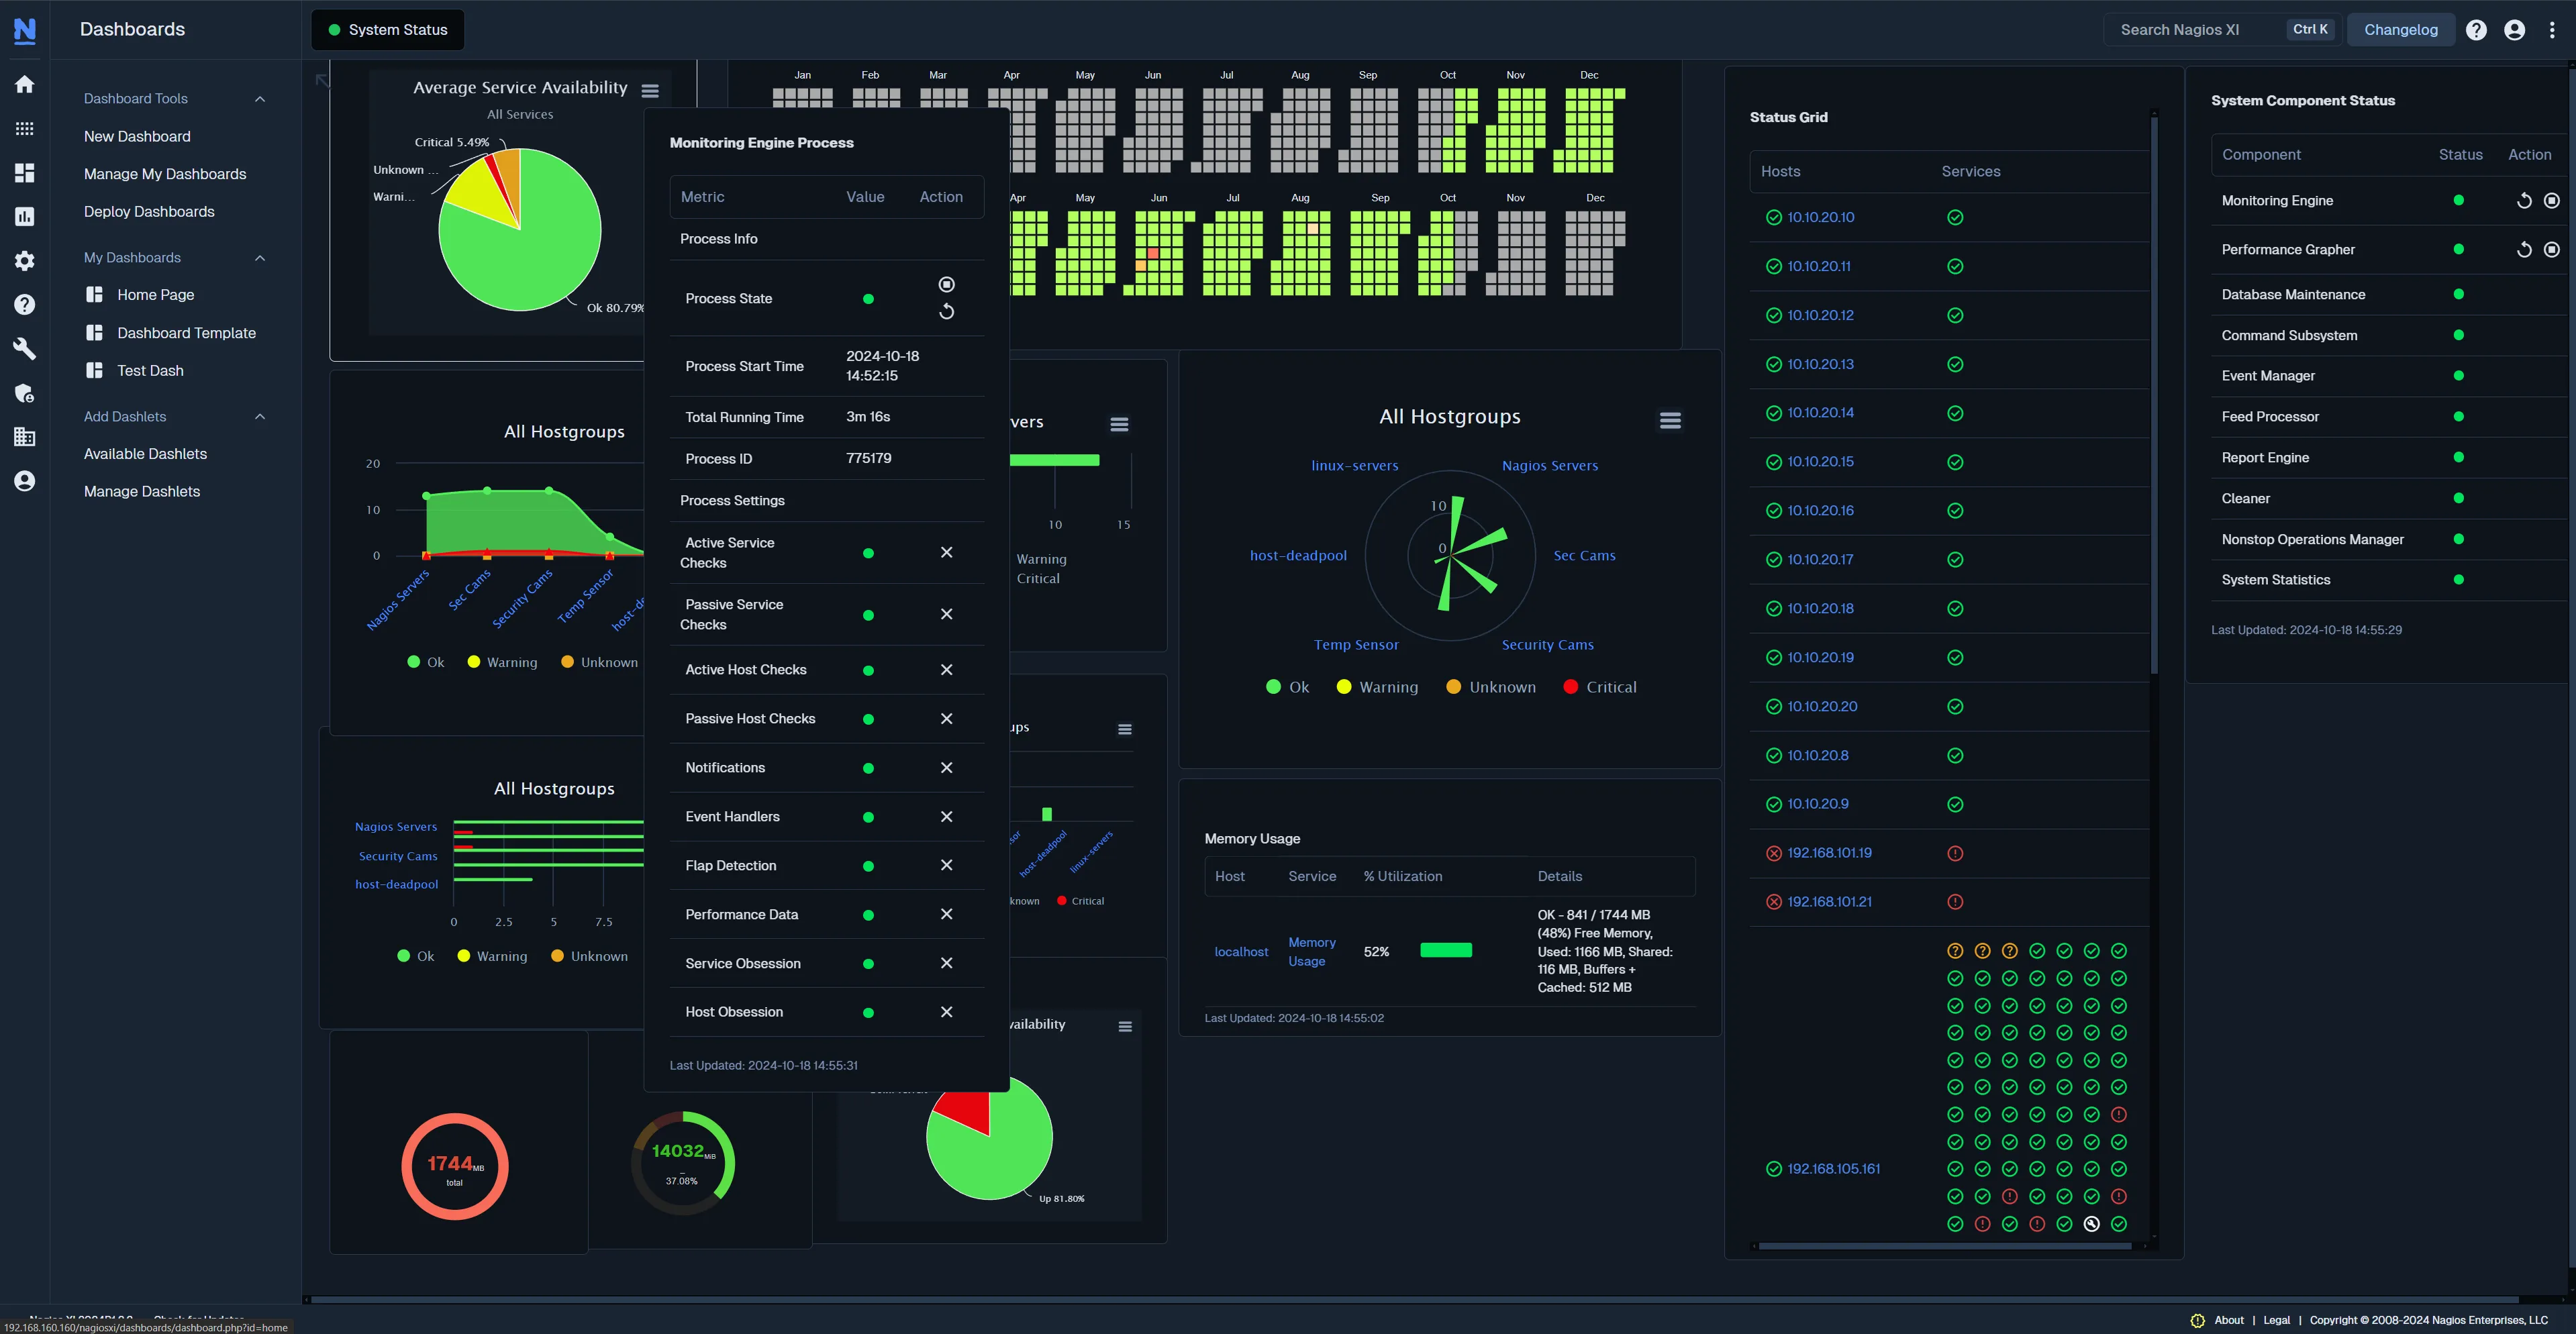
Nagios is one of the oldest monitoring tools still widely used. It comes in two flavors: Nagios Core, a free open-source engine with a limited feature set, and Nagios XI, a commercial product with a broader feature set including capacity planning and configuration wizards. The agent or check plugins install on Ubuntu and report back to a central Nagios server.
Nagios relies on a plugin architecture. There are thousands of community plugins for monitoring everything from CPU load to specific application health. This flexibility is its biggest strength, but also its biggest weakness. Configuration is done through text files, the interface is dated, and scaling requires significant manual effort.
Key features
- Plugin-based architecture with thousands of community extensions
- Alerting with escalation rules and notification channels
- Scripting API for monitoring custom metrics and applications
Pros
- Extremely mature with a long track record in production environments
- Highly customizable through plugins and custom scripts
- Strong community support built over two decades
Cons
- Configuration is file-based and time-consuming
- Interface is outdated compared to modern alternatives
- Advanced features require the paid Nagios XI license
Best for: Organizations with an existing Nagios deployment or teams that rely heavily on custom plugins.
Price Nagios Core is free and open-source. Nagios XI starts at $1,995 for a 100-node license. Enterprise starts at $3,495.
Free command-line ubuntu monitoring tools
Not every monitoring need requires a platform. Sometimes you just need a quick view of what is happening on an Ubuntu server right now, over an SSH session. These tools are free, install in seconds via apt, and provide real-time system metrics. They do not offer alerting, historical data, or multi-server views, but they are indispensable for ad-hoc troubleshooting.
htop
htop is the tool most Ubuntu administrators install first. It is an interactive process viewer that shows CPU usage per core, memory and swap consumption, and a sortable process list. You can kill processes directly from the interface without typing PIDs, and the display updates in real time.
It is available in the default Ubuntu repositories and installs with a single command: sudo apt install htop. It is lightweight, fast, and works well over SSH connections, even on high-latency links.
Key features
- Color-coded CPU, memory, and swap bars with per-core breakdown
- Interactive process list with sorting, filtering, and tree view
- Mouse support for selecting and killing processes
Pros
- Available in default Ubuntu repositories, zero configuration
- Minimal resource footprint, suitable for low-end VPS instances
- Intuitive enough for beginners, detailed enough for experienced admins
Cons
- No alerting or historical data retention
- Limited to a single host at a time
- Does not show disk I/O or network metrics by default
Best for: Quick, real-time process and CPU checks during SSH sessions.
Price Free and open-source.
btop
btop is the modern, visually polished successor to bashtop and bpytop. Written in C++, it offers the same process monitoring as htop but with significantly better visuals, including real-time graphs for CPU, memory, disk, and network. The interface supports mouse navigation, customizable layouts, and a settings menu that does not require editing config files.
On Ubuntu 22.04 and later, btop is available directly through apt: sudo apt install btop. For older versions, you can install it from the GitHub releases. It is the tool most likely to replace htop on your daily-driver Ubuntu server.
Key features
- Real-time graphical charts for CPU, memory, disk, and network
- Customizable themes and layouts via an in-app menu
- Mouse support with full keyboard navigation fallback
Pros
- Best-in-class visual presentation among CLI monitors
- Covers more metrics than htop, including disk I/O and network
- Low resource usage despite the rich interface
Cons
- Truecolor support can break over some SSH connections (fixable in settings)
- Fewer deployment years than htop, smaller community
- No built-in alerting or historical logging
Best for: Admins who want a visually rich, all-in-one CLI monitor that goes beyond process listing.
Price Free and open-source.
Glances
Glances is a Python-based monitoring tool that runs in the terminal, as a web server, or through a RESTful API. It provides a comprehensive overview of system metrics including CPU, memory, disk I/O, network, temperatures, and Docker containers. The web UI mode is particularly useful for monitoring headless Ubuntu servers from a browser without installing a full monitoring platform.
Install it on Ubuntu with pip or apt: sudo apt install glances. It supports exporting metrics to InfluxDB, Prometheus, and Elasticsearch, which means it can serve as a lightweight data collector if you later decide to build a more permanent monitoring stack.
Key features
- Terminal, web UI, and REST API modes from a single installation
- Export support for Prometheus, InfluxDB, Elasticsearch, and StatsD
- Built-in Docker container monitoring
Pros
- Most versatile CLI tool, works as both a viewer and a data exporter
- Web UI mode enables remote monitoring without SSH
- Plugin architecture for extending functionality (sensors, RAID, SNMP)
Cons
- No built-in alerting mechanism
- Python dependency can be heavier than native tools like htop
- More complex setup for export modes compared to standalone use
Best for: Admins who want a single tool for both quick CLI checks and lightweight web-based monitoring.
Price Free and open-source.
nmon
nmon (Nigel’s Monitor) is a performance analysis tool originally developed by IBM for AIX and later ported to Linux. It provides an interactive, toggle-based interface where you press keys to show or hide specific metric panels (CPU, memory, disk, network, filesystems, kernel stats). This makes it easy to focus on exactly the metrics you care about without a cluttered screen.
Beyond interactive mode, nmon can run in data capture mode, recording system metrics to a CSV file at specified intervals. This is useful for post-mortem analysis on Ubuntu servers where you do not have a full monitoring platform but need historical data for a specific incident.
Key features
- Interactive toggle mode for focusing on specific metric categories
- Data capture mode exporting to CSV for historical analysis
- Support for CPU, memory, disk I/O, network, processes, and kernel statistics
Pros
- Lightweight and fast, even on low-resource Ubuntu instances
- CSV export enables basic historical analysis without a database
- Supports ARM architectures including Raspberry Pi running Ubuntu
Cons
- Interface is functional but not visually modern
- No alerting or notification capabilities
- CSV analysis requires external tools (spreadsheet or scripts)
Best for: Performance analysis and capacity planning on Ubuntu servers where you need recorded data without a full platform.
Price Free and open-source.
atop
atop is an advanced system and process monitor that logs resource usage at the system and per-process level. Its standout feature is historical logging. When configured as a daemon, atop continuously records system activity, allowing you to replay past periods and see exactly what was consuming resources at a specific time.
This makes atop uniquely valuable for post-mortem analysis. If an Ubuntu server experienced high load at 3 AM, you can use atop -r to replay the recorded data and identify the process responsible. It also uses color to flag resources reaching saturation (90%+ disk, memory, or CPU), drawing your attention immediately.
Key features
- Historical logging of all process and system-level resource usage
- Color-coded saturation indicators for CPU, memory, and disk
- Network monitoring via the netatop kernel module (TCP, UDP, bandwidth)
Pros
- Best CLI tool for post-mortem analysis with historical replay
- Logs processes that have already completed during the monitoring interval
- Detailed disk I/O and network statistics per process
Cons
- Historical logging requires daemon configuration
- Interface is dense and can overwhelm new users
- A 2025 security vulnerability required patches (ensure you run a current version)
Best for: Root cause analysis on Ubuntu servers where you need to reconstruct what happened during a past incident.
Price Free and open-source.
How to choose the right ubuntu monitoring tool
The right tool depends on three factors: how many Ubuntu servers you manage, whether you need alerts, and whether you need historical data.
For a single server or homelab. Start with btop or htop. Both install in seconds via apt and give you real-time visibility over SSH. Add Glances if you want a web UI without setting up a full platform. These tools are free, lightweight, and answer the question “what is happening right now?”
For a small fleet (3 to 20 servers). You need centralized visibility and alerting. A managed platform like Simple Observability or Netdata Cloud gives you a single dashboard, threshold-based alerts, and log correlation without maintaining infrastructure. The per-server pricing model of Simple Observability is predictable for small budgets. Netdata offers deeper real-time granularity if you can tolerate higher agent resource usage.
For a large or hybrid fleet (20+ servers). You likely need the flexibility of a self-hosted stack. Prometheus and Grafana give you unlimited customization but require dedicated staff to maintain. Zabbix is the better choice if your environment includes non-Linux devices (network switches, Windows servers, IPMI) alongside Ubuntu. Nagios makes sense if you already have an investment in its plugin ecosystem.
For post-mortem analysis. Regardless of your platform choice, install atop as a daemon on every Ubuntu server. Its historical logging is the fastest way to reconstruct what happened during an incident, and it costs nothing.
Conclusion
Start with a CLI tool for ad-hoc checks, then add a managed platform when you need alerts and multi-server visibility. btop and htop cover the real-time troubleshooting case for free. When your Ubuntu fleet grows past a single server and you need to be notified before users report problems, a managed platform like Simple Observability gives you metrics, logs, and alerting in a single install without the maintenance overhead of a self-hosted stack. If you’re evaluating Netdata specifically, our Netdata alternatives guide covers the tradeoffs in detail.