
The transition to microservices and distributed systems has turned infrastructure into a black box. In a traditional setup, you knew exactly where your database lived. Today, your application might rely on dozens of ephemeral containers, serverless functions, and managed cloud services spread across multiple regions.
In this environment, “is the server up?” is no longer a useful question. You need to know if the latest deployment caused a latency spike in your checkout service, or if a specific API change is triggering 5xx errors for a subset of your users.
DevOps monitoring is the practice of closing this feedback loop. It is about moving from reactive firefighting to continuous observability. Here are the 11 best tools to help you gain that visibility in 2026.
Quick summary
| Tool | Best for | Pricing model |
|---|---|---|
| Simple Observability | Fast-moving teams needing metrics + logs | $3 / server / month |
| Datadog | Large enterprises with complex multi-cloud | Ingestion + host based |
| Prometheus & Grafana | Cloud-native teams using Kubernetes | Free (OSS) |
| Splunk | Large-scale log analysis and security | Data volume based |
| New Relic | Deep application performance (APM) | Usage based |
| Dynatrace | AI-driven root cause analysis | Host based |
| ELK Stack | Custom, self-hosted log pipelines | Free (OSS) |
| BrowserStack | Monitoring test suite health and flakiness | Subscription |
| Zabbix | Hybrid environments with legacy hardware | Free (OSS) |
| Netdata | Real-time troubleshooting on individual nodes | Per node |
| Honeycomb | Debugging complex distributed tracing | Event based |
Simple Observability
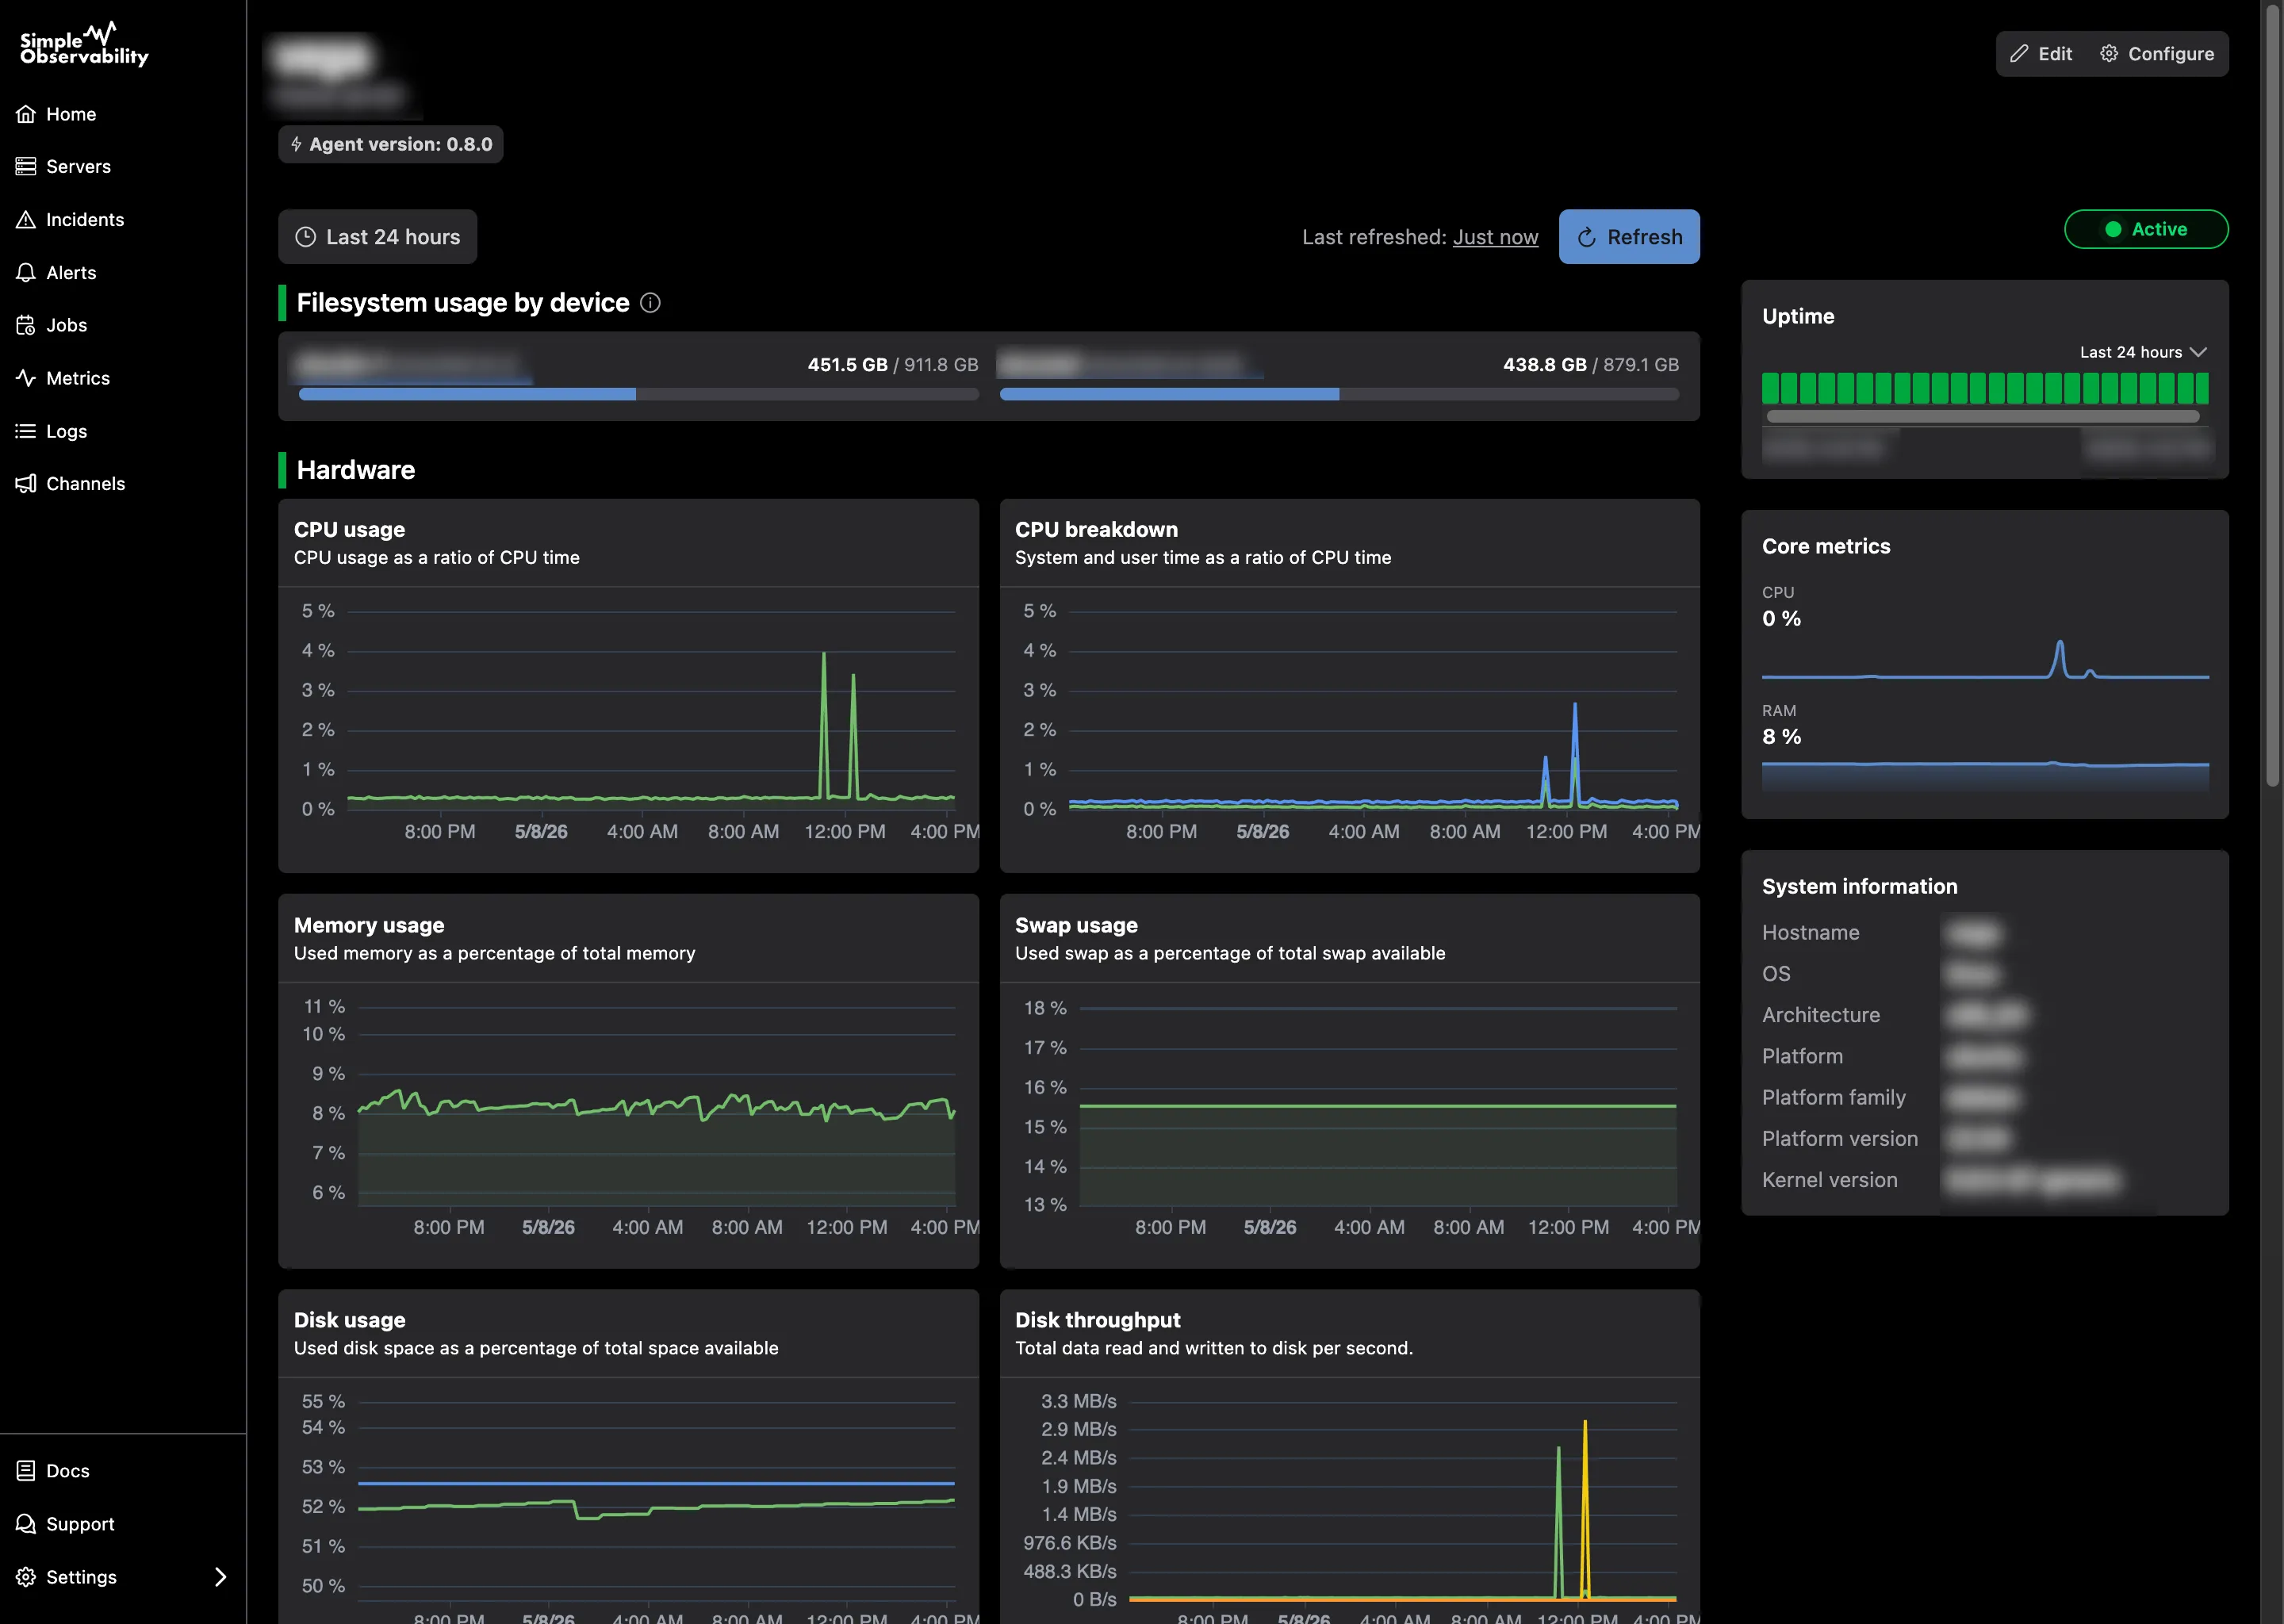
Simple Observability is built for DevOps teams that have outgrown basic cloud-native tools but don’t want the “maintenance tax” of an enterprise platform. It focuses on time-to-visibility, replacing complex YAML configurations with a single-command installation that works across any cloud or on-prem environment.
It treats metrics and logs as two sides of the same coin. Instead of jumping between tabs to correlate a CPU spike with a log error, Simple Observability shows them in a unified view by default. This makes it particularly effective for debugging failed deployments where you need to see exactly what happened in the seconds following a code change.
Key features
- One-command installation: A single binary agent discovers services and starts reporting immediately.
- Unified monitoring: Automatically correlates system metrics with application logs.
- Zero-config alerts: Comes with sensible defaults for common DevOps failure patterns.
- Mobile-first PWA: Manage incidents and view real-time dashboards from your phone.
Pros
- Extremely fast setup with zero manual dashboard configuration.
- Predictable, flat-fee pricing that doesn’t scale with data ingestion.
- Lightweight agent with negligible overhead on production workloads.
Cons
- Fewer “niche” legacy integrations compared to 20-year-old platforms.
Best for: Teams that want high-quality observability without hiring a dedicated person to manage the monitoring stack.
Price Free for 1 server; $3/mo per server for the standard plan.
Datadog
Datadog is the undisputed heavyweight of the DevOps world. It is a comprehensive SaaS platform that offers over 600 integrations, covering everything from network flow logs to serverless performance. It excels in environments where you need to see every layer of the stack in one place.
Key features
- 600+ integrations: Point-and-click connections for AWS, Azure, GCP, and hundreds of SaaS tools.
- Watchdog AI: Automatically detects anomalies and outliers in massive datasets.
- Service catalog: Provides a central map of your microservices and their dependencies.
Pros
- The most complete feature set on the market, including security and RUM.
- Excellent correlation between different telemetry types.
Cons
- High cost: Ingestion fees and custom metric charges can lead to unpredictable billing.
- Steep learning curve for advanced dashboarding and alerting.
Best for: Large enterprises with complex, multi-cloud infrastructures.
Price Infrastructure monitoring starts at $15/host/month, but APM and logs are billed as separate add-ons.
Prometheus & Grafana
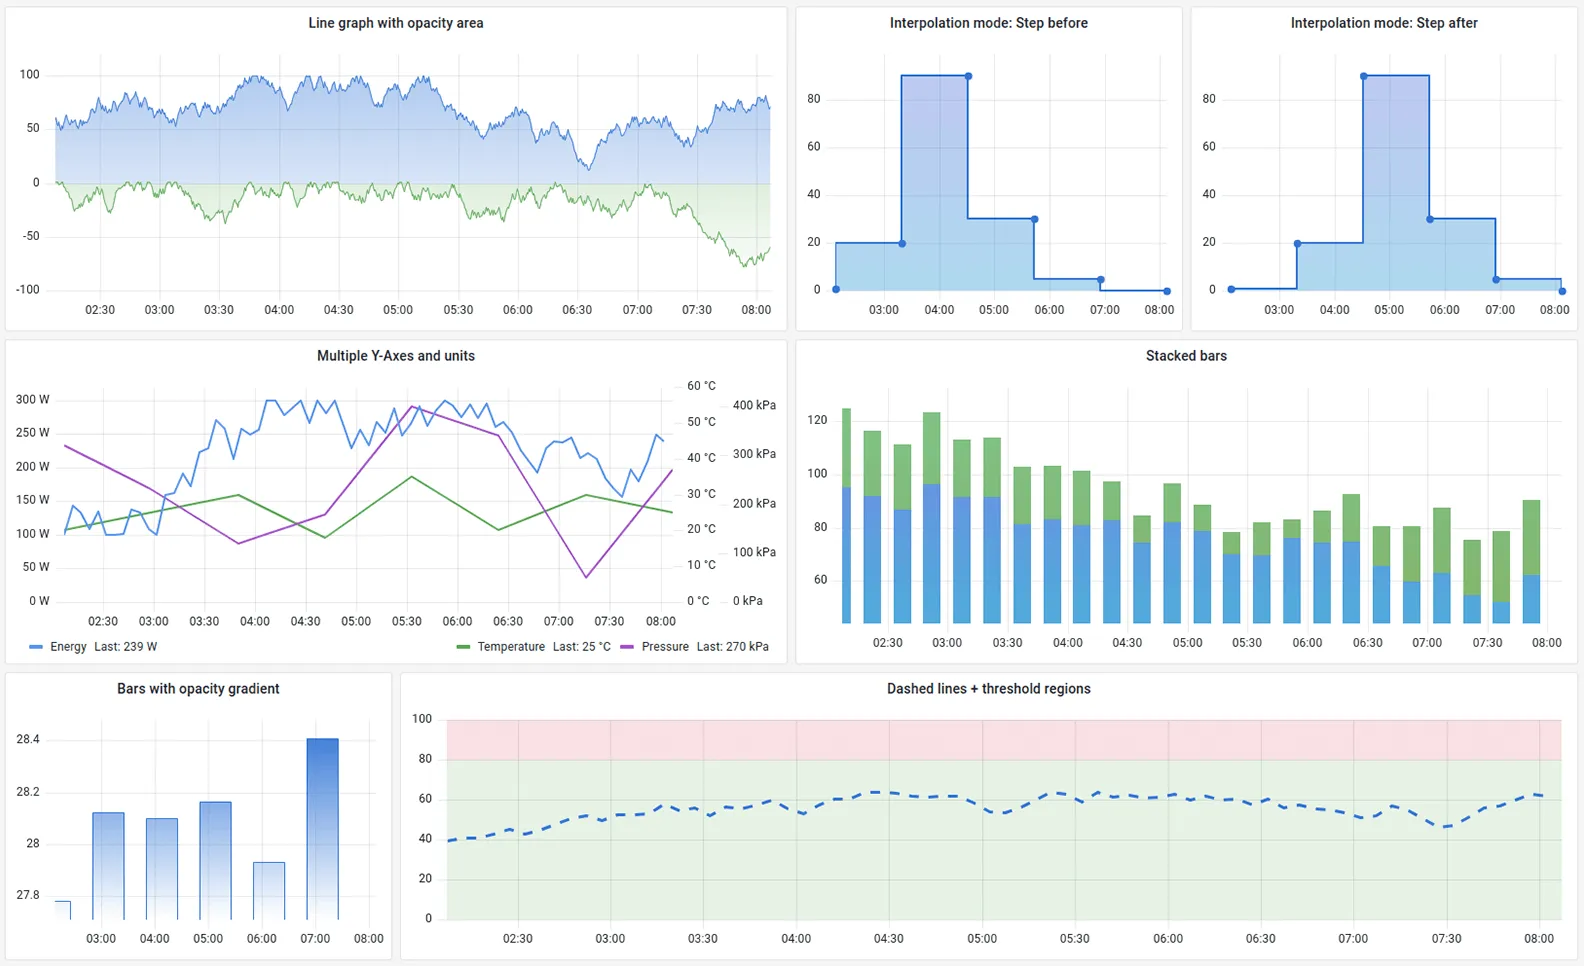
Prometheus and Grafana are the industry standards for open-source, cloud-native monitoring. Prometheus uses a pull model to collect metrics, while Grafana provides the visualization layer. This combination is the de facto choice for teams running on Kubernetes.
Key features
- PromQL: A powerful, multi-dimensional query language for data analysis.
- Service discovery: Built-in support for dynamically discovering targets in Kubernetes.
- Huge ecosystem: Thousands of community-built dashboards and exporters.
Pros
- No licensing costs and no vendor lock-in.
- Massive community support and documentation.
Cons
- High maintenance burden: You must manage storage, scaling, and backups yourself.
- No native support for logs or traces; requires adding Loki and Tempo.
Best for: Kubernetes-heavy teams with strong internal DevOps skills.
Price Free (Open Source).
Splunk
Splunk is a powerful data platform primarily used for searching, analyzing, and visualizing machine-generated data. While often associated with security, it is a robust DevOps tool for log aggregation and real-time troubleshooting at scale.
Key features
- Powerful search processing language (SPL) for complex data queries.
- Real-time alerting and incident response orchestration.
- Massive scalability for petabyte-scale data ingestion.
Pros
- Unmatched log analysis and filtering capabilities.
- Strong security features that bridge the gap between DevOps and SecOps.
Cons
- Extremely expensive pricing based on data volume.
- Requires significant expertise to configure and manage.
Best for: Large organizations with massive logging requirements and high security needs.
Price Volume-based pricing; typically requires a custom quote.
New Relic
New Relic focuses on “all-in-one” observability with a heavy emphasis on Application Performance Monitoring (APM). It is designed to show you exactly how your code is performing in production and how that relates to the underlying infrastructure.
Key features
- Deep APM: Trace specific database queries or functions back to the source code.
- User experience monitoring: Track real user interactions on web and mobile.
- Applied Intelligence: Uses AI to correlate incidents and reduce alert noise.
Pros
- Excellent visibility into code-level performance issues.
- Generous free tier for small teams and individual projects.
Cons
- The UI can be cluttered and overwhelming for simple monitoring tasks.
- Per-user seat pricing can become a bottleneck as the team grows.
Best for: Application-focused teams where code performance is the top priority.
Price Usage-based: free for 100 GB/month; paid plans start at $0.30/GB plus seat fees.
Dynatrace
Dynatrace is an AI-powered platform that aims to automate the “why” behind an incident. Its “Davis” AI engine analyzes the entire topology of your stack to pinpoint the root cause of a failure, rather than just sending an alert.
Key features
- Automated root cause analysis: Identifies the exact component causing a failure.
- OneAgent: A single agent that automatically discovers and instruments the full stack.
- Dependency mapping: Visualizes how services interact across the organization.
Pros
- Dramatically reduces the time spent in “war rooms” during incidents.
- Automatic discovery makes it easier to manage in fast-changing environments.
Cons
- High price point focused on large enterprise budgets.
- Less flexibility for custom configurations compared to open-source tools.
Best for: Large enterprises looking to automate incident investigation.
Price Host-based pricing, typically starting around $74/month for full-stack monitoring.
ELK Stack (Elasticsearch, Logstash, Kibana)
The ELK Stack is the most popular open-source toolchain for log management. Elasticsearch provides the search and storage, Logstash handles the ingestion pipeline, and Kibana provides the visualization interface.
Key features
- Full-text search: Quickly search through millions of log lines for specific errors.
- Flexible pipelines: Use Logstash to transform and enrich logs before they are stored.
- Large plugin library: Connect to almost any data source.
Pros
- Highly customizable and can be tailored to any logging requirement.
- No software licensing costs.
Cons
- Operationally heavy: Managing Elasticsearch clusters at scale is notoriously difficult.
- Scaling ingestion can be resource-intensive.
Best for: Teams that need a custom, self-hosted log management solution.
Price Free (Open Source).
BrowserStack Test Observability
While most tools focus on production, BrowserStack Test Observability focuses on the “shift-left” part of DevOps: testing. It provides a unified dashboard to monitor the health of your automated test suites, helping you identify flaky tests and performance regressions before code reaches production.
Key features
- Flaky test detection: Automatically identifies tests that fail inconsistently.
- CI/CD integration: Embeds test health metrics directly into your build pipeline.
- Failure analysis: Uses AI to categorize failures by root cause (e.g., environment vs. bug).
Pros
- Provides visibility into a part of the DevOps cycle that is often a “black hole.”
- Helps maintain high deployment velocity by keeping test suites stable.
Cons
- Limited to testing data; does not monitor production infrastructure.
Best for: Teams with large automated test suites looking to improve build reliability.
Price Subscription-based; varies by plan.
Zabbix
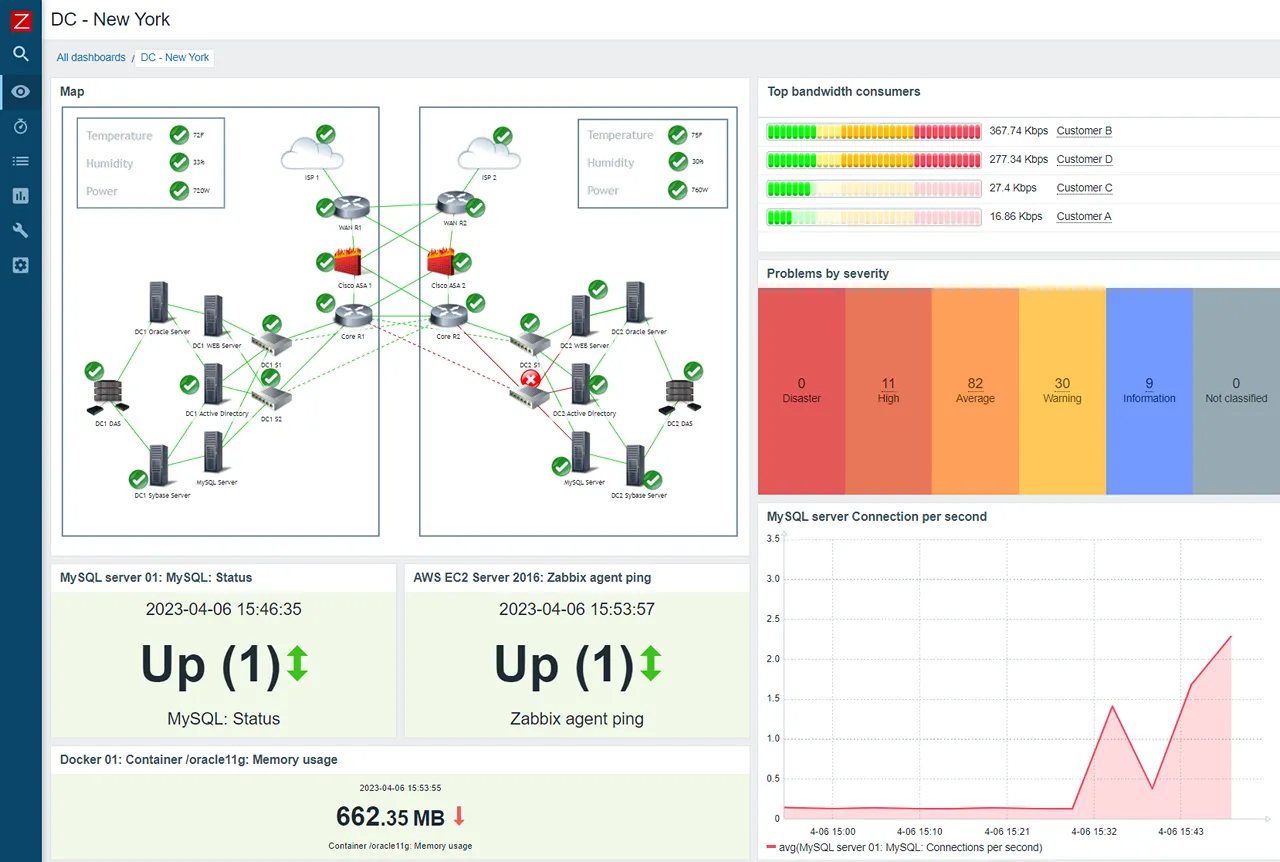
Zabbix is a mature, enterprise-grade open-source platform that excels at monitoring hybrid environments. It is highly scalable and can monitor anything from a modern cloud instance to a legacy network switch using its flexible polling and trapping architecture.
Key features
- Agent and agentless monitoring: Supports SNMP, JMX, and IPMI out of the box.
- Distributed monitoring: Use Zabbix proxies to monitor remote locations or private networks.
- Granular permissions: Excellent for multi-tenant environments.
Pros
- Completely free with no hidden licensing tiers.
- Proven reliability in massive, global environments.
Cons
- Dated UI: The interface feels like software from the 2000s.
- High configuration overhead; requires significant time to master.
Best for: Hybrid environments with a mix of modern and legacy infrastructure.
Price Free (Open Source).
Netdata
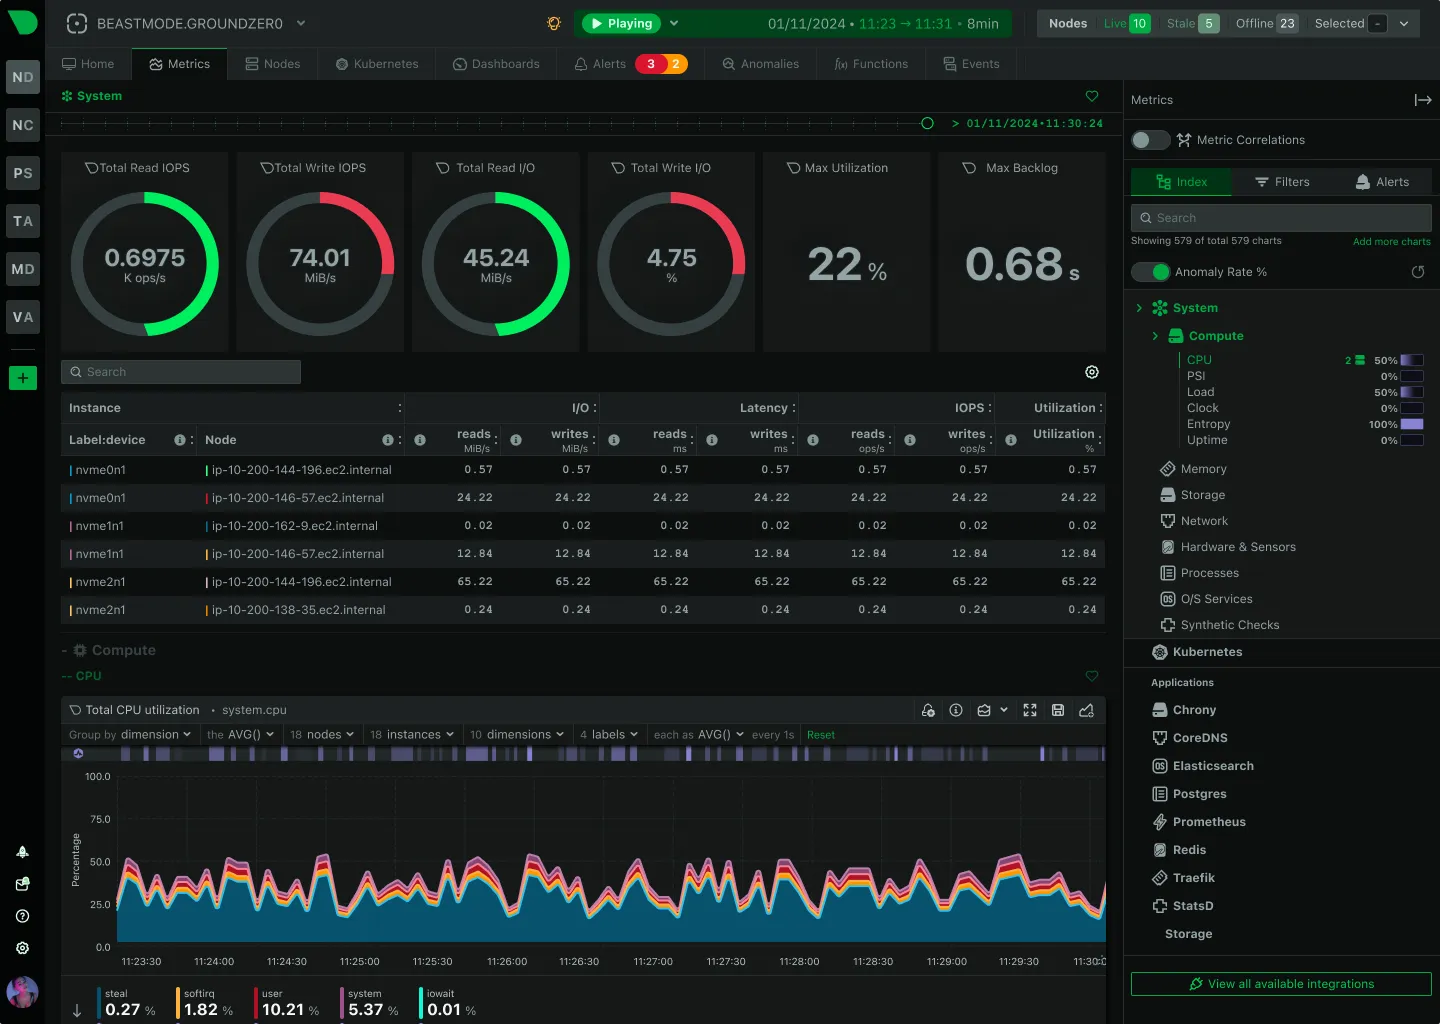
Netdata provides high-resolution, per-second monitoring for systems and applications. It is designed to be installed on every host, providing immediate, real-time dashboards for troubleshooting performance issues as they happen.
Key features
- 1-second resolution: See the impact of a process spike or network burst instantly.
- Anomaly detection: Uses machine learning to flag outliers without manual thresholds.
- Zero-config: Automatically detects running apps (like Nginx or Postgres) and starts monitoring.
Pros
- The fastest “time-to-value” for seeing real-time performance on a single box.
- Extremely low resource overhead.
Cons
- Node-centric: Historically harder to use for a global view of a large cluster.
- Log support is less mature than dedicated log platforms.
Best for: Real-time troubleshooting and low-level performance tuning.
Price Free (Open Source) for self-hosting; paid plans for the cloud dashboard.
Honeycomb
Honeycomb is built specifically for modern “observability,” which they define as the ability to debug unpredictable problems in complex distributed systems. It relies on high-cardinality data and distributed tracing to help you “slice and dice” events to find the needle in the haystack.
Key features
- High-cardinality support: Analyze data by unique IDs like user ID or request ID without performance hits.
- BubbleUp: Automatically highlights the differences between “normal” and “outlier” events.
- Distributed tracing: See the exact path of a single request across every microservice.
Pros
- Unmatched for finding the root cause of “weird” bugs in complex systems.
- Focuses on developer workflow rather than just “ops health.”
Cons
- Requires a shift in how you instrument and think about your data.
- Pricing is based on event volume, which can be difficult to predict.
Best for: Teams with complex microservices architectures and deep tracing needs.
Price Free tier available; paid plans based on event ingestion.
Evaluation criteria for DevOps monitoring tools
When choosing a tool for your DevOps stack, looking at the features list is only half the battle. You need to evaluate how the tool fits into your team’s operational reality.
Integration with CI/CD
A monitoring tool that doesn’t talk to your deployment pipeline is just a dashboard. Look for tools that can automatically mark deployments on your charts, so you can see the immediate impact of a code change.
Data correlation
The goal of DevOps monitoring is to reduce the “mean time to resolution” (MTTR). The fastest way to do that is to have metrics and logs in the same view. If you have to manually match timestamps between a metric tool and a separate log tool, you are wasting critical minutes during an outage.
Maintenance overhead
Every hour your team spends configuring monitoring is an hour they aren’t building your product. Small to medium teams should prioritize “zero-config” or SaaS-based tools. Only invest in building a custom Prometheus or ELK stack if you have the dedicated staff to maintain the underlying database and infrastructure.
Conclusion
DevOps monitoring is not about collecting the most data; it is about getting the best signal.
For teams that need full-stack visibility without the complexity, Simple Observability offers the fastest path to unified metrics and logs. If you are operating at a massive enterprise scale with deep security requirements, Datadog or Splunk are the industry standards. For those deep in the Kubernetes ecosystem who want total control, the Prometheus and Grafana stack remains the logical choice.
The right tool is the one that disappears into your workflow, only showing up when it has something important to tell you.