
New Relic is one of the longest-running names in application performance monitoring. It grew from an APM tool into a full-stack observability platform, and its code-level tracing is genuinely strong for teams debugging slow queries and inefficient functions.
The catch is the pricing model. New Relic moved to usage-based ingest pricing plus per-user seat fees, which means your bill depends on how much data you send and how many people need access. For teams that just want to know if their servers are healthy, that is a lot of APM overhead and a budget that scales with log volume. If you want something simpler, Simple Observability offers a fixed per-server price with metrics, logs, and alerts included.
This article covers the best alternatives to New Relic in 2026. We start with what New Relic does well and where it falls short, then the criteria for evaluating a replacement, and finally a comparison of each option. If you are comparing other tools, see our Datadog alternatives and Better Stack alternatives guides.
Quick summary
| Tool | Best For | Price Model |
|---|---|---|
| Simple Observability | Simplicity & predictable billing | $3 / mo / server |
| Datadog | Enterprise / full APM | $15+ / host / month |
| Prometheus & Grafana | Cloud Native / K8s | Free (OSS) / Managed paid |
| Zabbix | Network / On-Prem | EUR 50 / mo (Cloud) |
| SigNoz | Open-source unified observability | Free (OSS) / $49/mo (Cloud) |
| Checkmk | Complex IT / Hybrid | ~EUR 7.20 / host / month |
| Netdata | Real-time single-node | Free / ~$4.50/node/mo |
| Icinga | Flexible configuration | Free (OSS) |
New Relic Overview
Known for
New Relic is best known for deep APM. It gives developers code-level visibility into application performance, slow database queries, and inefficient functions, and it tracks end-user experience on web and mobile. For engineering teams focused on performance, it is a serious tool.
Key features
- Deep APM: Code-level tracing to pinpoint slow queries and functions.
- Browser and mobile: Native tracking of end-user experience (RUM).
- Applied intelligence: AI-driven anomaly detection and event correlation.
- Unified data platform: All telemetry (metrics, logs, traces) in one place.
Why look for a New Relic alternative?
While New Relic is strong for APM, several issues push teams to look elsewhere.
1. Usage-based pricing is hard to predict
New Relic charges per GB ingested plus per-user seat fees. Log volume is hard to control, and a sudden spike can balloon your bill. The per-user model also makes costs climb as your team grows, since every person who needs access is another seat.
2. Per-user seat friction
Full access requires paid seats ($99/mo per additional full-platform user on Standard, $349/user annually on Pro). In practice this means teams limit who can see monitoring data, which is the opposite of what observability should achieve. Everyone should be able to look at the dashboard.
3. APM is more than you need
If you run infrastructure (servers, databases, cron jobs) rather than distributed applications, New Relic’s core strength is wasted. You end up paying for code-level tracing you never exercise.
4. Platform complexity
New Relic’s UI is vast and can overwhelm teams with simple needs. For a team that wants CPU, disk, and log alerts, the platform’s depth becomes friction.
How to choose an alternative?
When comparing New Relic competitors, focus on what actually shapes your bill and workflow.
- Pricing model: Decide whether usage-based pricing works for your log volume. If not, look for per-server or flat-rate pricing.
- Seat policy: Check whether every team member can view dashboards without a paid seat.
- APM vs infrastructure: Pick a tool that matches your actual needs. Do not pay for tracing if you only monitor servers.
- Time-to-value: How fast can you get a working dashboard? Some tools take minutes, others take weeks.
8 Best New Relic Alternatives
1. Simple Observability
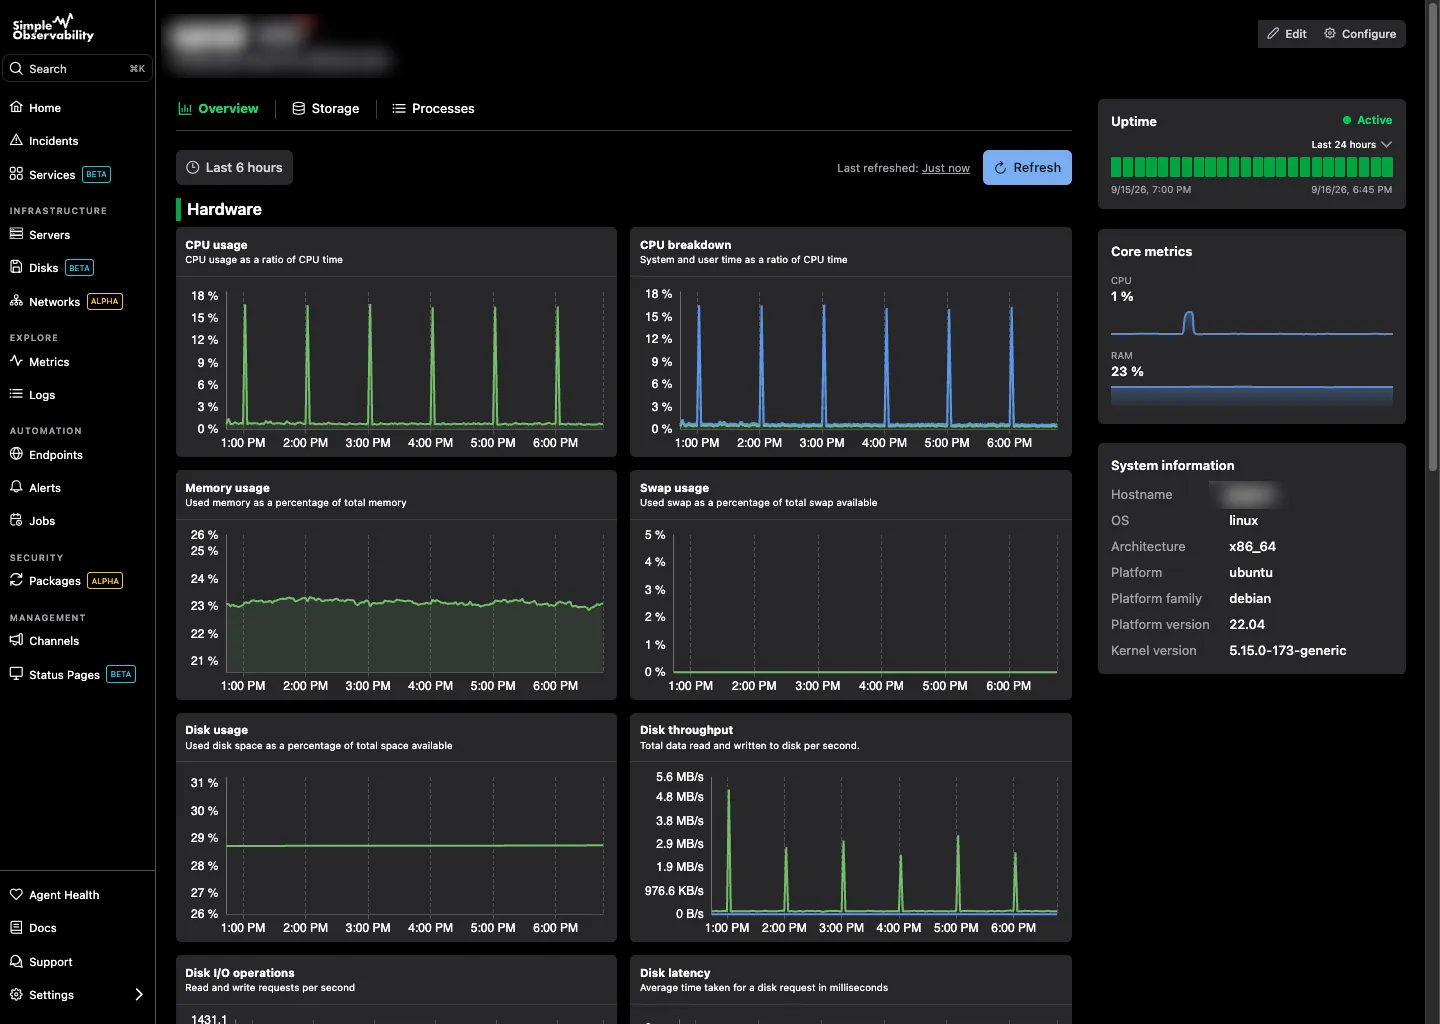
Simple Observability is designed for teams that want the operational picture without APM complexity or usage-based billing. It combines metrics, logs, and alerts in one dashboard, installed with a single command, at a fixed per-server price.
Key features
- Unified dashboard: CPU and memory spikes alongside application logs.
- Zero-config alerts: Sensible defaults from day one, no YAML required.
- Lightweight agent: An open-source agent that respects server resources.
- No seat fees: Anyone on the team can view dashboards without a per-user charge.
Simple Observability vs New Relic Where New Relic charges per GB ingested and per user seat, Simple Observability charges a single fixed fee per server with a generous usage allowance. You do not pay an APM premium or limit who can see the data.
Pros
- Predictable pricing: Flat fee per server. No ingest spikes, no per-user surprises.
- Extremely easy to use: One-command install, zero configuration.
- Full historical data: Long-term retention included by default.
Cons
- No distributed tracing: It is infrastructure monitoring, not an APM platform. If you need code-level traces, this is not a New Relic APM replacement.
Best for: Teams running servers and services (not microservice tracing) who want predictable monitoring.
Price
- Free: $0 for 1 server.
- Paid: $3/mo per server for unlimited servers.
- Custom: Volume discounts for large fleets.
2. Datadog
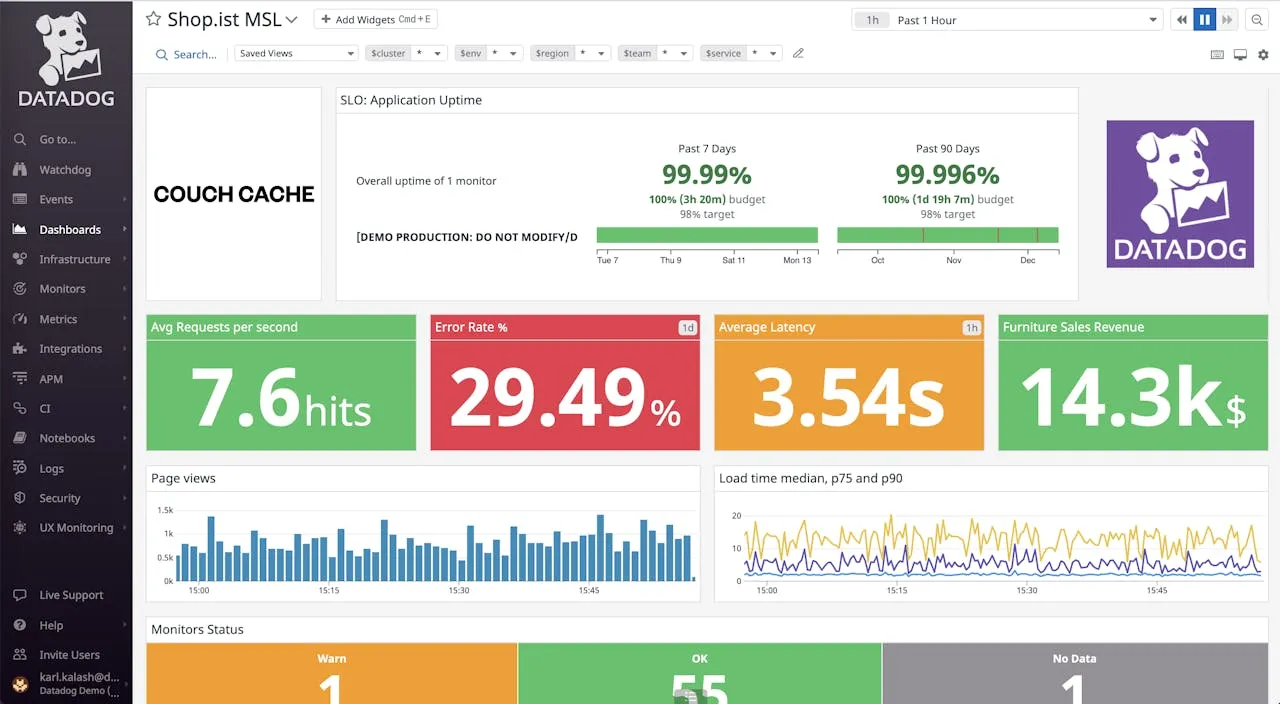
Datadog is the closest direct competitor to New Relic in scope, covering infrastructure, APM, logs, and more in a single platform. Its UI is widely considered more polished, and its integration catalog is broader.
Key features
- Full-stack observability: Unified correlation across traces, logs, and metrics.
- Watchdog AI: Automated anomaly detection.
- 400+ integrations: Point-and-click setup for most cloud and SaaS tools.
Pros
- Polished UI: Fast, intuitive, and genuinely pleasant to use.
- Deep visibility: APM and tracing depth is unmatched.
Cons
- Expensive: Infamously costly. Per-host price is just the start; logs, custom metrics, and retention add up.
- Vendor lock-in: Proprietary agent and data format make leaving hard.
Best for: Large enterprises and high-growth tech companies where engineering velocity matters more than the bill.
Price Infrastructure starts at $15/host/mo. APM, logs, and custom metrics are billed separately, often doubling the base cost.
3. Prometheus & Grafana
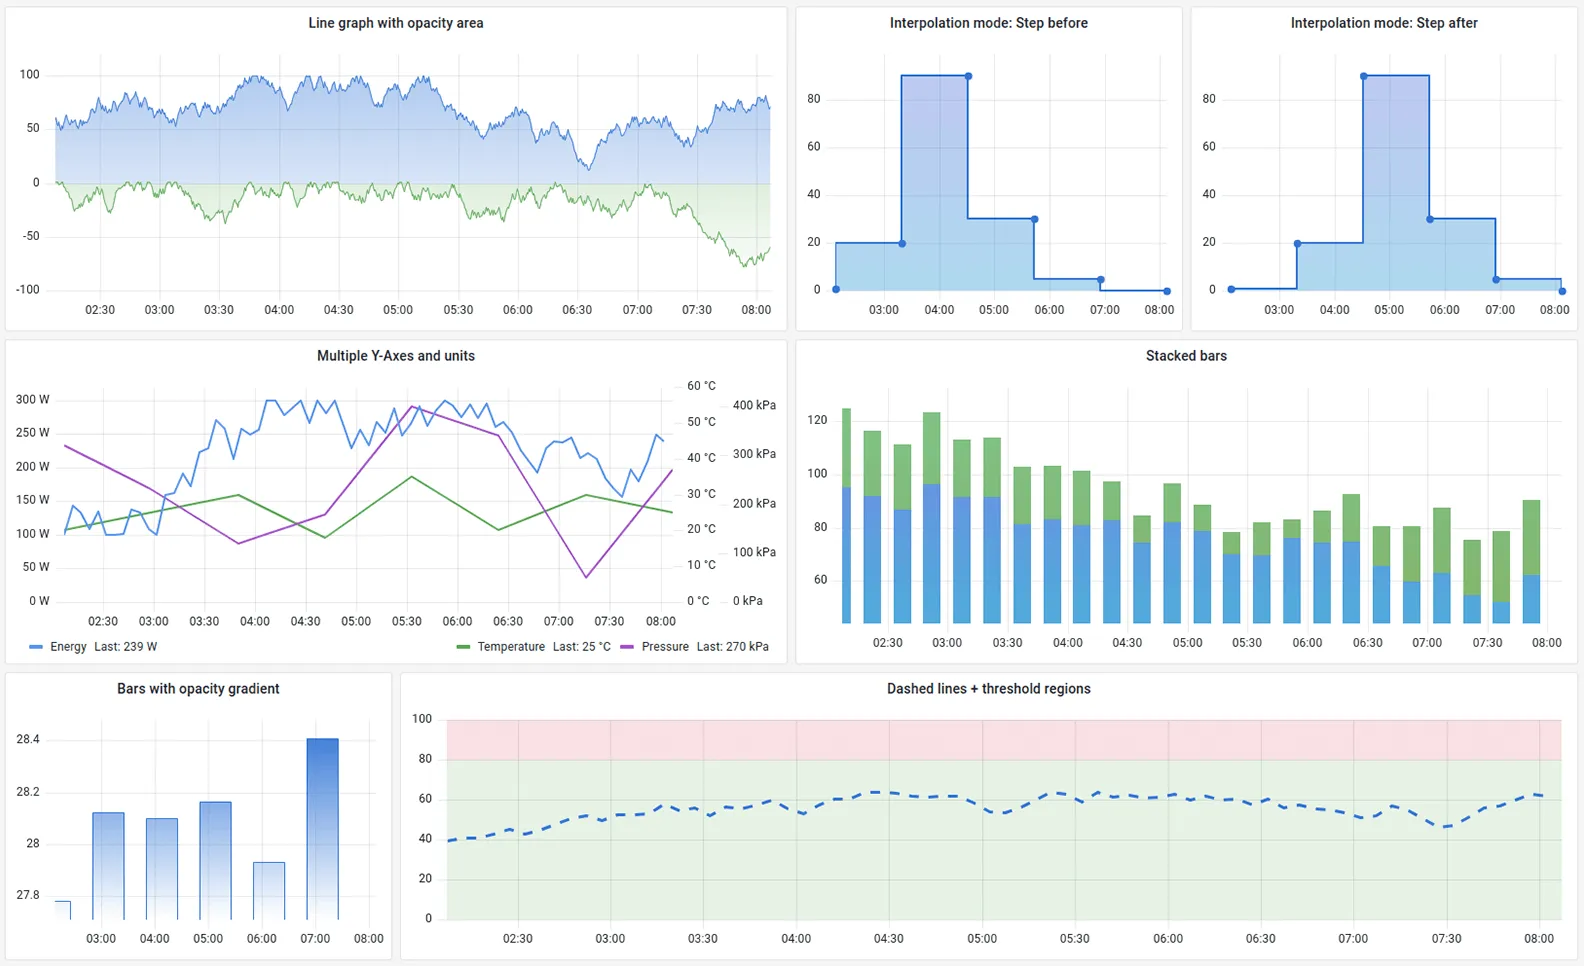
Prometheus paired with Grafana is the open-source standard for cloud-native monitoring. It is free if you host it yourself and is the default choice for Kubernetes teams.
Key features
- Multi-dimensional data model: Powerful queries with PromQL.
- Huge ecosystem: Exporters for almost every piece of software.
- Alertmanager: Sophisticated alert routing and grouping.
Pros
- Industry standard: The de facto choice for Kubernetes monitoring.
- Open source: Completely free to self-host.
- Flexibility: Build any dashboard imaginable in Grafana.
Cons
- Complexity: You maintain Prometheus, Grafana, and storage extensions for long-term retention.
- No logs: Metrics only. You need a separate stack for logs.
- Steep learning curve: PromQL takes time to master.
Best for: Kubernetes environments and platform engineering teams with SRE resources.
Price Free (open source). Managed options like Grafana Cloud are usage-based.
4. Zabbix
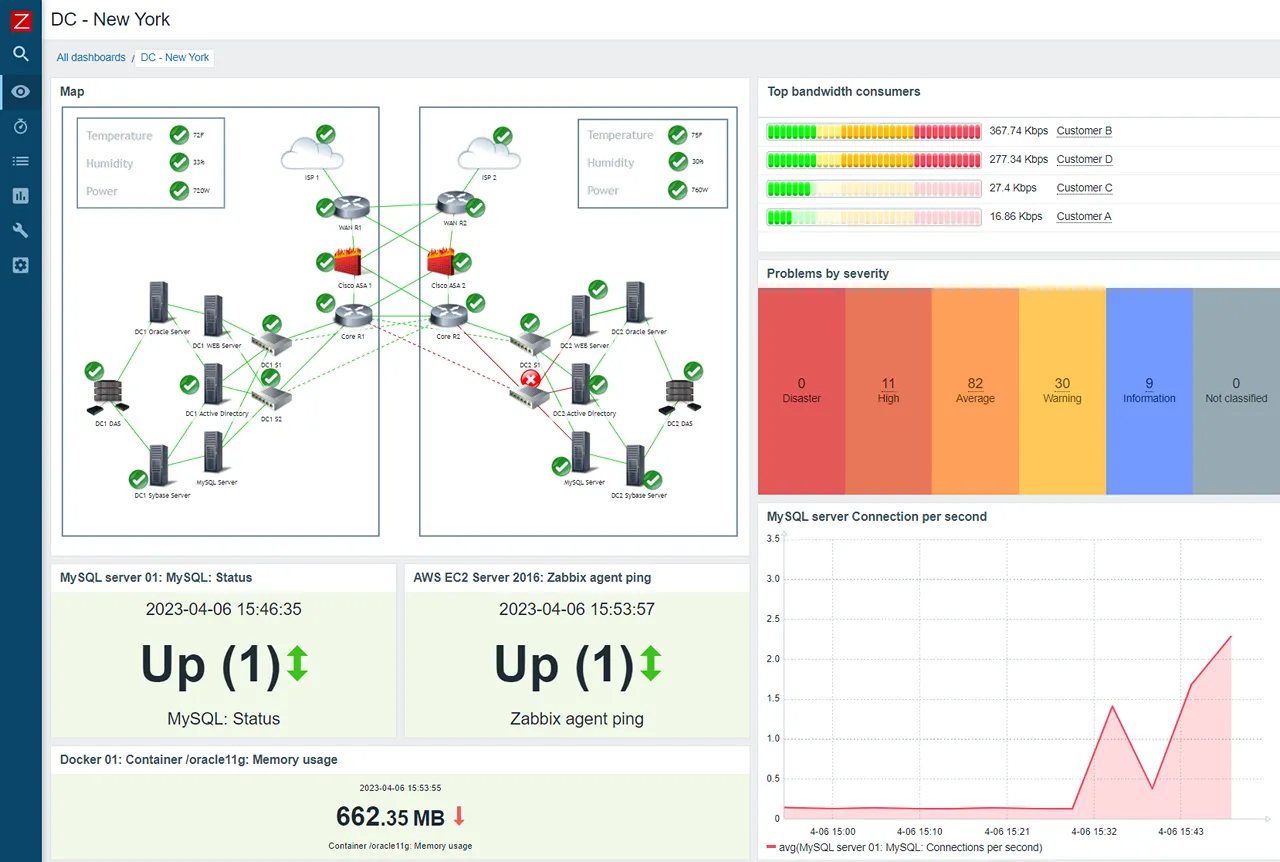
Zabbix is a mature, enterprise-grade open-source platform favored by network engineers and large traditional enterprises. It focuses on agents, SNMP, and on-premises infrastructure rather than APM.
Key features
- Agent and agentless: Monitor via SNMP, JMX, IPMI, or its own agent.
- Push and pull: Supports polling and trapping.
- Granular permissions: Strong multi-tenancy and user controls.
Pros
- Proven: Battle-tested in massive environments for decades.
- Open source: No feature-gated tiers.
- SaaS option: Zabbix Cloud offers a managed path.
Cons
- Complexity: Configuration is verbose (XML templates).
- Not APM: Like Simple Observability, it is infrastructure, not application tracing.
Best for: NOCs, MSPs, and organizations with heavy on-prem infrastructure.
Price Free to self-host. Zabbix Cloud starts at EUR 50/month.
5. SigNoz
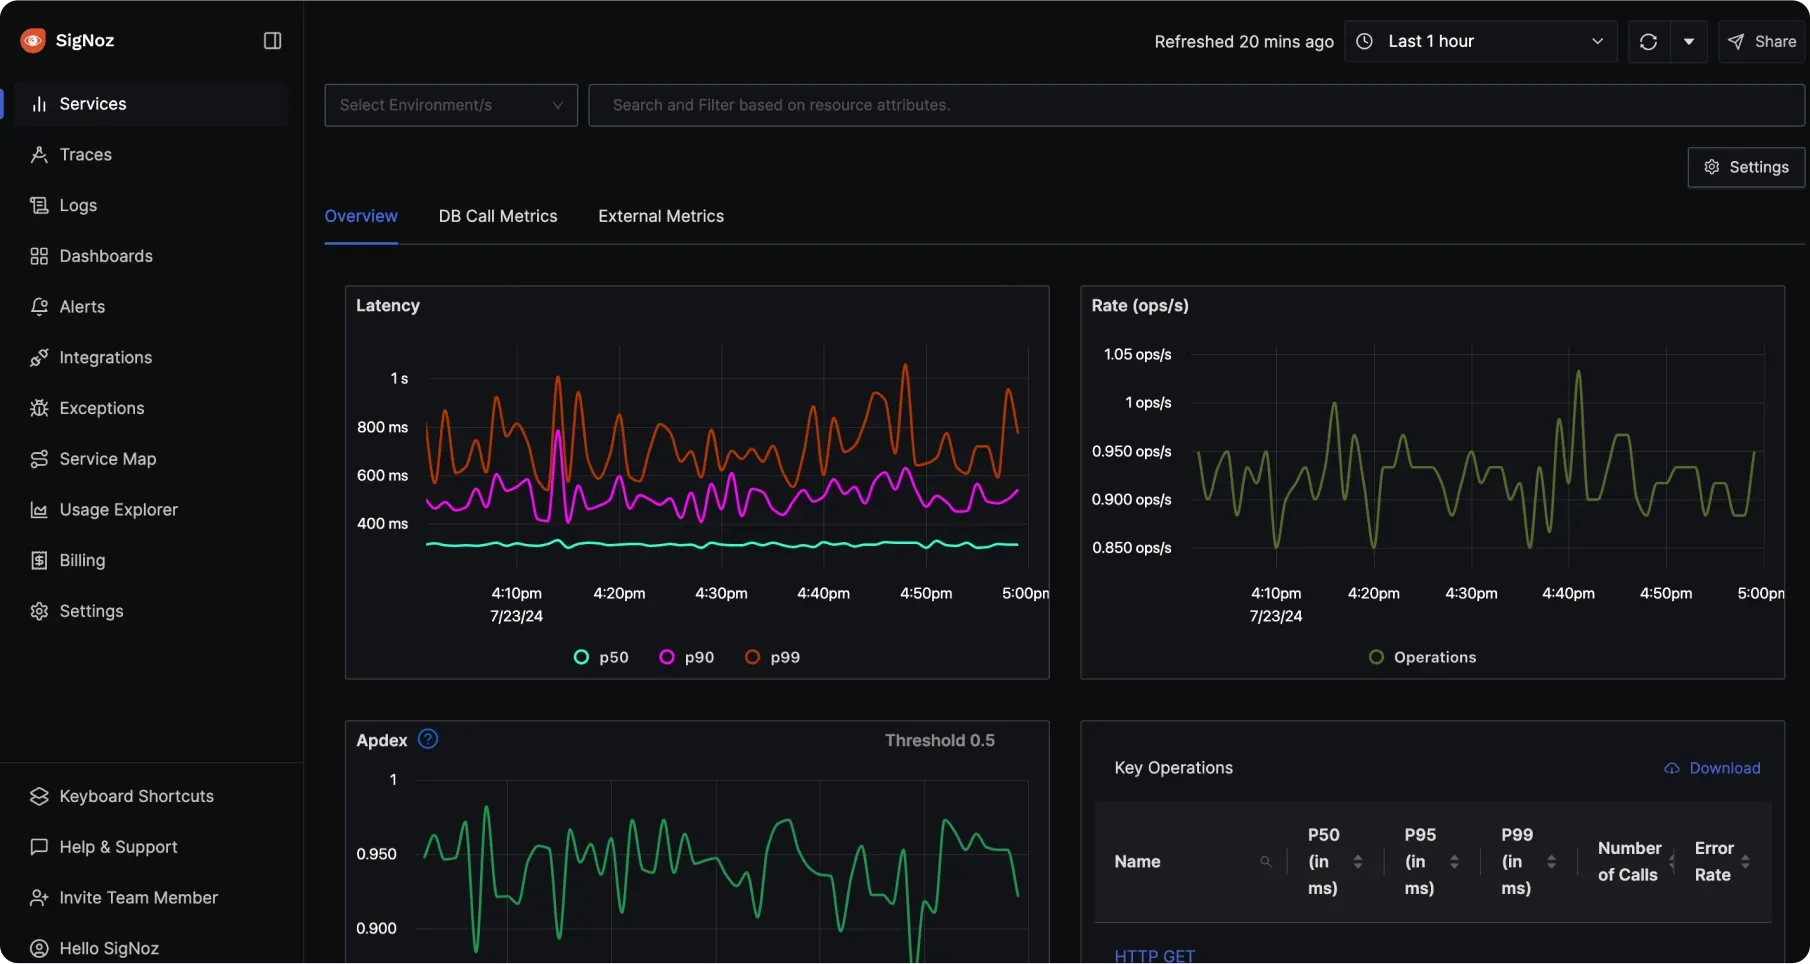
SigNoz is an open-source observability platform built on OpenTelemetry and ClickHouse. It unifies metrics, logs, and traces, making it a self-hostable alternative to New Relic’s scope.
Key features
- Metrics, logs, and traces: All three pillars in one place.
- OpenTelemetry native: Broad language and framework support.
- ClickHouse backend: Fast queries at scale.
Pros
- Self-hostable: Keep data on your own infrastructure.
- Open-source alternative to New Relic APM: Tracing included, unlike most infrastructure tools.
Cons
- Newer project: Smaller community than New Relic or Datadog.
- Self-hosting ClickHouse: Adds operational complexity.
Best for: Teams that want a self-hosted, open-source alternative to New Relic with full-stack observability.
Price Self-hosted is free. SigNoz Cloud starts at $49/month (usage-based).
6. Checkmk
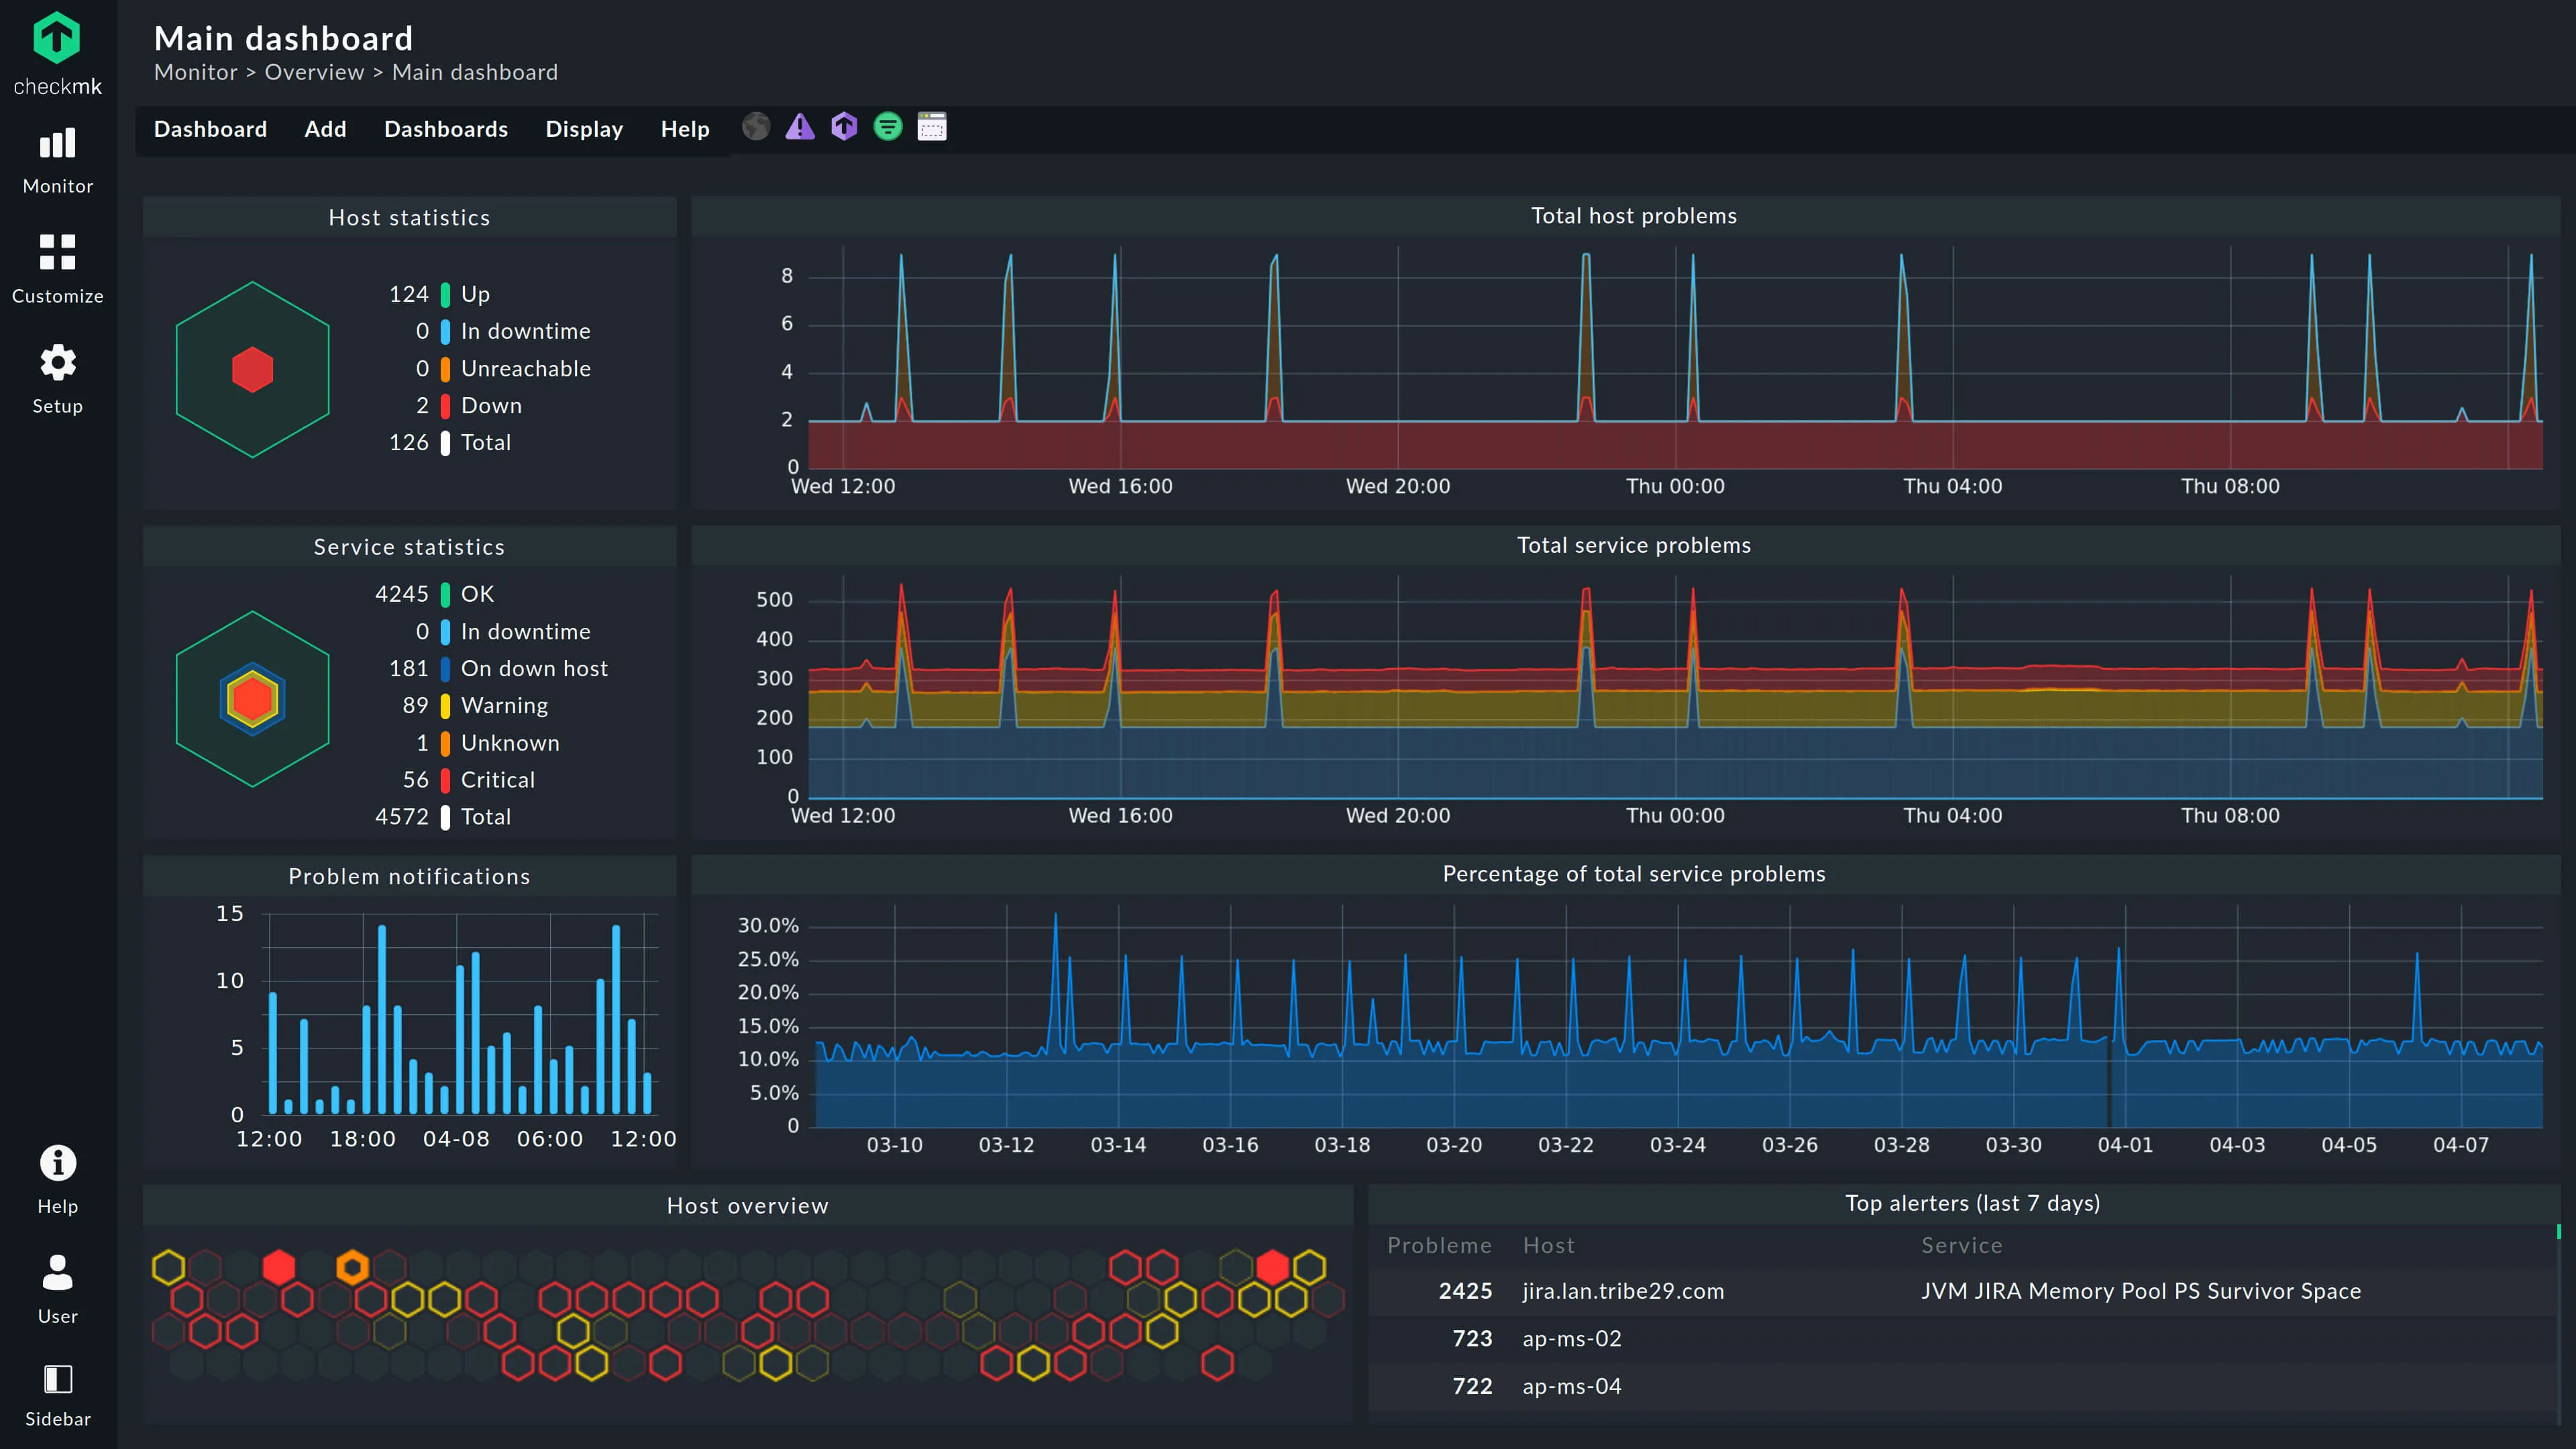
Checkmk is a comprehensive monitoring tool that excels in complex, hybrid IT environments. It bridges Nagios-style checks and modern metric collection.
Key features
- Hybrid monitoring: Bare metal, switches, and Docker containers.
- Automatic service discovery: Scans hosts and configures checks.
- 2,000+ plugins: A massive library of integrations.
Pros
- All-in-one: Handles state checks and metric performance.
- Scalable: Thousands of services on a single server.
Cons
- UI feels dated: Functional but cluttered.
- Steep learning curve: Advanced features take time.
Best for: Sysadmins managing a mix of legacy hardware, on-prem servers, and cloud instances.
Price Open Source edition is free. Pro starts at EUR 190/month (billed annually) for ~100 hosts (~3,000 services). SaaS starts at ~EUR 7.20 per host/month.
7. Netdata
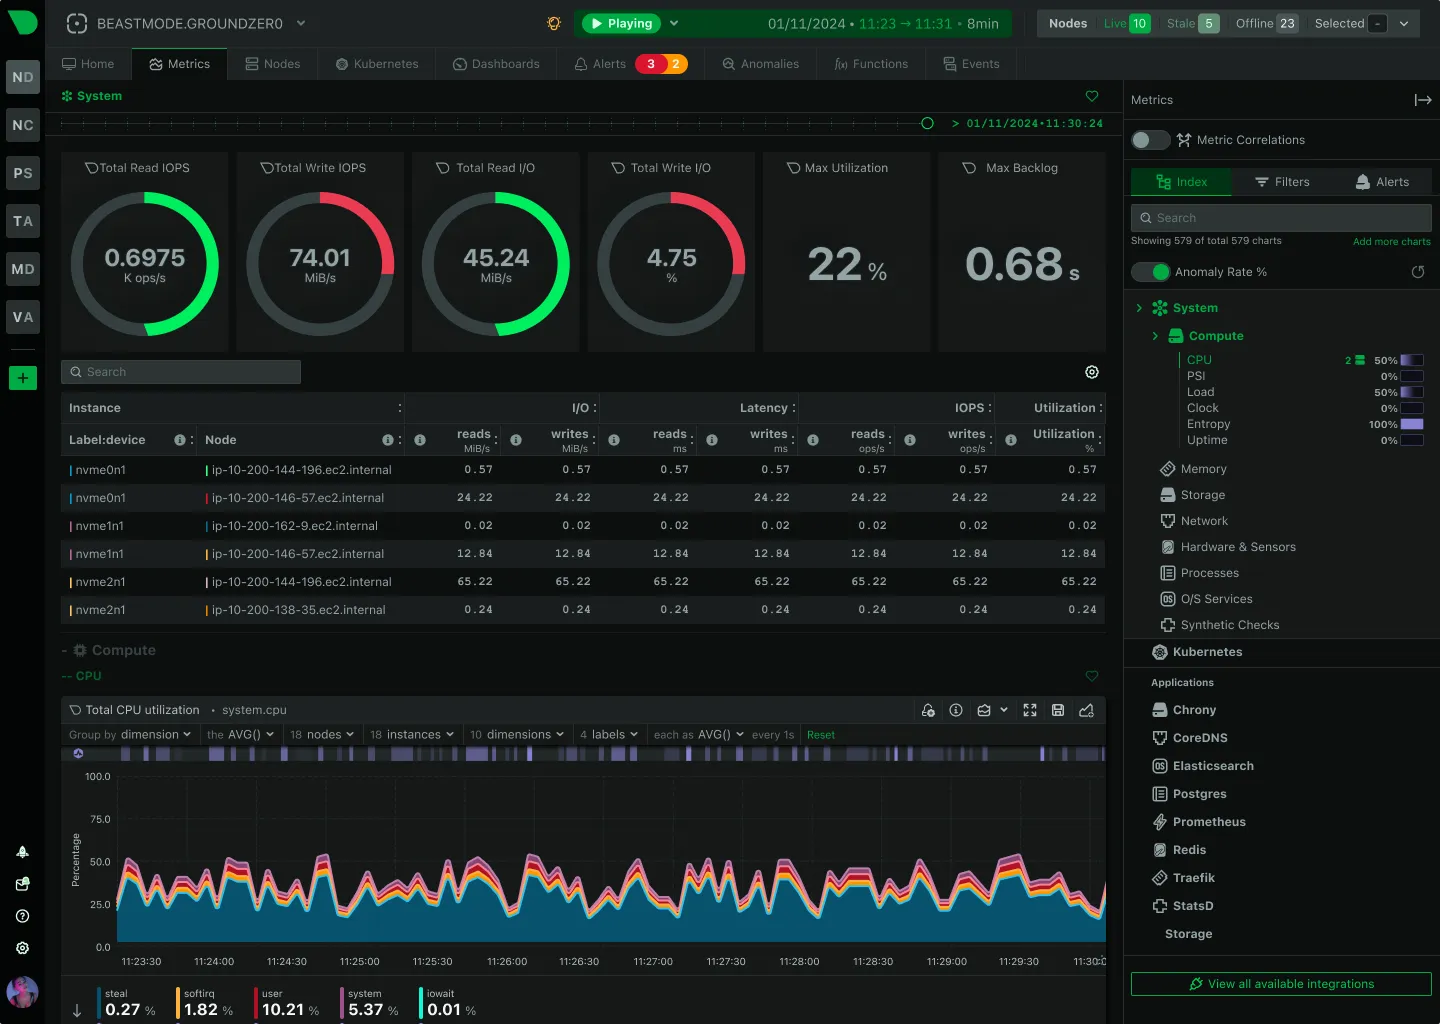
Netdata focuses on real-time, high-resolution single-node monitoring with per-second granularity. It auto-detects everything on the host, the opposite of New Relic’s centralized APM model.
Key features
- Real-time metrics: Second-level granularity.
- Unsupervised ML: Built-in anomaly detection.
- Auto-discovery: Automatically detects services and apps.
Pros
- Instant visibility: Hundreds of charts the moment you install the agent.
- Great single-node troubleshooting: High-resolution data is genuinely useful.
Cons
- Scaling complexity: Fleet-wide aggregation needs more configuration.
- Higher resource usage: On-host ML and high-res data cost CPU and RAM.
- Logs still maturing: Newer than New Relic’s log management.
Best for: Teams that want instant, high-resolution visibility into individual servers.
Price Free for up to 5 nodes. Business plans start around $4.50/node/month.
8. Icinga
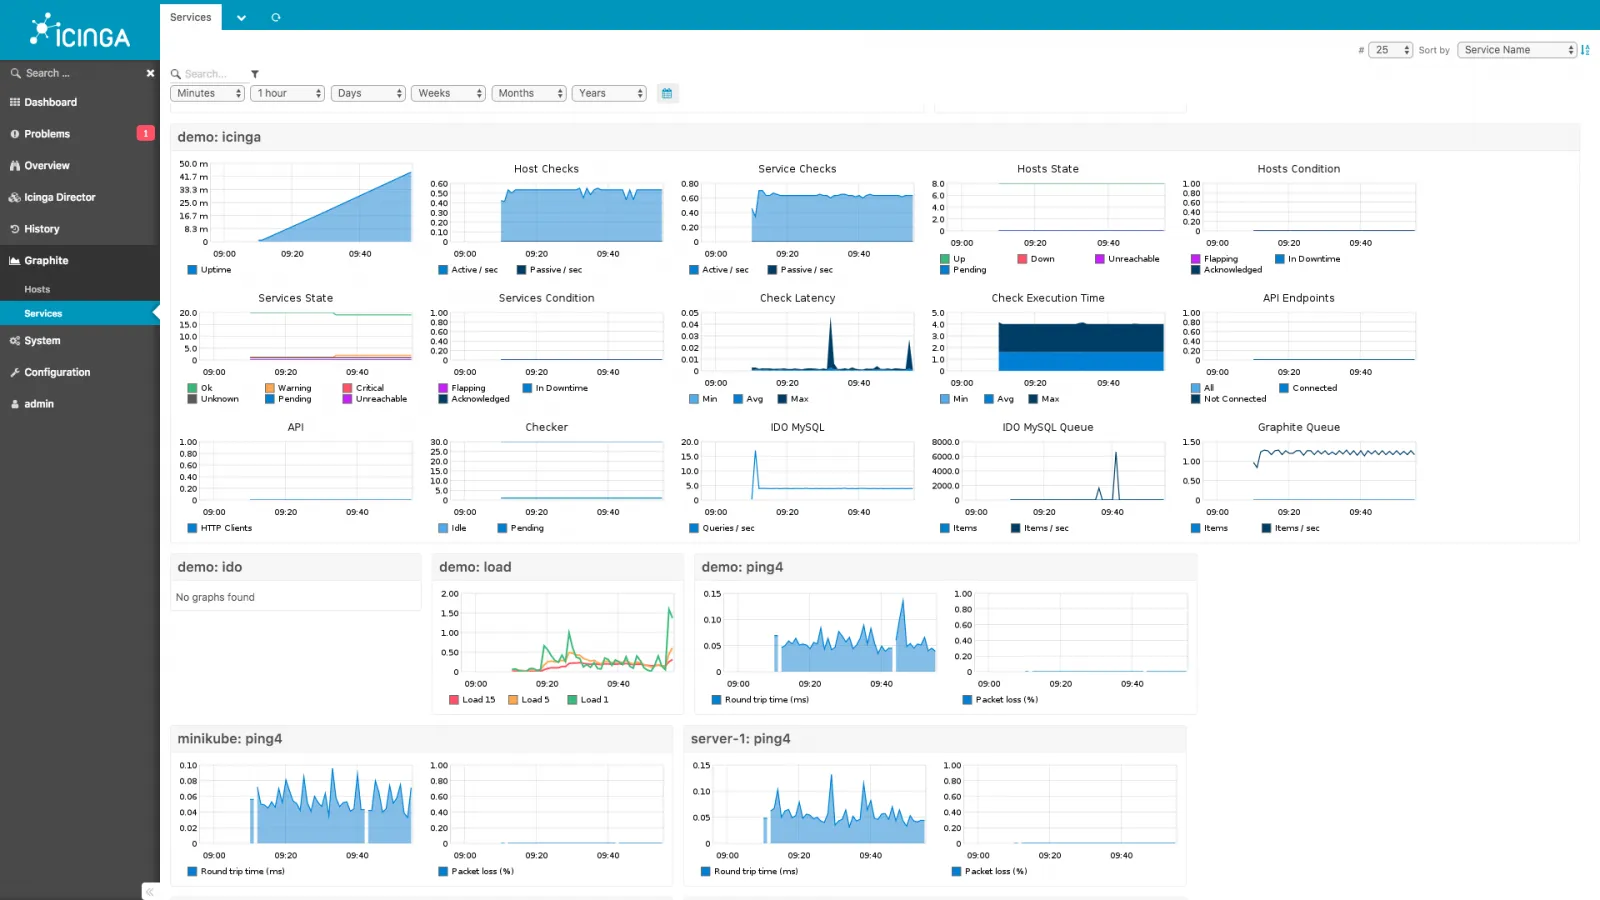
Icinga is a Nagios fork that modernized the classic monitoring approach. It keeps Nagios plugin compatibility while adding a modern web interface, an API, and distributed monitoring support.
Key features
- Icinga Director: A web-based tool to manage configuration.
- Distributed monitoring: Built-in support for distributed setups and HA.
- Plugin compatibility: Works with thousands of Nagios plugins.
Pros
- Modernized classic: Nagios reliability with a better UI and API.
- Commercial support: Available for enterprise deployments.
Cons
- Setup effort: Still requires significant configuration compared to SaaS tools.
- Learning curve: The configuration language and object model take time.
Best for: Sysadmins who like Nagios flexibility but want a more modern, API-driven tool.
Price Free (open source). Commercial support available.
Conclusion
New Relic is a strong APM platform if you need code-level tracing and your budget can absorb usage-based ingest and per-user seat fees. But for teams that mainly run infrastructure, that model turns monitoring into an unpredictable expense.
- For predictable billing and simplicity: Try Simple Observability. A fixed per-server price for metrics, logs, and alerts.
- For full APM and a polished UI: Datadog is the closest scope, at a higher price.
- For Kubernetes and cloud-native: Prometheus + Grafana is the open-source standard.
Choose the tool that fits what your team actually monitors. For a head-to-head breakdown, see our New Relic comparison page, and for another angle, our Zabbix alternatives guide covers the on-prem side.