
- Server monitoring is the ongoing, automated practice of checking a server's availability, performance, and resource use, so problems surface before users notice them.
- It works on two layers: availability (is the server up and fast) and resources (CPU, memory, disk, network).
- Tools come in two families: agent-based (deep, runs on the server) and agentless (external, sees what users see). Most setups use both.
- Good alerting is narrow: unreachability, sustained resource saturation, error spikes, and expiring certificates.
A server can fail quietly. A disk fills up overnight, a memory leak slowly pushes the system into swap, and the first visible sign is a user report the next morning. At that point the incident has already happened.
Server monitoring exists to move that moment earlier. It watches the machine continuously, so you get a warning while the problem is still small, and a clean timeline when you need to reconstruct what happened.
This guide covers what server monitoring is, what it actually checks, the agent-based and agentless approaches, and what to alert on. If you already know the fundamentals and are comparing options, our best server monitoring tools roundup is the better starting point.
What is server monitoring?
Server monitoring is the ongoing, automated practice of checking a server’s availability, performance, and resource use.
The important word is ongoing. A one-off check tells you the server was fine at 2 pm. Monitoring tells you it was fine at 2 pm, started degrading at 2:40, and became unreachable at 3:15. That timeline is what turns a mysterious outage into a diagnosable incident.
Under the hood, server monitoring is a small pipeline. A collector takes measurements on a schedule, a store keeps them as time series, and an interface shows what is happening now and what happened last week. When a measurement crosses a threshold, an alert goes out.
The point is to catch failures while they are still cheap. Downtime rarely happens in isolation: most outages start at the system level, as a disk that filled, a process that leaked, or a load average nobody was watching. Monitoring is how you see those early signs without SSH-ing into every box by hand.
What does server monitoring check?
Server monitoring splits into two layers, and both matter. The first answers “is the server working?”. The second answers “is the server about to stop working?”
The availability layer
Availability checks run from outside and ask the questions your users are silently asking: is the server reachable, how fast does it answer, is the service behind a given port actually working.
A ping confirms the machine responds. An HTTP check confirms the web server answers. A port check confirms PostgreSQL is accepting connections.
Because these checks run from outside the server, they see what your users see. They catch problems an on-server agent can never observe: a DNS misconfiguration, a routing issue in one region, a firewall rule that only blocks some networks.
The resource layer
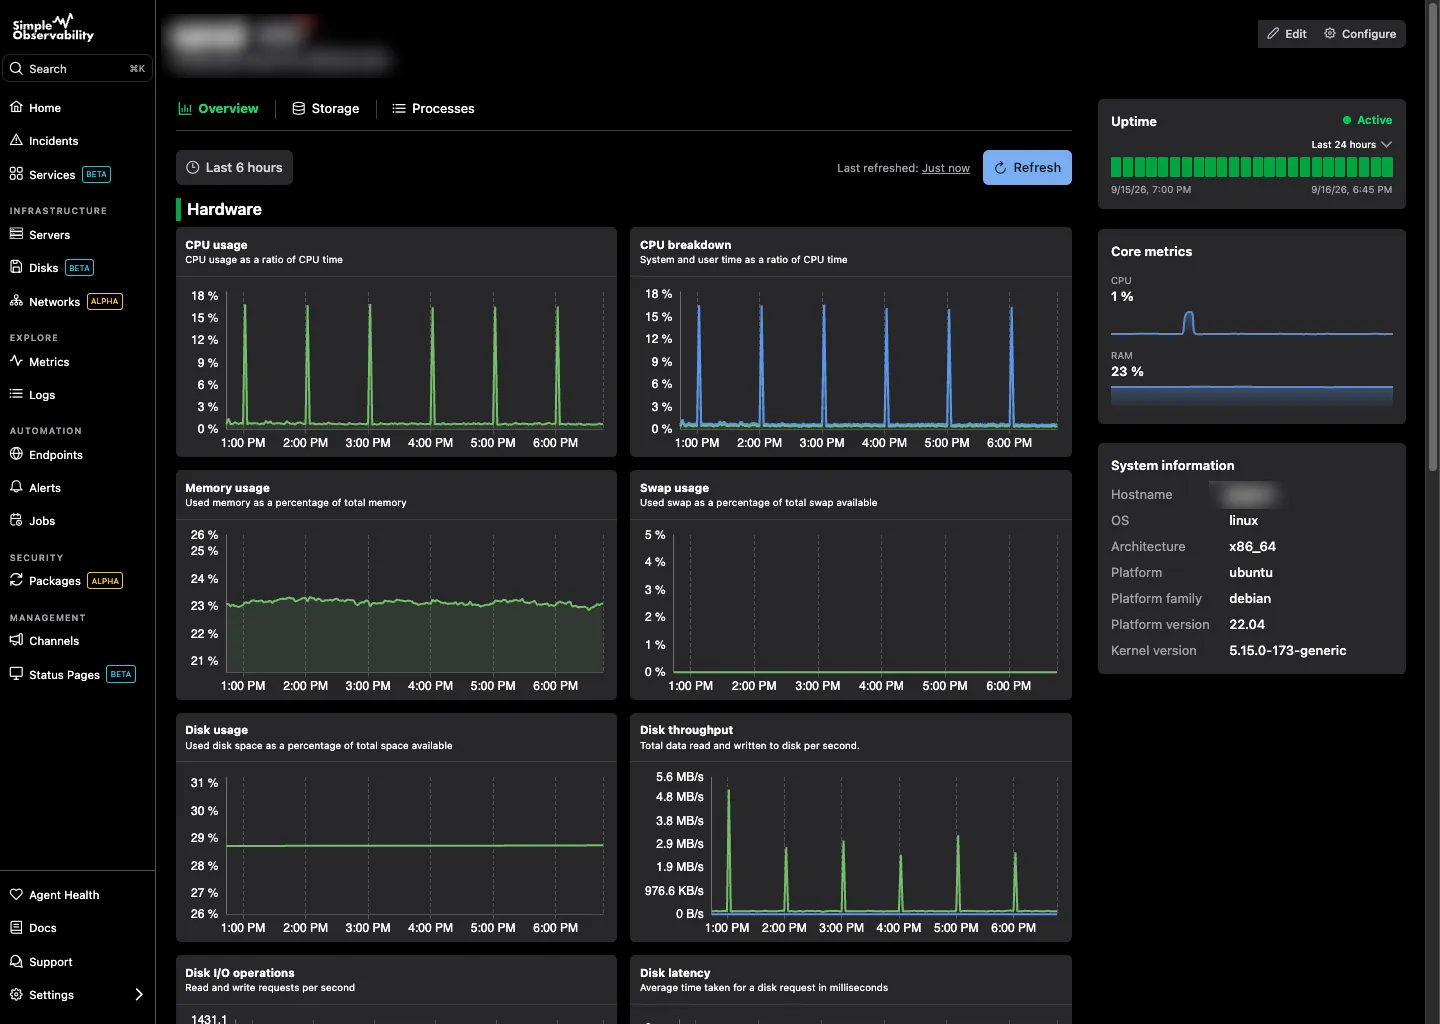
The resource layer watches what every service on the machine shares: CPU, memory, disk, and network. A server can be technically up and minutes away from an outage when one of them runs out.
CPU saturation slows every process on the machine. Memory exhaustion triggers swapping, and a swapping server feels dead while being technically alive. A full disk breaks writes: databases fail, logs stop, cron jobs crash. Network saturation shows up as latency and timeouts even when every service is healthy.
Metrics tell you what happened. Logs often tell you why. Authentication failures, OOM killer events, and service crashes surface in system logs before they show up anywhere else. If you run Linux, our Linux log monitoring guide covers that side in depth.
How to monitor a server
The fastest way to understand server monitoring is to point it at a real machine. With Simple Observability, the whole setup takes about two minutes:
-
Create an account. The free plan covers one server, no credit card required.
-
Install the agent. One command on the server you want to watch:
curl -fsSL https://simpleobservability.com/install.sh | sudo bash -s -- <SERVER KEY>The agent is a single, self-contained binary with no runtime dependencies. It pushes metrics and logs outbound over HTTPS, so the server opens no inbound ports.
-
Watch the dashboards fill. The agent auto-detects what runs on the machine (NGINX, Docker, PostgreSQL) and populates predefined charts. CPU, memory, and disk views exist from the first minute.
-
Add endpoint checks. For the availability layer, add HTTP checks on your websites and APIs from the same dashboard.
-
Set alerts. Alert rules live in the web UI, with ready-made templates for the common cases: disk above 90%, memory exhausted, endpoint down.
From there the server watches itself and you hear about it only when something crosses a line. Paid plans run $3 per server per month, and the agent is open source.
Agent-based vs agentless monitoring
Monitoring tools fall into two families, and the split decides what you can see.
Agent-based monitoring installs a small program on the server itself. The agent reads internal metrics directly: CPU, memory, disk, processes, service states, and often logs. It can go deep because it lives on the machine. The trade-off is operational: you install and update it on every server, and it cannot see what outside users experience.
Agentless monitoring tests the server from outside, the way a real visitor would. It sends an HTTP request, a ping, or a port connection and measures what comes back. Nothing to install or keep updated. It answers “is it up, and how fast” perfectly, but it cannot tell you why it is slow, because it cannot see CPU or memory.
Most real setups use both, and the two pair naturally. Agentless checks tell you there is a problem users can feel. Agent data tells you what is causing it. In Simple Observability, the server agent covers the inside view and endpoint checks cover the outside one, in the same dashboard.
What to alert on
A monitoring setup is only as useful as the alerts it triggers. Alerting on everything trains everyone to ignore notifications, so keep the baseline narrow.
Unreachability. The server or site stops responding, confirmed by a recheck or a second location before anyone gets paged. One failed check from one location is often a network hiccup.
Sustained resource saturation. CPU, memory, or disk above a threshold for several minutes, not a one-minute spike. Spikes are normal. Plateaus are problems.
Error rate spikes. A jump in 5xx responses or a drop in successful requests usually surfaces broken code or an overloaded dependency faster than any resource metric.
Expiring certificates and domains. The most embarrassing outage there is, and the easiest to prevent. Alert a month out, not a week.
Escalation matters as much as thresholds. A first alert to whoever is on call, escalating to the rest of the team if nobody acknowledges it, keeps real incidents from sitting unread. And every alert should be actionable. If the honest response to an alert is “ignore it, it always does that”, delete the alert.
Conclusion
Server monitoring does not need to be a big project. Start with the two layers that catch most incidents: availability checks on everything users touch, and core resource metrics on every machine you own. Add logs and deeper instrumentation only when a specific problem demands them.
From there it compounds. Every alert that fires correctly buys back an outage, and every timeline you reconstruct gets easier to build.
If you are deciding what to install, our comparison of the five best tools covers solid options at every budget. To go deeper on the practice itself, read why server monitoring matters. For hands-on setup on the most common platform, see our Linux server monitoring guide.