
Finding a monitoring tool that covers your entire stack without creating a second job for your team is harder than it looks. Here are the top 10 solutions compared.
Most infrastructure monitoring projects fail not because the tool lacked features, but because the team lacked the time to maintain it. In 2026, the gap between cloud-native systems and on-prem legacy hardware is wider than ever. You need a solution that bridges this gap while keeping configuration to a minimum.
The market is split between enterprise giants that cost a fortune and open-source tools that require significant manual effort. This list focuses on the tools that offer the best “time to visibility” across hybrid environments.
What makes a modern IT infrastructure monitoring solution?
A modern solution must go beyond simple ICMP pings. It needs to correlate metrics, logs, and traces in a single view to reduce the mean time to resolution (MTTR).
In 2026, the non-negotiables are auto-discovery, lightweight agents, and hybrid support. If you have to manually update your monitoring every time you spin up a cloud instance, your solution is already outdated.
Quick summary
| Tool | Best for | Price model |
|---|---|---|
| Simple Observability | Simplicity & zero config | $3 / mo / server |
| Datadog | Enterprise / Cloud | $15+ / host / month |
| Prometheus & Grafana | Cloud native / K8s | Free (OSS) / Managed paid |
| Zabbix | Network / On-prem | $50 / mo (Cloud) |
| New Relic | App performance (APM) | Usage based ($0.30/GB) |
| LogicMonitor | Hybrid / Mid-market | Custom |
| Checkmk | Complex IT / Hybrid | ~$6 / host / month |
| Site24x7 | SMB / SaaS | From $9 / mo |
| Netdata | Real-time troubleshooting | Free (OSS) / Cloud paid |
| Nagios XI | Legacy environments | $2,495+ (license) |
10 best IT infrastructure monitoring solutions
1. Simple Observability
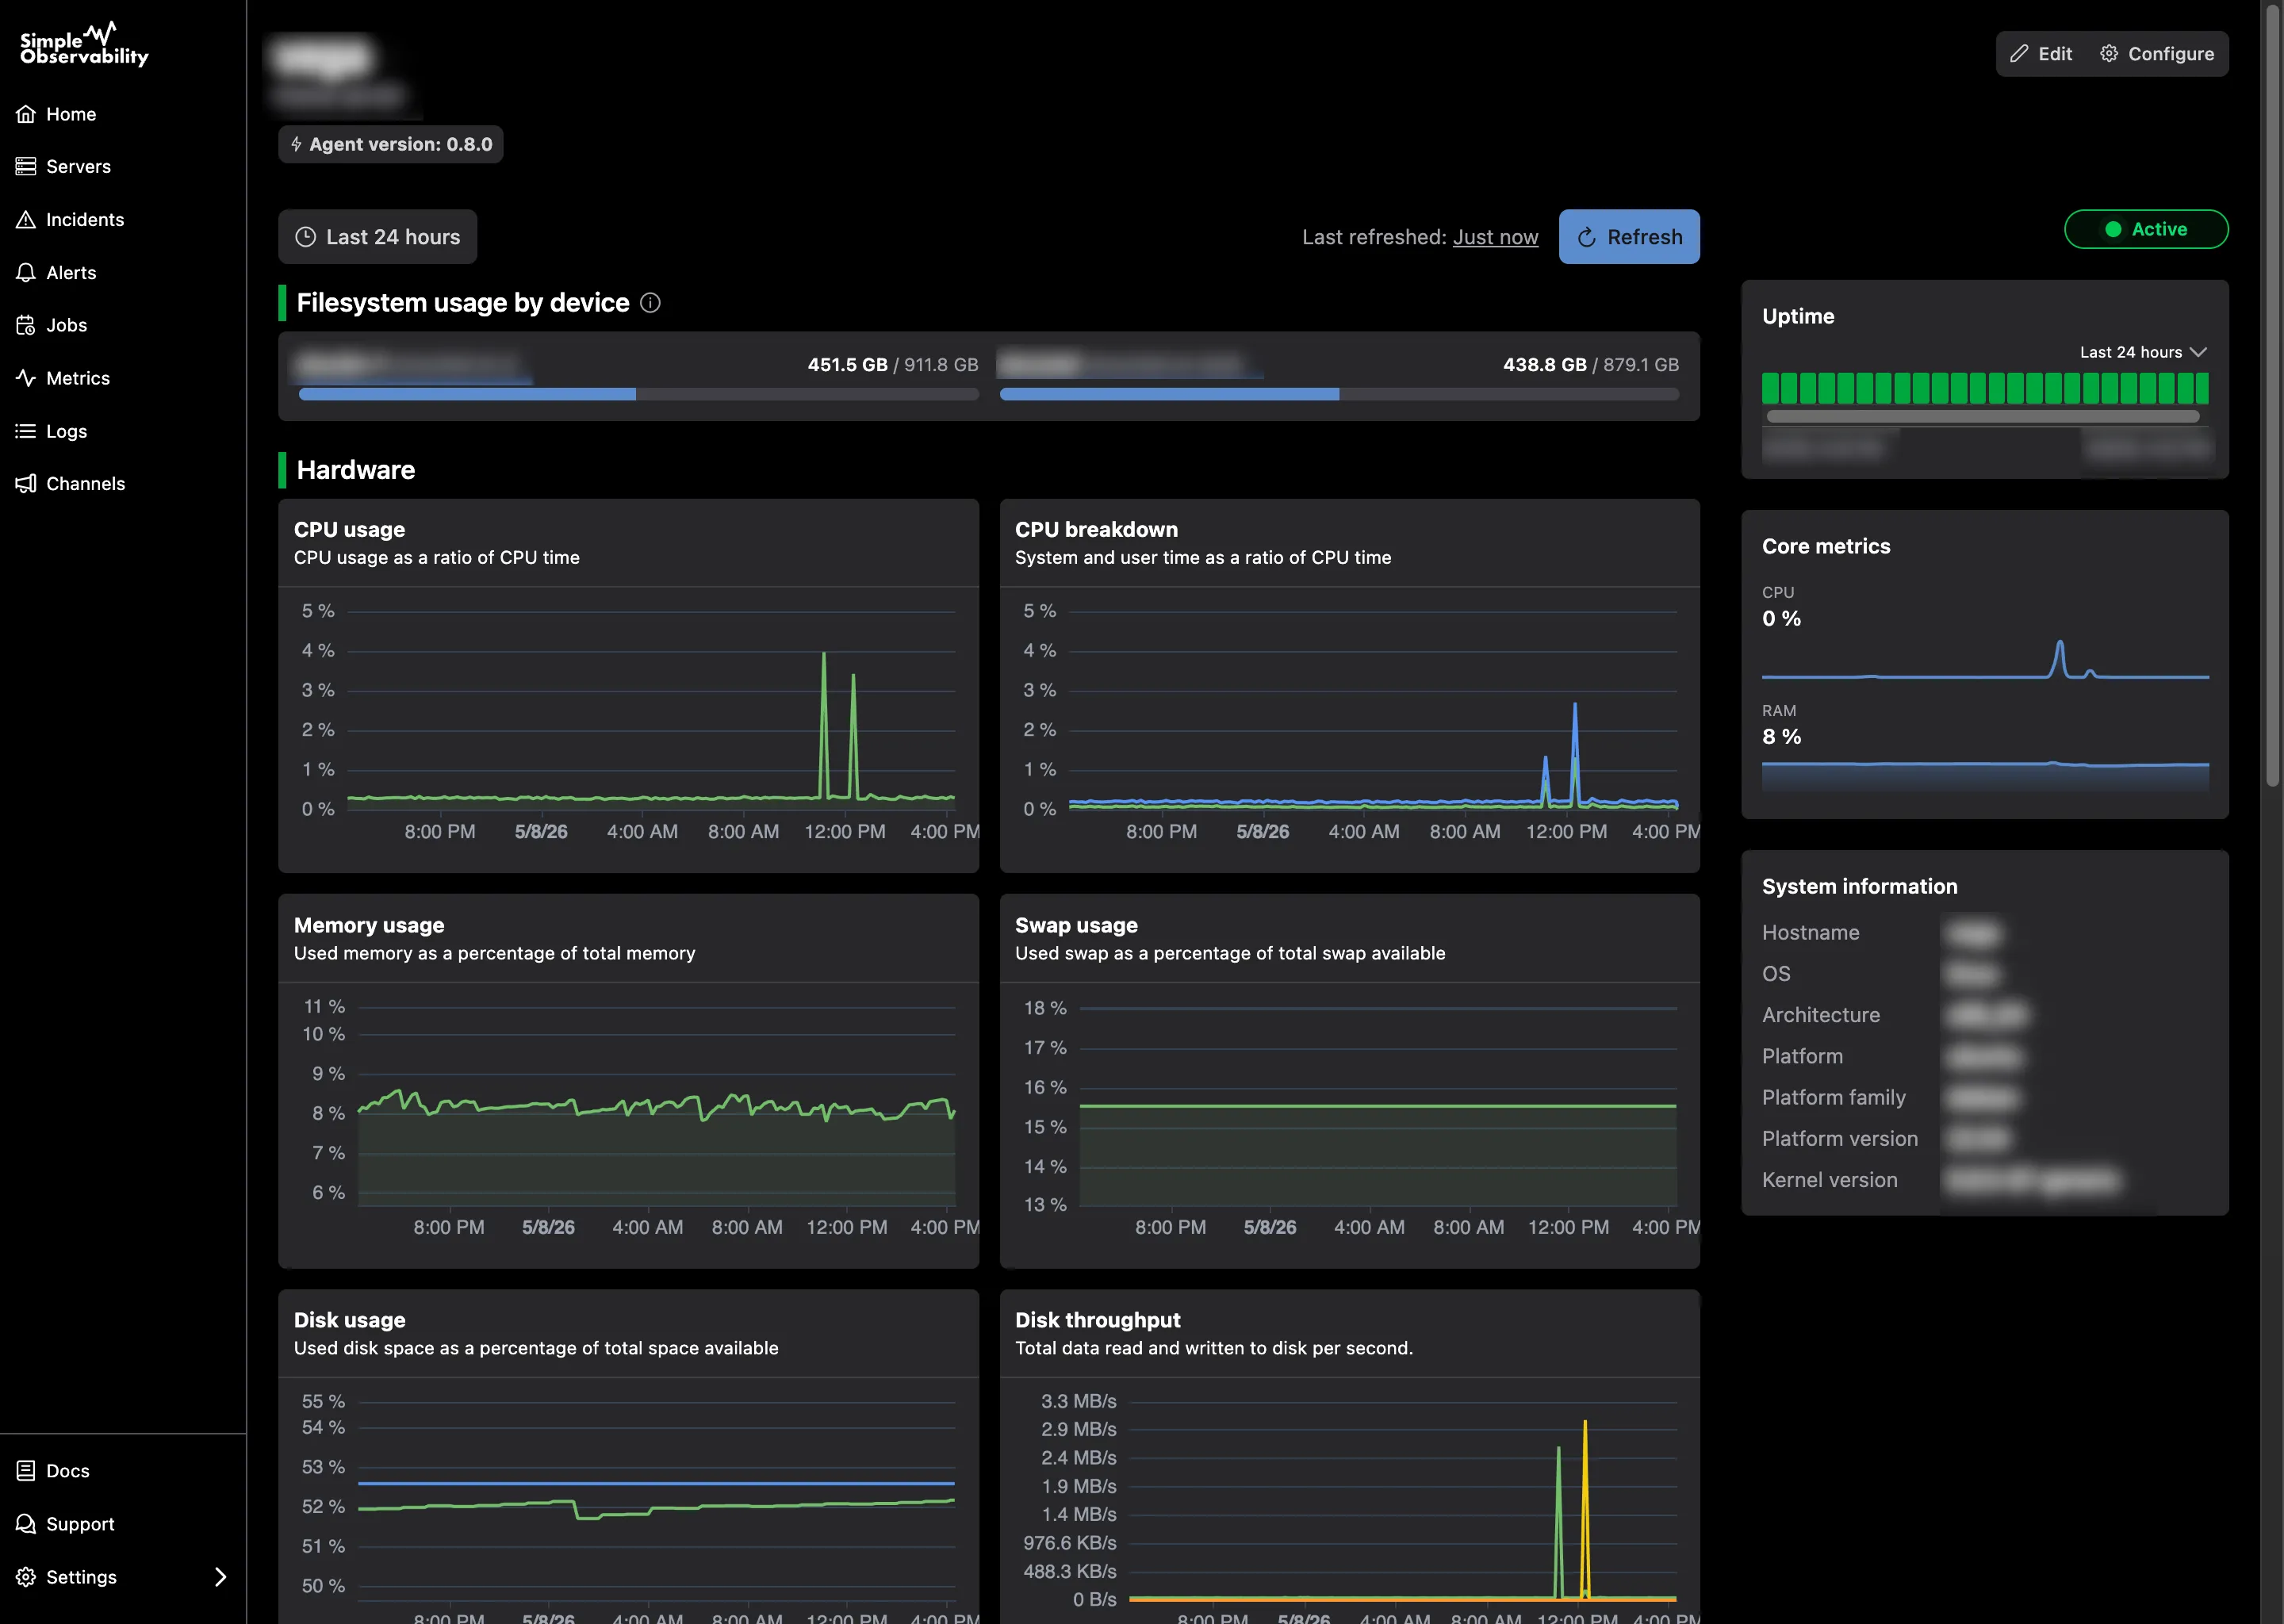
Simple Observability is built for teams that want enterprise-grade visibility without the enterprise-grade configuration. A single, lightweight binary agent auto-discovers services and begins reporting data immediately, with no YAML wrangling required.
Key features
- One-command install: No complex agent configuration. You get CPU, memory, disk, and uptime monitoring instantly.
- Unified logs & metrics: View application logs alongside server metrics in the same dashboard.
- Zero-config alerts: Sensible defaults out of the box so you’re protected from day one.
- SaaS convenience: No metrics database or retention stack to host.
Pros
- Extremely fast setup: Immediate visibility with no manual dashboard configuration.
- Predictable pricing: Flat fee per server, no “per million custom metrics” surprises.
- Correlates logs and metrics by default: No need to stitch separate tools together.
Cons
- Fewer specialized plugins: Legacy giants like Nagios have a larger plugin ecosystem.
Best for: Teams needing immediate visibility across hybrid cloud and on-prem assets.
Price
- Free: $0 for 1 server.
- Paid: $3/mo per server for unlimited servers.
- Custom: Volume discounts for large fleets.
2. Datadog
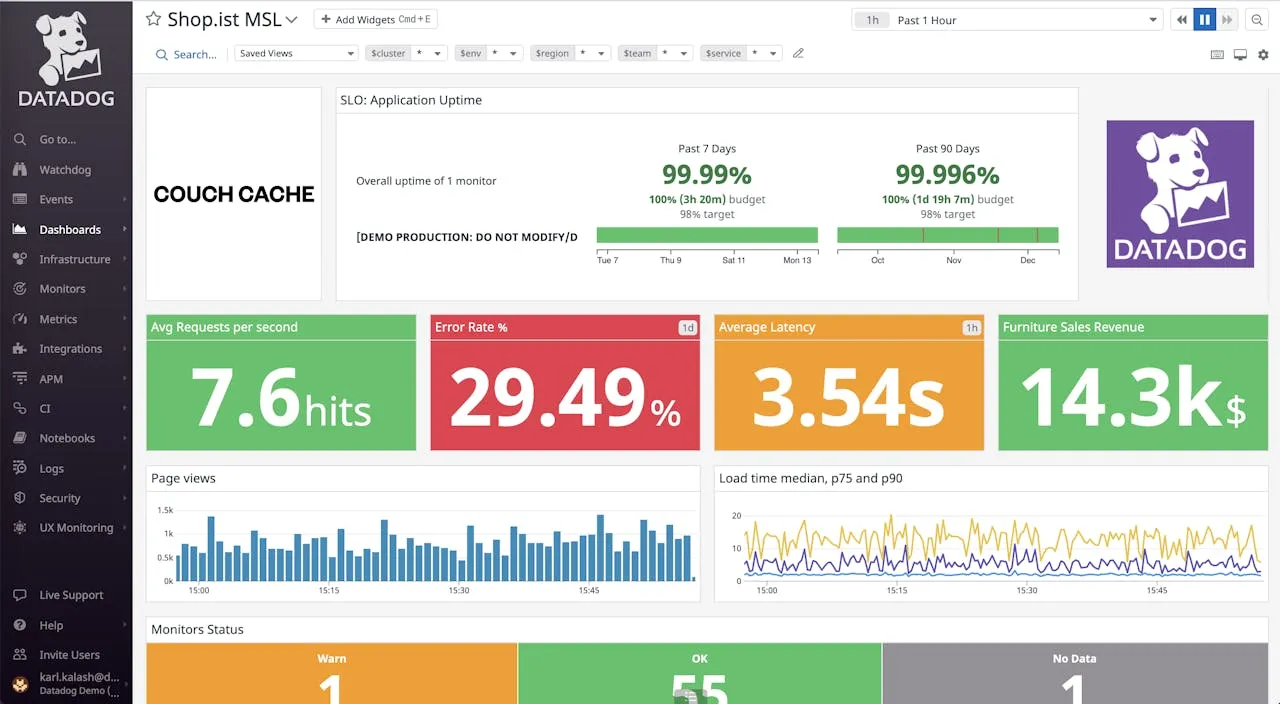
Datadog remains the most comprehensive platform for large-scale observability. It offers over 600 integrations and can monitor everything from a physical server in your office to a serverless function in the cloud.
Key features
- Full-stack observability: Seamless correlation between metrics, traces, and logs.
- Watchdog AI: Automated anomaly detection that often spots issues before you do.
- 600+ integrations: Point-and-click integrations for AWS, Azure, GCP, and SaaS tools.
Pros
- Unmatched feature set: Deep APM, security, RUM, and network monitoring under one roof.
- Excellent correlation: Connecting a spike in latency to a specific trace or log line is genuinely fast.
- Polished UI: Intuitive, fast, and genuinely pleasant to use.
Cons
- Very expensive at scale: The per-host price is just the entry ticket; custom metrics, log ingestion, and retention add up fast.
- Unpredictable billing: High-volume telemetry can cause sticker shock if you’re not careful.
Best for: Large enterprises and high-growth tech companies where engineering velocity matters more than optimizing the monitoring bill.
Price Infrastructure starts at $15/host/mo. APM, logs ($0.10/GB indexed), and custom metrics are billed separately, often doubling the base cost in production.
3. Prometheus & Grafana
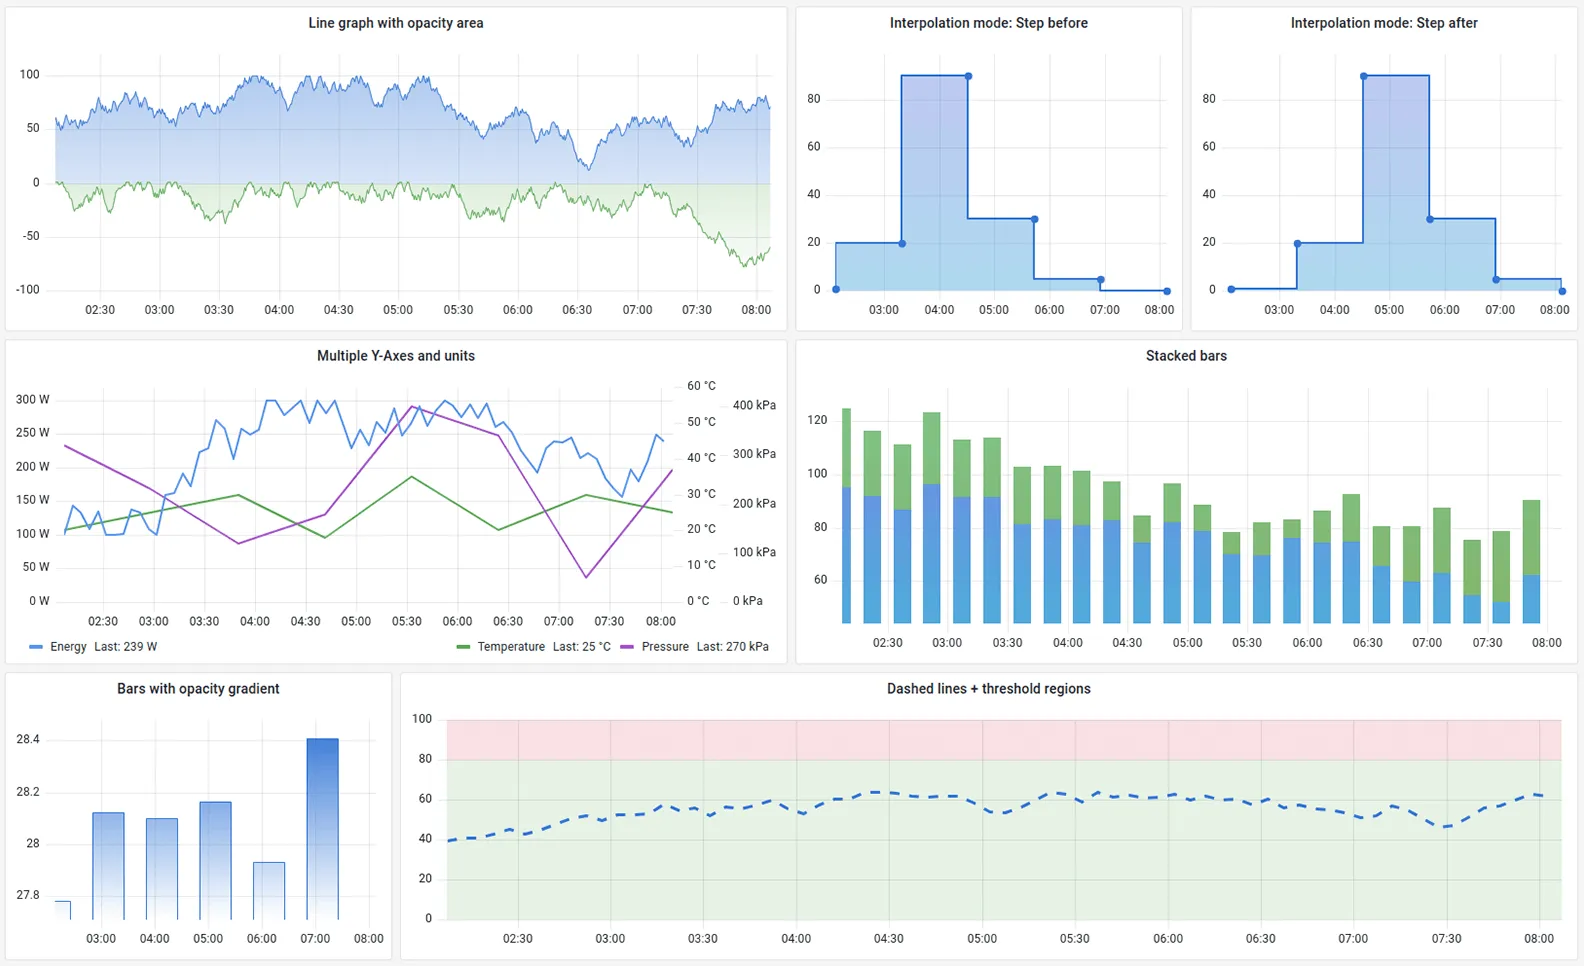
Prometheus paired with Grafana is the industry standard for cloud-native monitoring. Prometheus collects metrics using a pull model, and Grafana visualizes them through a powerful, fully customizable dashboarding layer.
Key features
- PromQL: A powerful multi-dimensional query language built for modern infrastructure.
- Huge ecosystem: Exporters available for almost every piece of software (Redis, Postgres, Nginx, etc.).
- Alertmanager: Handles alerts with sophisticated routing and grouping logic.
Pros
- Industry standard: The de facto choice for Kubernetes monitoring.
- Open source: Completely free to use if self-hosted.
- Flexibility: You can build any dashboard imaginable in Grafana.
Cons
- High maintenance burden: You must manage storage and scaling yourself (often requires Thanos or Cortex).
- No native log support: Prometheus is metrics-only; you need to add Loki or another tool for logs.
- Steep learning curve: PromQL takes time to master compared to point-and-click interfaces.
Best for: Teams with strong DevOps skills who want full control over their data, especially Kubernetes environments.
Price Free (open source). Running at scale usually requires paid storage extensions or managed services like Grafana Cloud or Amazon Managed Prometheus, which are usage-based.
4. Zabbix
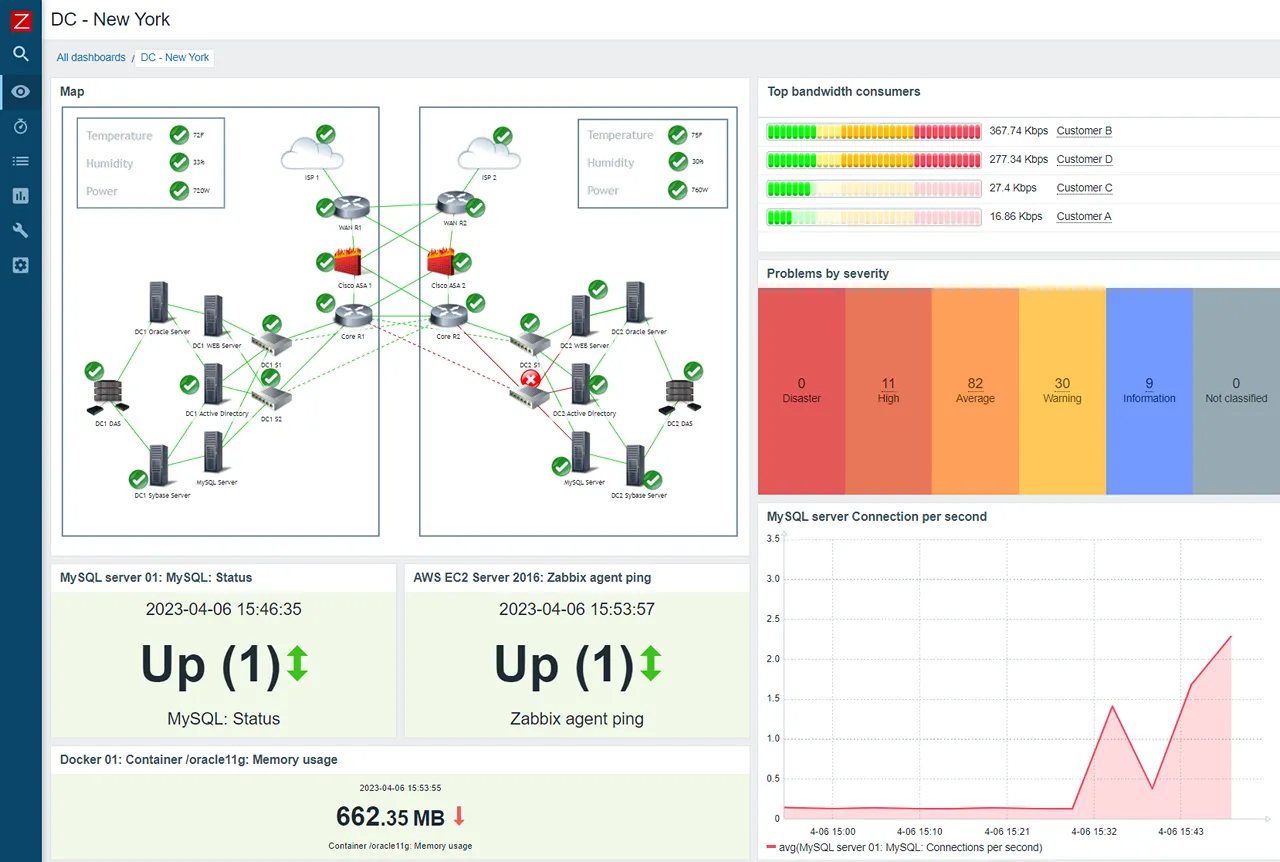
Zabbix is a mature, enterprise-grade open-source platform that excels at monitoring network hardware and on-prem servers. It is highly scalable and can handle tens of thousands of devices from a single console.
Key features
- Agent & agentless: Monitor via SNMP, JMX, IPMI, and its own lightweight agent.
- Push & pull: Supports both polling and trapping data collection methods.
- Granular permissions: Excellent multi-tenancy and user permission controls.
Pros
- Completely free: The software itself has no licensing cost.
- Robust alerting engine: Flexible trigger expressions and escalation policies.
- Proven at scale: Battle-tested in massive environments for decades.
Cons
- Dated UI: The interface feels like enterprise software from the mid-2000s.
- High maintenance overhead: Managing the underlying database (PostgreSQL/MySQL) can become a full-time job.
- Limited cloud-native support: Auto-scaling groups and ephemeral pods require cumbersome discovery rules.
Best for: Traditional data centers, network operations centers (NOCs), and network-heavy environments.
Price The software is open source. Professional deployments often use Zabbix Cloud, which starts at $50/mo. Enterprise support is also a paid service.
5. New Relic
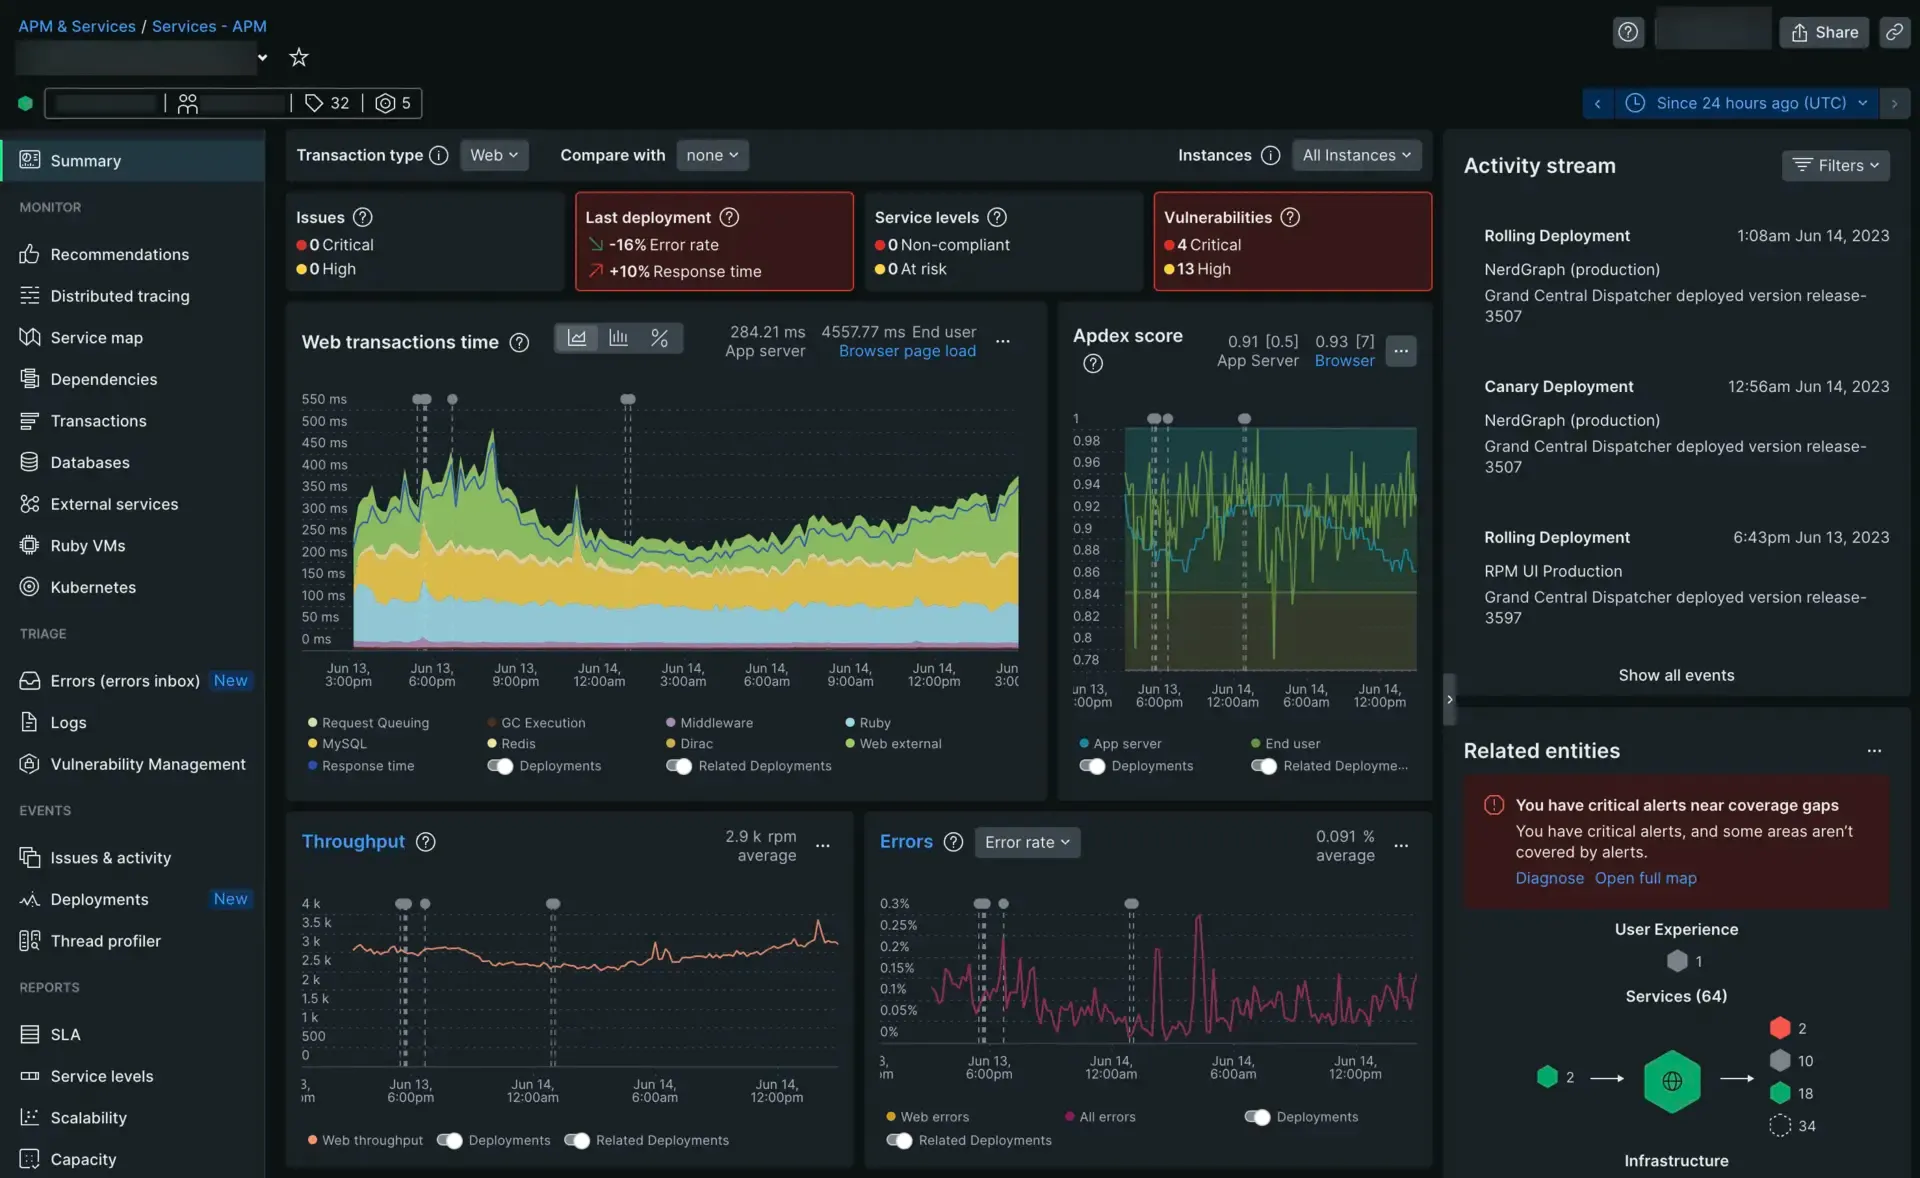
New Relic has shifted to a “unified data platform” model. While it started as an application performance tool, its infrastructure monitoring is now tightly integrated, letting you see how server health affects app latency directly.
Key features
- Deep APM: Code-level tracing to identify slow database queries or inefficient functions.
- Browser & mobile: Native support for tracking end-user experience on web and mobile apps.
- Applied intelligence: AI-driven insights to detect anomalies and correlate events across your stack.
Pros
- All-in-one visibility: Metrics, logs, and traces stored in one place.
- Generous free tier: 100 GB/month free for small teams.
- Strong query capabilities: NRQL is powerful and approachable.
Cons
- Overwhelming UI: The platform is vast, and navigating it can be frustrating for simple needs.
- Per-user pricing: Full Platform User seats are expensive as your team grows.
Best for: Application-focused teams who want a single tool for the whole stack, especially where APM matters.
Price Usage-based: free for 100 GB/month. Paid plans start at $0.30/GB ingested plus per-user seat fees ($99/mo for Core, $549/mo for Full Platform).
6. LogicMonitor
LogicMonitor is a SaaS-based, agentless monitoring platform. It is designed to be easy to deploy across hybrid environments, using a “Collector” that sits in your network and scans for devices automatically.
Key features
- Agentless deployment: A single Collector per network segment handles discovery and collection.
- Out-of-the-box dashboards: Pre-built dashboards for most common infrastructure components.
- Intelligent anomaly detection: Dynamic thresholds that adapt to your workload patterns.
Pros
- Convenient deployment: No per-host agent installation required.
- Great OOTB dashboards: Faster time-to-value than most self-hosted alternatives.
- Strong hybrid support: Handles both on-prem and cloud assets from the same console.
Cons
- Expensive for smaller environments: Pricing can be hard to justify below a certain scale.
- Limited customization: Less flexible than open-source tools for bespoke requirements.
Best for: Mid-market companies with a mix of cloud and physical infrastructure that want SaaS convenience without agent sprawl.
Price Custom pricing. Contact LogicMonitor for a quote.
7. Checkmk
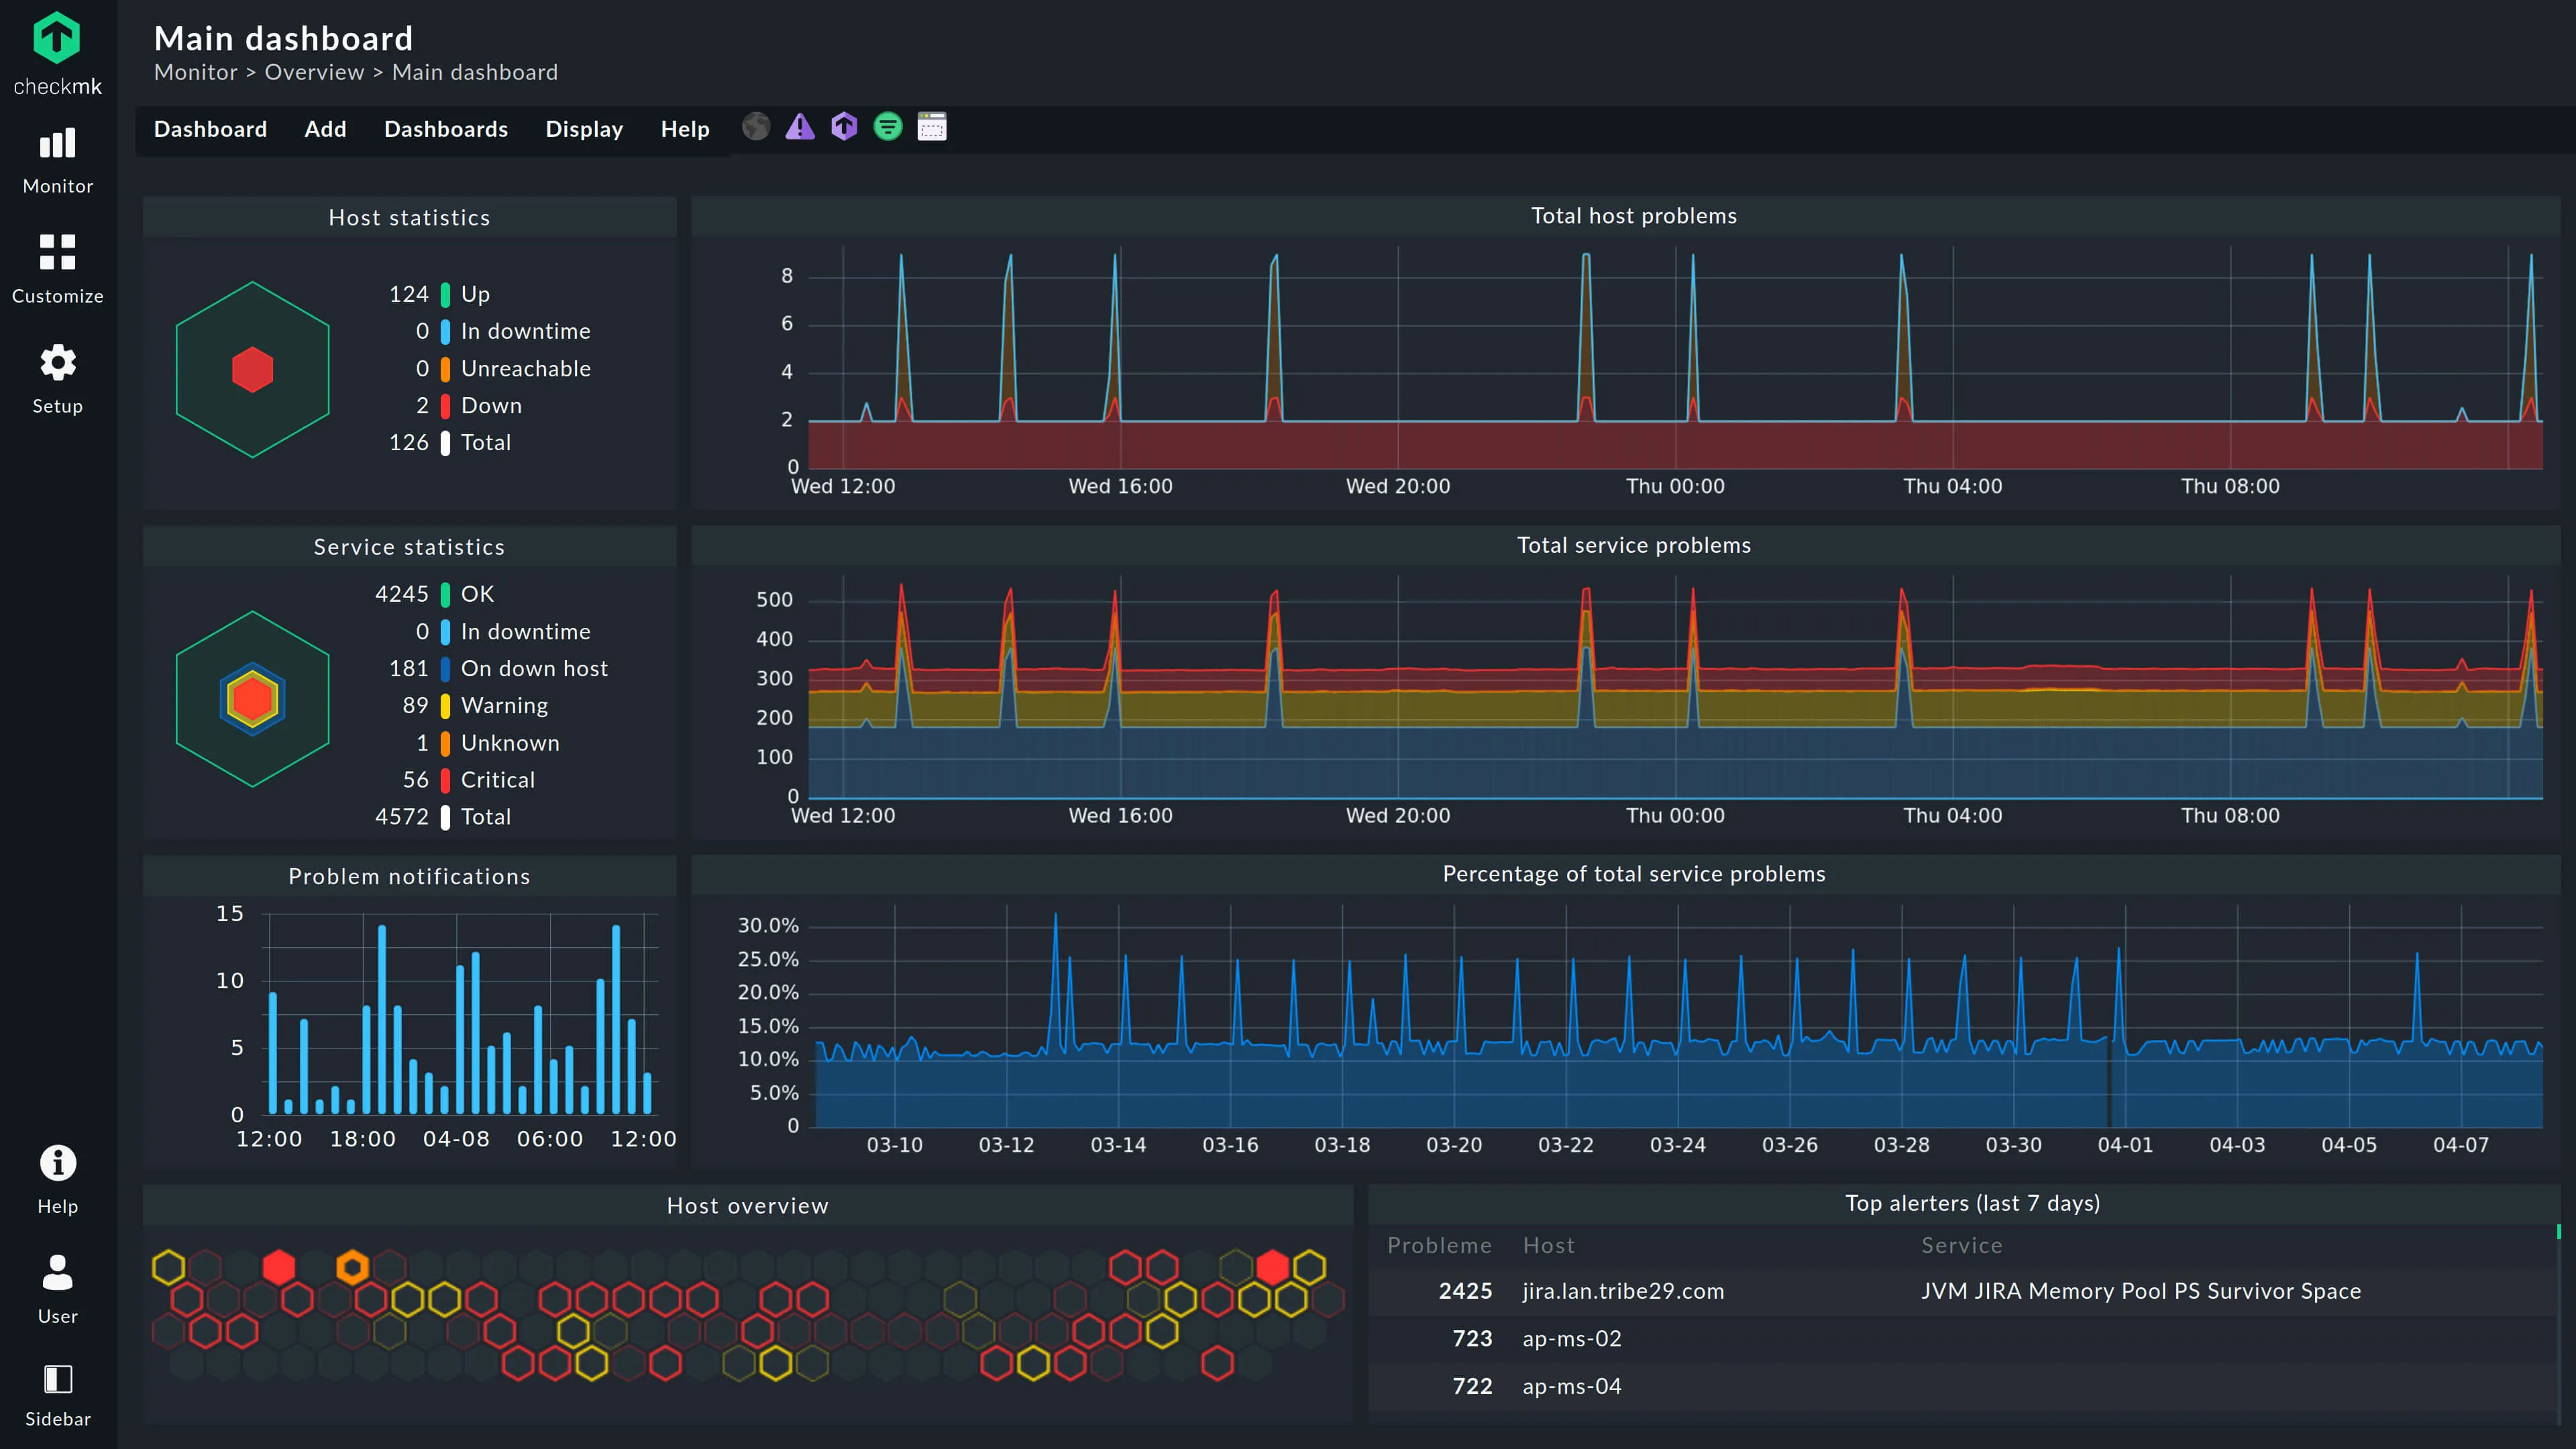
Checkmk is known for its incredibly efficient monitoring engine. It can monitor thousands of services with very low CPU overhead, and is particularly popular in ITIL-compliant environments across Europe.
Key features
- Automated service discovery: Scans hosts to automatically find running services and configure checks.
- 2,000+ plugins: Massive library of integrations including hardware, switch ports, and SAP systems.
- Hybrid monitoring: Equally good at bare metal, containers, and cloud instances.
Pros
- Efficient core: Far less resource-intensive than Nagios or Zabbix at the same check volume.
- All-in-one: Handles both state-based (Up/Down) and metric performance monitoring.
- Active community: The Checkmk Exchange offers hundreds of community extensions.
Cons
- Dated UI: Functional but feels cluttered compared to modern SaaS tools.
- Steep learning curve: The rule-based configuration model takes time to internalize.
Best for: High-density monitoring where efficiency is the top priority, and sysadmins managing a mix of legacy hardware and modern containers.
Price Open source edition is free. Enterprise starts at ~$2,100/yr for 3,000 services. SaaS editions start at ~$6/host/mo.
8. Site24x7
Site24x7 (from Zoho) offers a broad suite of monitoring tools: website uptime, server monitoring, network tracking, and more. It is a cloud-based solution that is very easy to get started with.
Key features
- Wide coverage: Monitors servers, websites (Synthetics), networks, and mobile apps from one place.
- RUM & Synthetics: Built-in real user monitoring and synthetic transaction checks.
- Affordable bundles: Pricing is structured around bundles rather than per-metric billing.
Pros
- Very affordable: One of the most cost-effective all-in-one options on the market.
- Easy to set up: Minimal configuration required to get started.
- Broad feature set: Covers a lot of ground without needing multiple tools.
Cons
- Less depth: Not as specialized or customizable as dedicated monitoring tools.
- Cluttered UI: The interface can feel overwhelming given the breadth of features.
Best for: Small to medium businesses that need a simple, affordable SaaS solution covering multiple monitoring needs.
Price Plans start from $9/mo. Pricing depends on the number of monitors and data retention chosen.
9. Netdata
Netdata is unique because it offers per-second granularity out of the box. It is designed to be installed on every server to give you an immediate, high-resolution view of what is happening right now.
Key features
- 1-second resolution: Real-time metrics with almost no latency from collection to visualization.
- Unsupervised ML: Built-in anomaly detection that flags outliers without manual thresholds.
- Auto-discovery: Automatically detects services and apps running on the host.
Pros
- Zero configuration: Install and get beautiful real-time charts immediately.
- Incredibly low overhead: Lightweight enough to run on constrained hardware.
- Free and open source: The core product costs nothing to self-host.
Cons
- Node-centric by design: Historically better at monitoring individual nodes than providing a global infrastructure view (though Netdata Cloud is improving this).
- No native tracing: Primarily a metrics tool; logs are a newer, still-maturing addition.
Best for: Real-time troubleshooting and low-level performance tuning on individual hosts.
Price Open source (free, self-hosted). Netdata Cloud has a free tier and paid plans for centralized management.
10. Nagios XI
Nagios is the “grandfather” of monitoring. Nagios XI is the commercial version that adds a web interface and easier configuration to the core engine, backed by the largest plugin ecosystem in the world.
Key features
- Massive plugin library: If it has an IP address, there is almost certainly a Nagios plugin for it.
- Binary state alerting: Rock-solid OK/CRITICAL/WARNING alerting logic.
- Configuration wizards: XI adds point-and-click setup on top of the core Nagios engine.
Pros
- Universal compatibility: Monitors virtually any device, protocol, or service.
- Proven reliability: Extremely stable technology with decades of production use.
Cons
- Significant expertise required: Setting up and maintaining Nagios properly is a technical challenge.
- Dated architecture: Feels antiquated compared to modern SaaS or cloud-native tools.
- Metrics are secondary: Nagios is fundamentally a status check tool, not a graphing platform.
Best for: Organizations with highly specific or legacy monitoring requirements, or environments where only a Nagios plugin exists for a given piece of hardware.
Price Nagios Core is free (open source). Nagios XI starts at $2,495 for a standard license (up to 100 nodes).
How to choose the right solution
The best IT infrastructure monitoring solution is the one your team will actually use and maintain. Start by auditing two things: how many cloud vs. on-prem nodes you have, and how much time your team can realistically dedicate to tool maintenance.
If you have a large budget and a dedicated observability team, Datadog or Prometheus are excellent choices. If you are a smaller team, or you are tired of spending weekends fixing your monitoring stack, lean toward zero-config options like Simple Observability or SaaS tools like LogicMonitor or Site24x7.
The right tool should feel like a force multiplier, not another chore on your to-do list.