Monitor your servers with one single command.
Powerful monitoring, without the setup complexity. No
configuration headaches. Clear fixed pricing.
curl -fsSL https://simpleobservability.com/install.sh | sudo bash -s -- <SERVER KEY> No credit card required
With us, server monitoring is easy
01
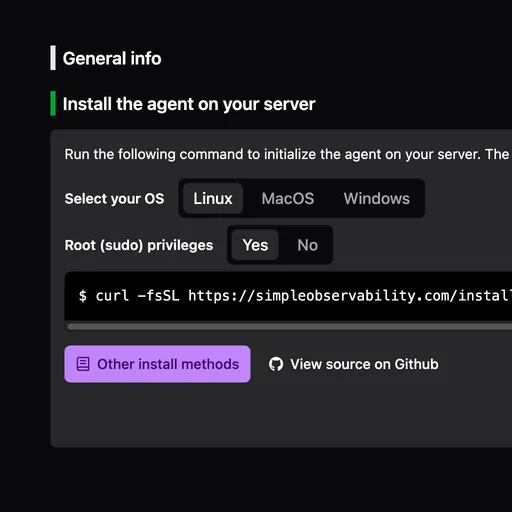
Install the agent
Install our open-source agent with a single command.
02
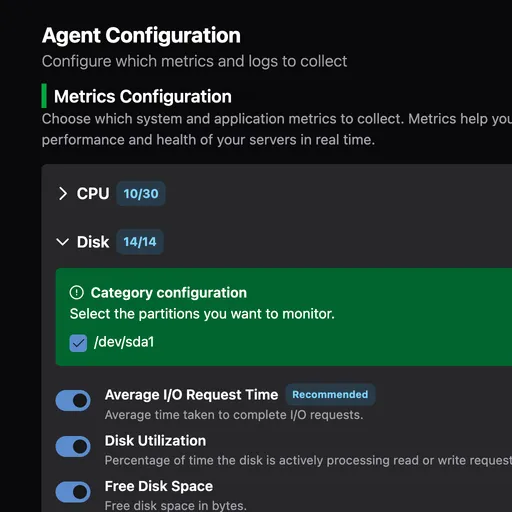
Configure from the UI
Manage everything from the web interface. No config files needed.
03
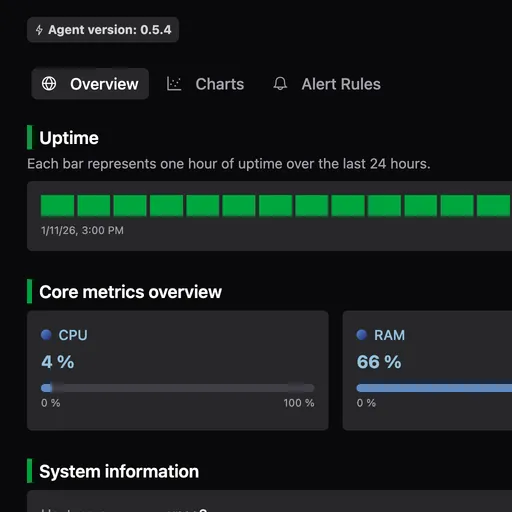
Get instant insights
Access ready-to-use reports and alerts.
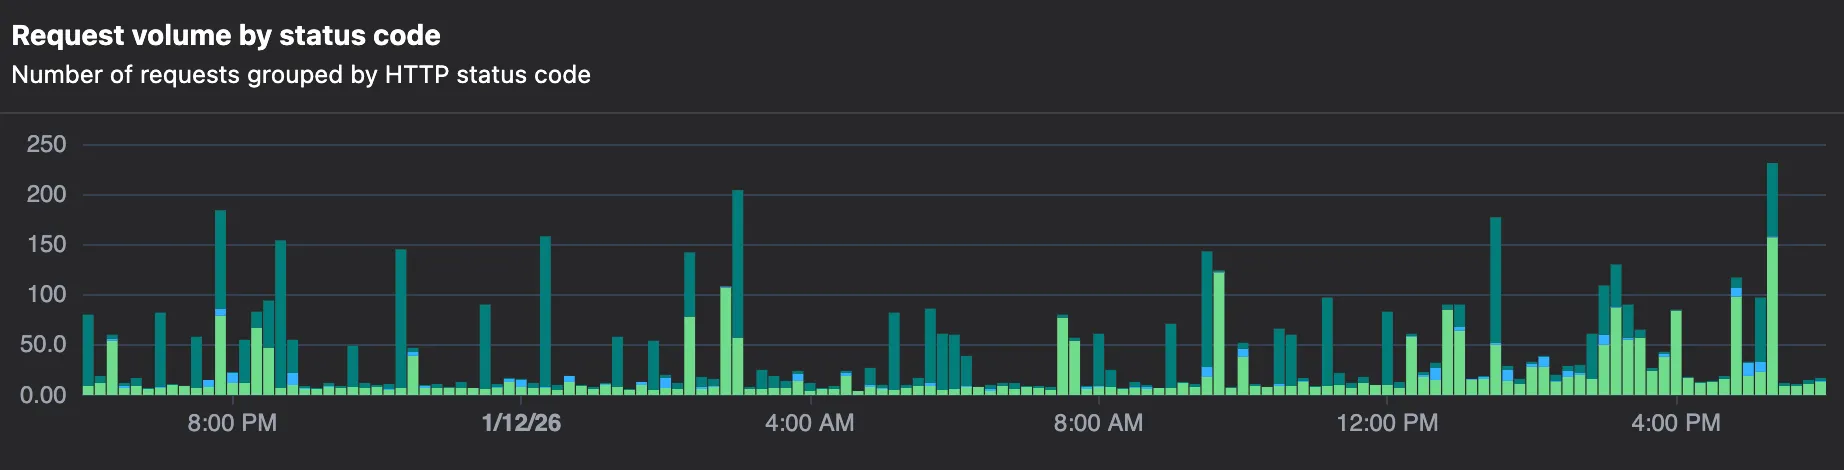
Metrics and logs in one place
Collect and visualize server metrics and logs in one place. No more jumping between tools.
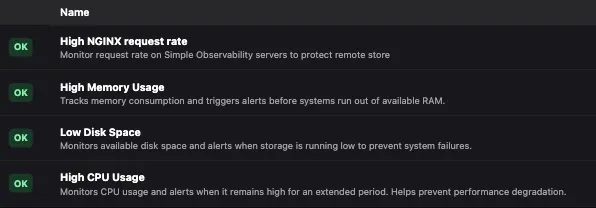
Set alerts on what matters
Create your own rules based on metrics or use pre-built templates.
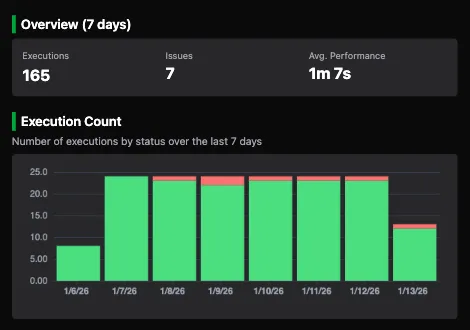
Track your cron jobs
Know when a scheduled job fails, runs late, or doesn't run at all.
Why Simple Observability is the best monitoring solution for your servers?
One command install
Deploy our open-source agent with a single command. No complex
setup procedures.
Web UI configuration
Configure everything through our intuitive interface. No more
editing wrestling with configuration syntax.
Unified monitoring
Get the full picture with metrics and logs in one unified
system.
Ready-to-use reports
Access meaningful insights immediately. No need to build
complex dashboards. We extract what matters.
Customizable alerting
Set up notifications for critical events like disk space
issues or unusual server activity. Stay ahead of problems
before they impact your services.
Mobile App
Monitor your infrastructure from anywhere. Access reports and
alerts directly from your phone to stay informed on the go.
A look inside Simple Observability UI
Instantly see how Simple Observability helps you monitor and troubleshoot, all from a single UI.


Keep an eye on your servers from anywhere
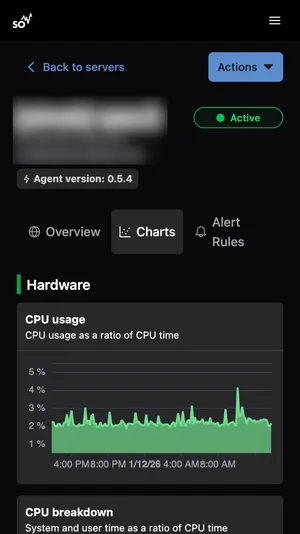
Mobile-friendly dashboards
Respond to alerts from your phone
No install needed
Just add to your home screen
Lightweight is a metric,
not an adjective.
“Lightweight” isn’t a promise, it’s something we measure.
simob is built to have a minimal footprint, with close attention to memory usage and CPU consumption,
so monitoring stays out of the way of your workloads.
simob-agent.service
CPU Usage
< 0.3 %
1 core utilization Memory
< 12 MB
Resident Set Size (RSS) Binary Size
< 10 MB
Static, no deps Disk I/O
< 0.2 kB/s
Minimal, low-frequency writes Complete observability, simplified
Simple Observability delivers all essential monitoring capabilities in one streamlined package. We've eliminated the complexity while keeping the powerful features you need to maintain reliable systems.
Stop cobbling together multiple tools and managing complicated stacks.
Customizable Graphs
In addition to ready-to-use reports, create custom visualizations
tailored to your specific monitoring needs.
Query Your Data
Powerful search functionality to find specific metrics and logs across
your entire infrastructure.
Alerts
Configure precise alert conditions for events that matter to your
operations. Get notified when thresholds are crossed.
Webhooks
Connect alerts to your existing workflow. Integrations with Discord,
Slack, email, SMS, and more ensure notifications reach you wherever you
work.
Mobile App
Progressive Web App to monitor your servers from anywhere. Keep your
infrastructure at your fingertips.
Automatic Updates
Our agent automatically updates itself with the latest features and
security patches. No maintenance required on your part.
Clear Pricing
Fixed pricing with no surprises. No usage-based charges, no worrying
about log volume spikes. What you see is what you pay
Support
Whether you're running mainstream Linux distros or the most esoteric OS
variants, our team will help you get monitoring up and running.
Zero Inbound Ports.
Most monitoring agents require you to poke holes in your firewall or manage complex access lists.
We don't. simob strictly pushes data outbound.
Your firewall stays completely closed.
Your Server Inbound: CLOSED
Outbound HTTPS
Our Cloud Ingestion API
Built-in Metrics and Log Sources
Choose from a curated set of reliable data sources embedded within the
agent. Activate only the metrics and logs relevant to your environment
with a simple toggle in the UI. No extra installs needed.
What it collects
- ● CPU time for user, system, idle, and other states
- ● Per-core utilization breakdown
Why it matters
- ● Detect CPU overloads and unusual usage patterns
- ● Understand how workloads distribute across cores
What it collects
- ● Total, used, and free disk space & inodes
- ● Read/write throughput and operations per second
- ● Disk utilization
Why it matters
- ● Prevent disk full errors or inode exhaustion risks
- ● Identify I/O bottlenecks and disk latency
What it collects
- ● Available, used, and total memory
Why it matters
- ● Detect memory shortages and leaks
- ● Prevent OOM errors
What it collects
- ● Bytes sent and received per second
- ● Packets sent and received rates
- ● Input/output error and drop rates
Why it matters
- ● Detect network bottlenecks and failures
- ● Monitor traffic volume and quality
What it collects
- ● Active, reading, writing, and waiting connections
- ● Request rate
Why it matters
- ● Detect traffic spikes, overload, or idle states
- ● Monitor connection handling efficiency
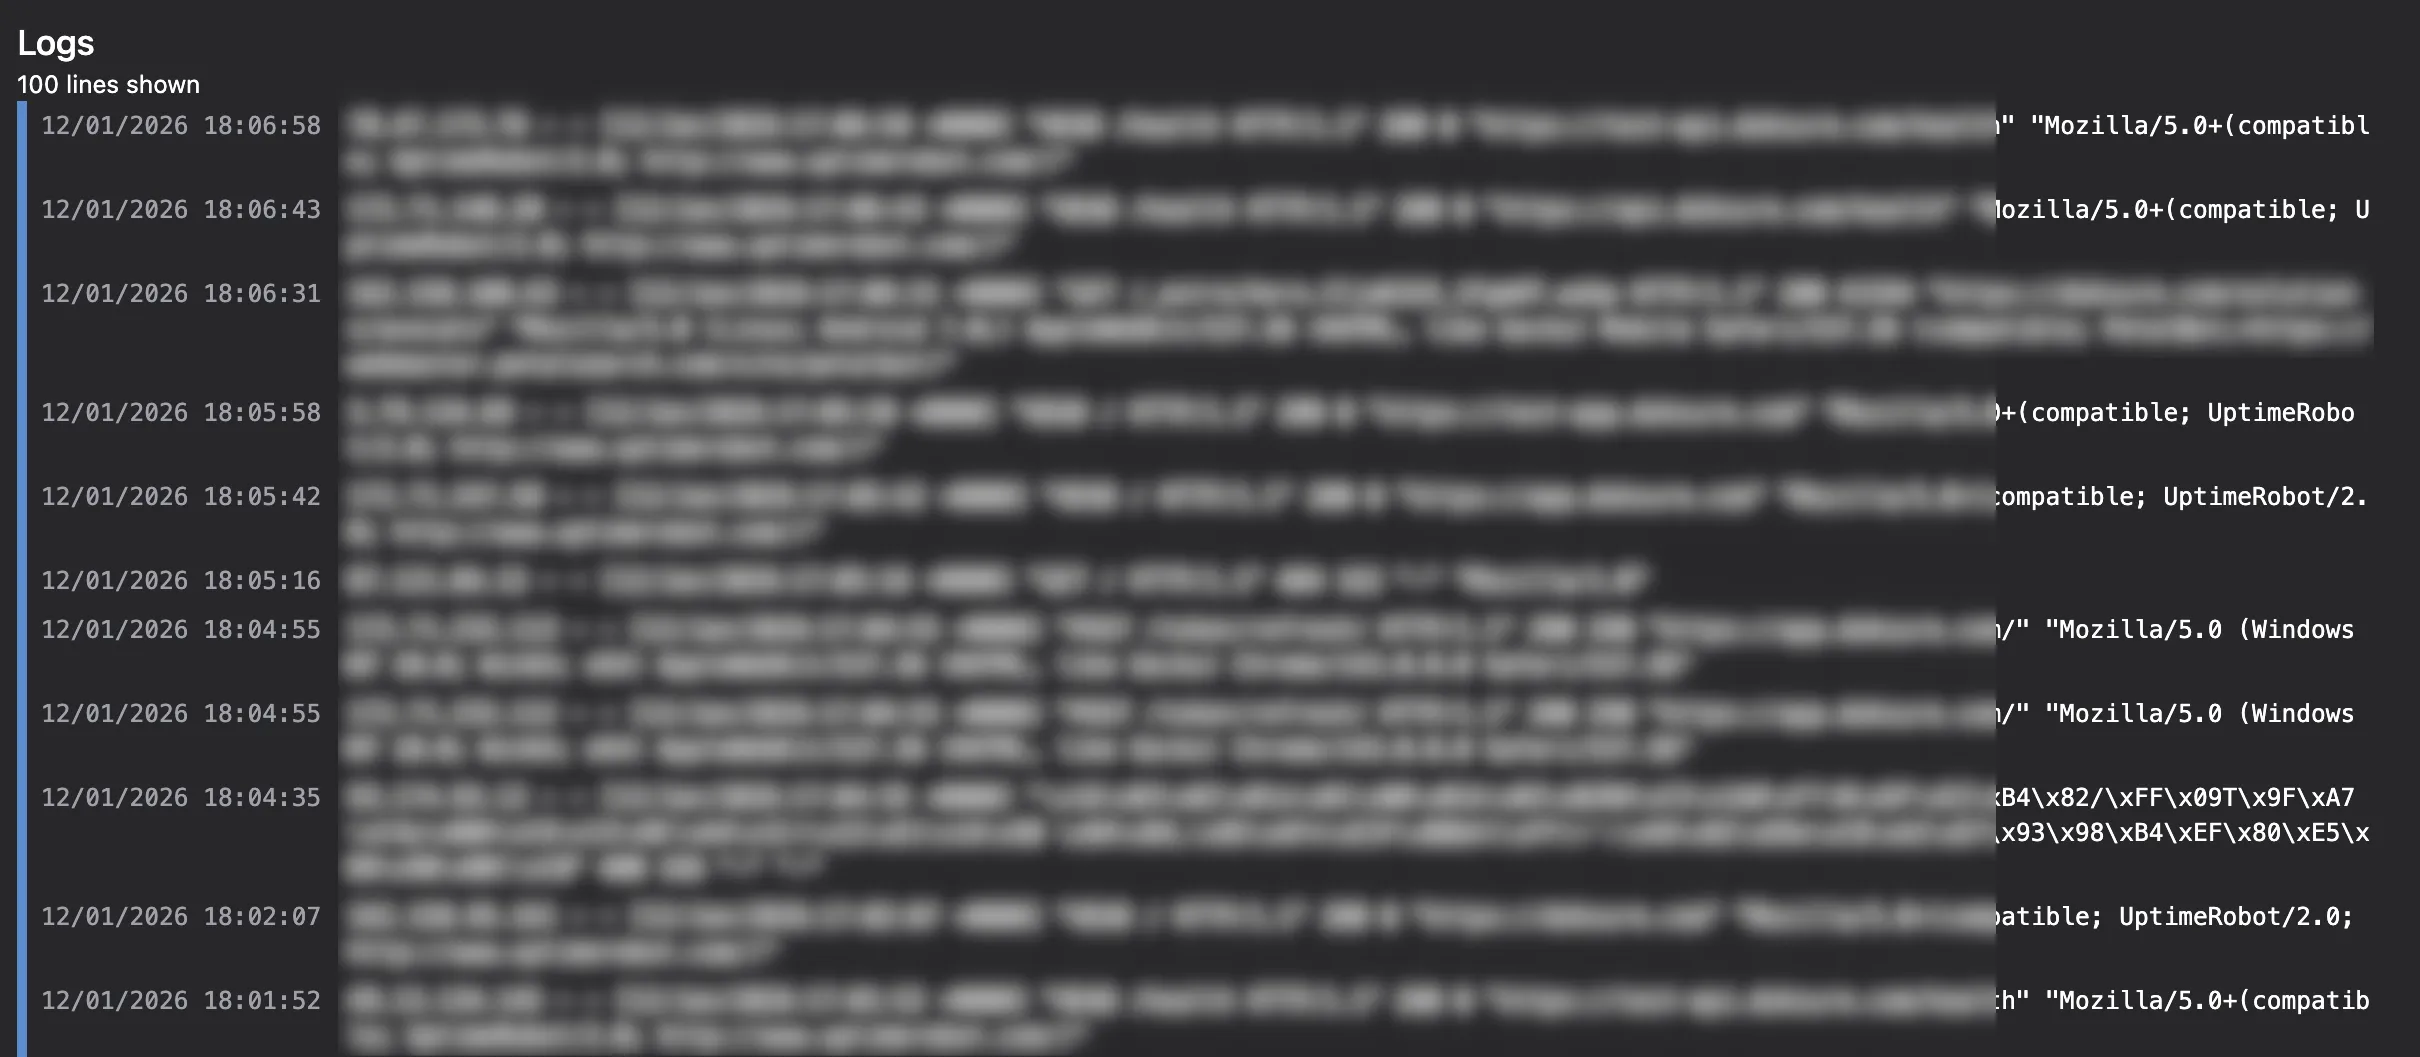
Collect access logs with details on requests, response codes,
referrers, and client information.
What it collects
- ● Access logs with request paths, status codes, user agents, and referrers
Why it matters
- ● Understand traffic sources and request trends
Collect detailed HTTP request logs with status codes, response
times, client IPs, and user agents.
What it collects
- ● Full HTTP request entries including status codes, path, user agent strings, etc.
Why it matters
- ● Spot error spikes and latency issues
- ● Monitor traffic patterns and client behavior
Runs Anywhere, No Hassle
Our open-source agent works on all major Linux distributions and
Windows, and supports a wide range of CPU architectures.
Simple Monitoring. Simple Pricing
No credit card required
Lite
Free plan for one server. Ideal for testing, development, or low-traffic
workloads.
Free
for 1 server
- ● 50 metrics per server
- ● Low log volume
- ● Single server
Standard
For growing infrastructures. Includes 3 servers, scalable to unlimited.
$9 / month
for 3 servers (+ $3 per extra server)
- ● 100 metrics per server
- ● High log volume
- ● Include 3 servers
Advanced
For large-scale deployments and high-volume monitoring. Includes 5
servers, scalable to unlimited.
$21 / month
for 5 servers (+ $4 per extra server)
- ● 200 metrics per server
- ● Higher log volume
- ● Include 5 servers
Custom & Enterprise Plans
For very large infrastructures, higher log volumes, or custom
requirements, we offer tailored pricing plans.
Contact Us
Frequently Asked Questions
Why does server monitoring matter?
Because without it, issues go unnoticed until they become critical.
Monitoring lets you spot performance bottlenecks, detect errors early,
and ensure your systems and applications stay reliable.
With Simple Observability, you get real-time insight into logs and metrics so you can act before problems impact your services.
With Simple Observability, you get real-time insight into logs and metrics so you can act before problems impact your services.
What are the requirements to run the collection agent?
The Simple Observability agent is distributed as a single,
self-contained binary with zero external dependencies. There’s no need
for Docker, Java, or any other runtime.
Because it’s fully open-source, you can also clone our repository and build the binary yourself.
Because it’s fully open-source, you can also clone our repository and build the binary yourself.
Do I need to have ports open?
No inbound ports are required on your servers. The agent uses a
push-only model, sending metrics and logs outbound over HTTPS (port 443)
to *.simpleobservability.com.
If you operate behind a corporate proxy or firewall, just allow outbound HTTPS traffic to our domain.
The agent will locally buffer data if connectivity is lost and replay it once the network is restored.
If you operate behind a corporate proxy or firewall, just allow outbound HTTPS traffic to our domain.
The agent will locally buffer data if connectivity is lost and replay it once the network is restored.
Will you help me integrate Simple Observability with my setup?
Yes. If needed, we’ll guide you step by step with a real person through
every part of the integration.
Most setups work out of the box, but we’ll also support the less common cases where changes to the collection agent are needed.
Most setups work out of the box, but we’ll also support the less common cases where changes to the collection agent are needed.
What if I need to send data from a specific source not listed?
Yes. Whether it is a rare server OS, an unusual log format, or a custom
app metric, if it can output data we’ll help you connect it. All such
support will be handled by a real, experienced engineer and
never by a ticket system, autoresponder, or first-level technician.
Really?!
Yes. We are not just providing a monitoring platform. We provide
complete, end-to-end support for everything you run, no matter how
complex or unconventional.
What we do with your data?
Metrics and logs collected by your agent are used only to power your
monitoring dashboards.
This data is securely stored with our cloud provider and is never sold or shared. Thanks to our open-source agent, you remain fully in control of what is collected and sent.
This data is securely stored with our cloud provider and is never sold or shared. Thanks to our open-source agent, you remain fully in control of what is collected and sent.
How long data is retained?
Data retention depends on your plan. This applies to both metrics and
logs collected from your servers.
What payment method do you accept?
We accept all major credit cards (Visa, Mastercard, American Express)
and PayPal.
Can I cancel anytime?
Yes. You can cancel your subscription at any time with no questions
asked. You'll continue to have access until the end of your current
billing period.
Do you offer discounts on large number of servers?
Yes! For businesses monitoring more than 10 servers, please contact our
sales us to discuss custom enterprise pricing options.