
Prometheus is the go-to choice for monitoring cloud-native infrastructure. If you’re running Kubernetes, you’ve probably already deployed it. It brought us the pull-based model, PromQL, and an ecosystem of exporters that made metrics collection standardized and powerful.
But Prometheus wasn’t built for every use case. It excels at short-term metrics on a single node, but struggles when you need long-term storage, high availability, or want to avoid managing a complex stack of components.
This guide covers the best Prometheus alternatives in 2026. Whether you’re hitting scaling limits, dealing with setup complexity, or just want something simpler, we’ll help you find the right fit.
Why look for a Prometheus alternative?
Prometheus works great for many teams, but there are clear scenarios where it becomes more of a burden than a solution.
You’re spending more time managing Prometheus than using it. If you’re constantly tweaking sharding, federation, or retention policies, you’re maintaining infrastructure instead of monitoring your apps.
You need long-term storage. Prometheus keeps recent data on local disk. Storing metrics for months or years requires add-ons like Thanos or Cortex, which add significant complexity.
You want metrics and logs in one place. Prometheus only handles metrics. If you also need logs, you’re running a separate stack (like ELK or Loki), which means more tools to manage and correlate manually.
You’re not running Kubernetes. Prometheus is designed for containerized environments. If you have VMs, bare metal servers, or a mix of infrastructure, the exporter model can feel awkward and over-engineered.
What makes Prometheus hard to scale?
Prometheus is a single binary, which is great for simplicity. But that design choice creates friction when your infrastructure grows.
No built-in high availability. You need to run multiple Prometheus instances and configure them carefully to avoid gaps in data.
Local storage limits retention. Prometheus stores data on disk. To keep metrics for more than a few weeks, you need external storage solutions, which means deploying sidecars, object storage gateways, and compactors.
Alert configuration is disconnected. Alerts are defined in YAML files, separate from your dashboards. Debugging why an alert didn’t fire means jumping between Prometheus, Grafana, and config files.
You need multiple tools for full observability. Prometheus handles metrics. For logs, you need something else. For traces, yet another tool. Correlating a CPU spike with an error log means switching between systems.
How to evaluate Prometheus alternatives
When comparing alternatives, focus on what actually matters for your workflow.
Deployment complexity. Is it a single binary you can run anywhere? A distributed system with multiple components? Or a SaaS product where you don’t manage infrastructure at all?
Storage model. Does it use local disk (harder to scale) or object storage like S3 (cheaper and easier for long-term retention)?
Long-term retention. Is historical data storage built in, or do you need to add extra components?
Operational overhead. Are you replacing one complex system with another, or actually simplifying your setup?
Top Prometheus alternatives
Here are the best alternatives for 2026, based on what they’re optimized for.
| Tool | Type | Best for | Complexity |
|---|---|---|---|
| InfluxDB | Self-hosted / SaaS | Time-series data, IoT, and analytics | Medium |
| Simple Observability | SaaS | Unified metrics and logs, zero setup | Very low |
| VictoriaMetrics | Self-hosted | High performance, lower resource usage | Medium |
| SigNoz | Self-hosted / SaaS | Unified metrics, logs, and traces | Medium |
| Datadog | SaaS | Enterprise teams, zero ops | Low (ops) / High (cost) |
1. InfluxDB
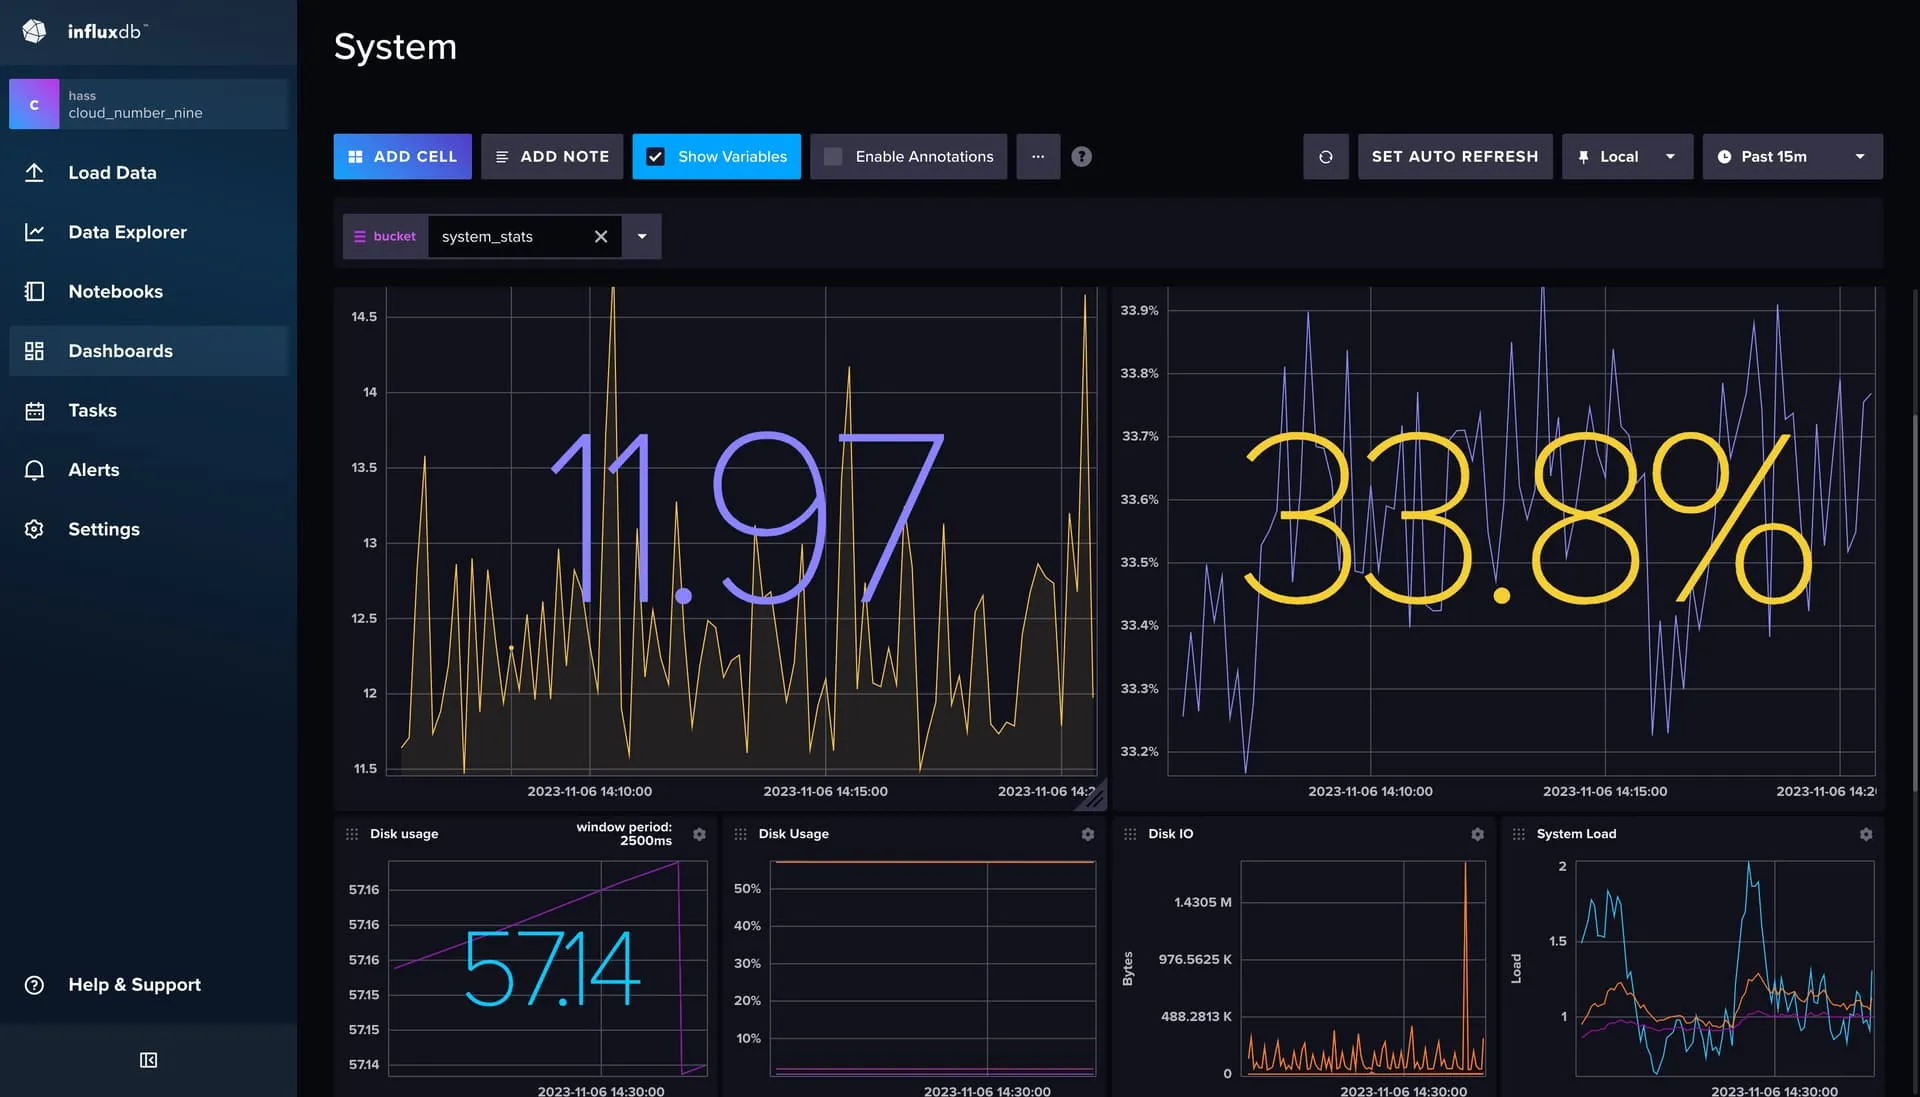
InfluxDB is a purpose-built time-series database that’s been around since 2013. Unlike Prometheus (which focuses on metrics scraping), InfluxDB is designed as a general-purpose time-series storage engine with its own query language (InfluxQL and Flux).
Who it’s for: Teams working with time-series data beyond just infrastructure metrics, including IoT sensors, financial data, or analytics.
Pros:
- Purpose-built for time-series data with excellent write performance.
- Supports both push and pull models for data collection.
- Available as a managed cloud service (InfluxDB Cloud) or self-hosted.
- Strong ecosystem with Telegraf agent for data collection.
Trade-offs:
- Different query language (Flux/InfluxQL) means learning curve if coming from PromQL.
- The open-source version (InfluxDB OSS) has fewer features than the commercial version.
2. Simple Observability
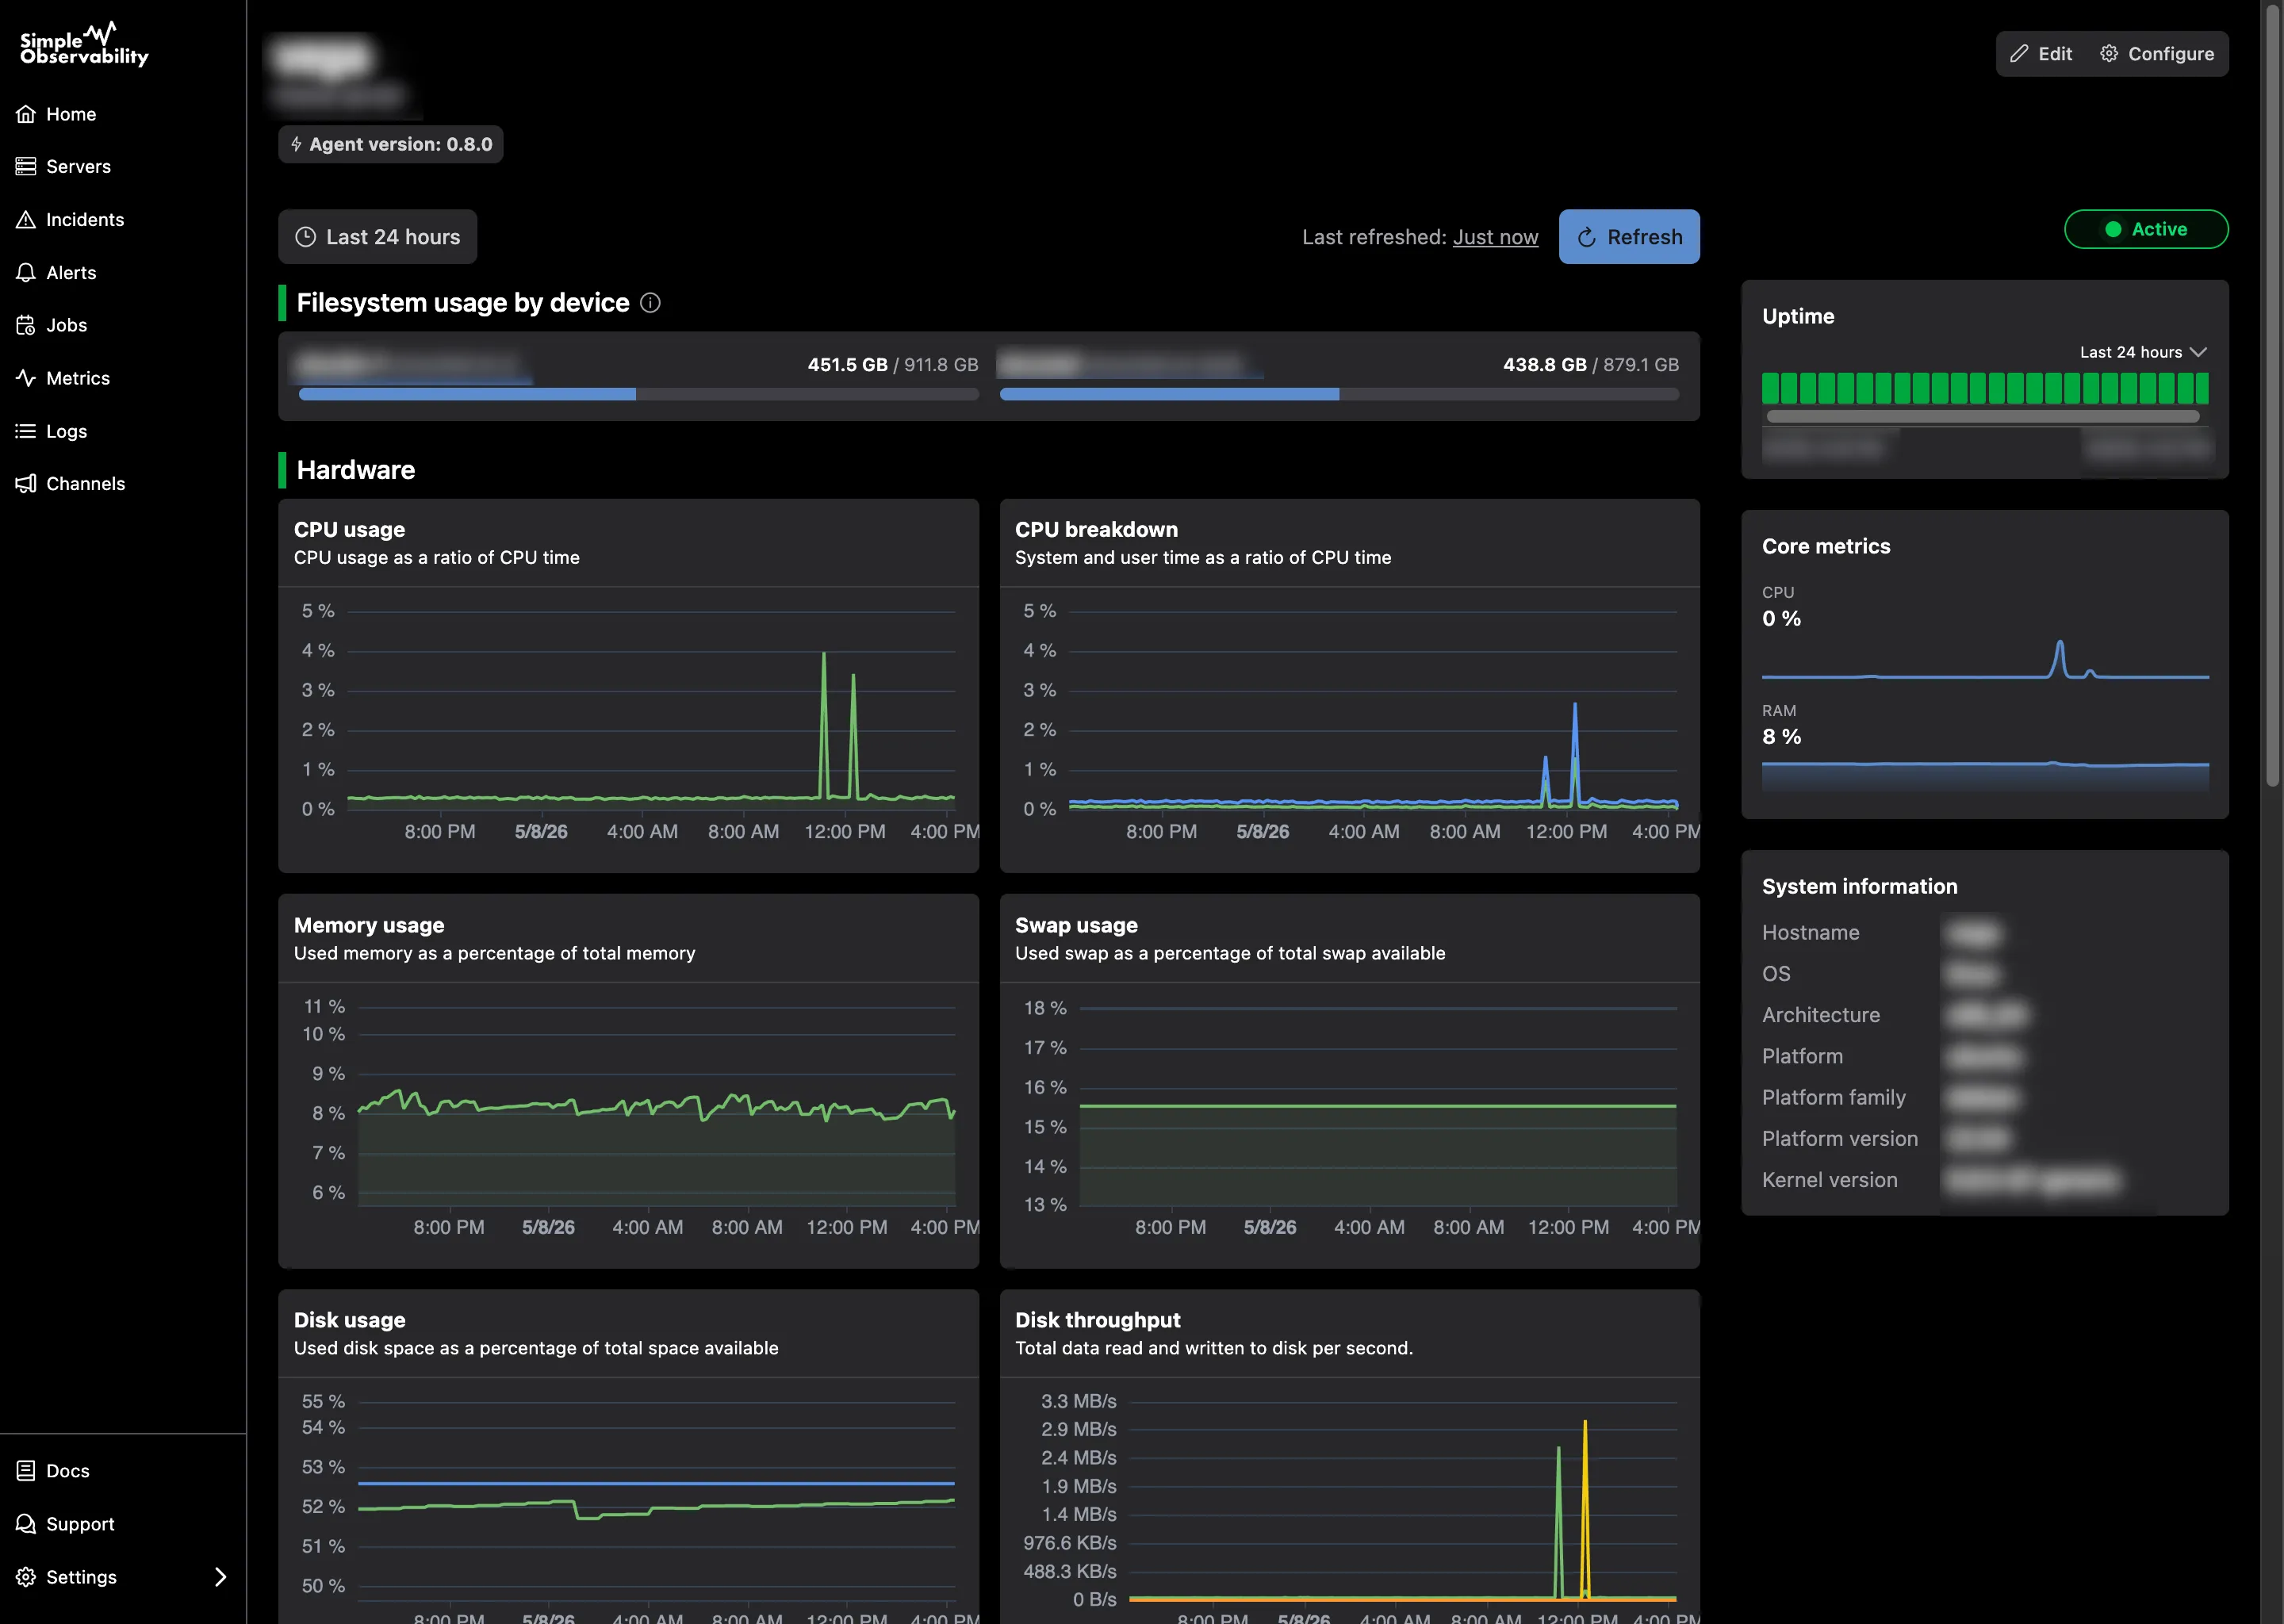
Simple Observability takes a different approach. Instead of being a scalable time-series database, it’s a unified platform that combines metrics and logs in one place with zero configuration.
Who it’s for: Teams that want monitoring and logging without building or managing a stack.
Pros:
- Metrics and logs in one view, no separate backends.
- One-command agent installation that auto-detects services.
- Pre-configured dashboards and alerts (no YAML editing).
Trade-offs:
- Not designed for massive scale (billions of series). Built for the 95% of teams that need solid server monitoring without the complexity.
3. VictoriaMetrics
VictoriaMetrics is a high-performance, drop-in replacement for Prometheus. It’s known for using significantly less memory and disk space while handling the same workload.
Who it’s for: Teams that want better performance and efficiency without the complexity of Mimir.
Pros:
- Uses less RAM and disk than Prometheus.
- Can run as a single binary or a simple cluster.
- Supports Prometheus, InfluxDB, and Graphite protocols.
Trade-offs:
- Uses MetricsQL, an extended version of PromQL. It’s powerful, but using proprietary extensions can create some lock-in.
4. SigNoz
SigNoz is an all-in-one observability platform built on OpenTelemetry. Unlike Prometheus (which only handles metrics), SigNoz treats metrics, logs, and traces as first-class citizens in a single ClickHouse database.
Who it’s for: Teams that want a Datadog-like experience but prefer open-source.
Pros:
- Unified metrics, logs, and traces in one UI.
- Fast queries thanks to ClickHouse.
- OpenTelemetry native, so it’s future-proof.
Trade-offs:
- Newer than Prometheus, so the ecosystem is less mature.
- You’re responsible for managing ClickHouse, which can get complex at scale.
5. Datadog
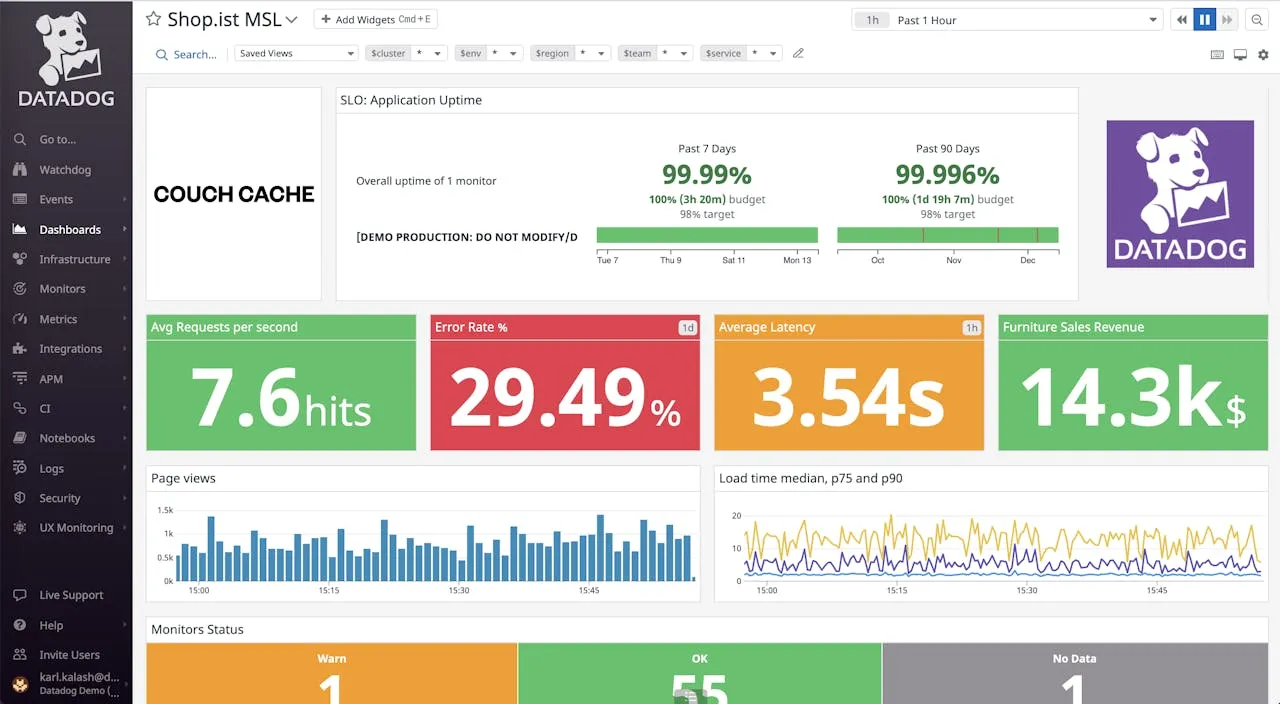
If you want to completely eliminate operational overhead, Datadog is the commercial standard. It replaces your entire observability stack (metrics, logs, traces, APM) with a fully managed SaaS.
Who it’s for: Enterprises with budget who prioritize speed and polish over cost.
Pros:
- Zero infrastructure to manage.
- Best-in-class UI and user experience.
- Automatic correlation between metrics, logs, and traces.
Trade-offs:
- Expensive. Custom metrics pricing can get very high.
- Proprietary agent and data format (vendor lock-in).
When Prometheus is still the right choice
Before switching, make sure you’re not solving a problem you don’t actually have. Prometheus is still the best option if:
You have a small Kubernetes cluster. One or two clusters with short retention needs? Prometheus is simple and effective.
You’re in an air-gapped environment. Prometheus runs completely offline, which is ideal for secure or isolated networks.
You have the engineering bandwidth. If your team can tune compression, sharding, and scraping, Prometheus gives you full control.
Conclusion
Choosing a Prometheus alternative depends on your specific needs.
For time-series data and IoT workloads: InfluxDB is purpose-built for high-volume time-series storage.
For simplicity and unified metrics and logs: Simple Observability removes the complexity of building a stack.
For better performance and efficiency: VictoriaMetrics uses fewer resources than Prometheus.
For unified metrics, logs, and traces: SigNoz is the modern, OpenTelemetry-native choice.
Pick the tool that matches your scale, your team’s expertise, and how much operational overhead you’re willing to take on.