
Netdata and Zabbix are both monitoring tools. That’s where the similarity ends.
One gives you real-time visibility with almost no setup. The other gives you enterprise-grade depth after significant configuration effort. One creates noise. The other creates maintenance overhead.
If you’re comparing them, you’re probably trying to answer a specific question: do I need instant visibility or comprehensive control? The answer determines which operational pain you’re willing to accept.
Why teams compare Netdata and Zabbix
These tools attract different users for different reasons, but they overlap in one scenario: teams outgrowing basic monitoring who need more than uptime checks but aren’t ready for full observability platforms.
Netdata appeals to teams who want immediate insight. Install it on a server and you get hundreds of metrics instantly. No configuration files. No database setup. Just charts.
Zabbix appeals to teams who need to monitor everything: servers, switches, IPMI controllers, SNMP devices, Java applications. It’s the tool you choose when “monitoring” means tracking thousands of distinct metrics across heterogeneous infrastructure.
The comparison happens when a team realizes their needs fall somewhere between these extremes. They want more than Netdata’s real-time focus but less complexity than Zabbix demands.
Netdata: strengths and hidden costs
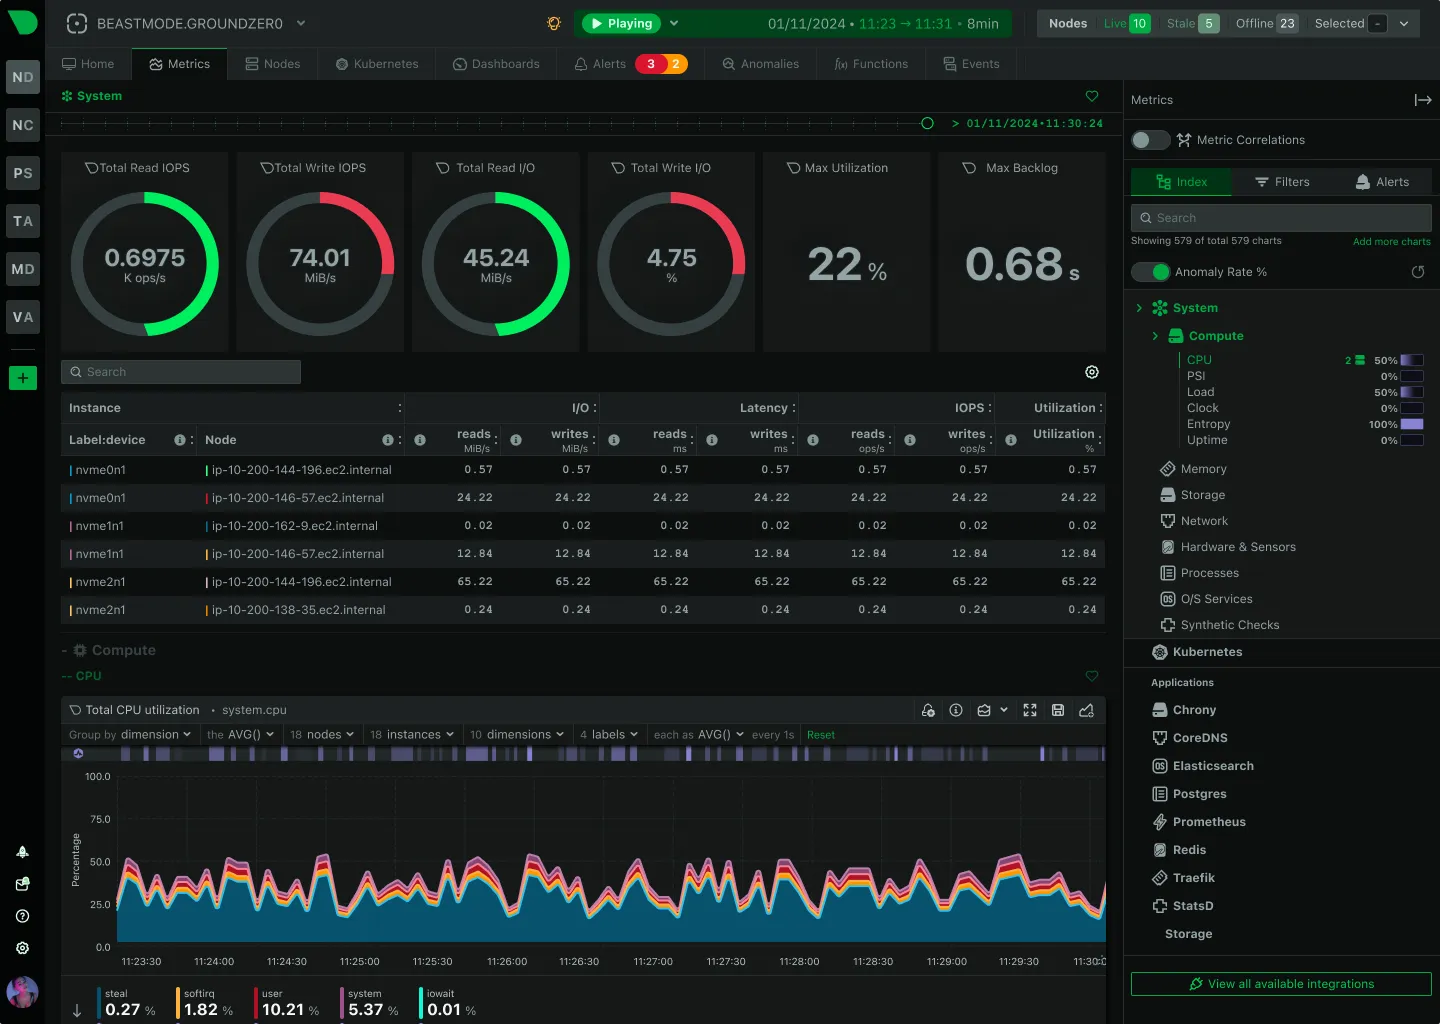
Netdata’s core strength is speed to value. Install the agent and you immediately see CPU, memory, disk I/O, network traffic, and application-level metrics. The charts update every second. For troubleshooting a live performance issue, this is unmatched.
What works
The distributed architecture makes sense for certain use cases. Each node collects and stores its own data. There’s no central bottleneck. You can monitor thousands of servers without worrying about a central database collapsing under write load.
The automatic service discovery is genuinely good. Netdata detects running services and starts collecting relevant metrics without manual configuration. Install it on a server running Nginx, PostgreSQL, and Redis, and you’ll see metrics for all three immediately.
The operational pain
The problem is retention and aggregation. By default, Netdata stores metrics locally on each node. That’s fine for real-time troubleshooting, but it creates gaps in historical analysis. If a server crashes, you lose its metrics. If you want to compare trends across your fleet, you’re aggregating data from dozens of individual nodes.
Netdata Cloud solves this by centralizing data, but now you’re paying for storage and dealing with the complexity of a distributed system that was supposed to be simple. The “zero configuration” promise evaporates when you need fleet-wide visibility.
The alert noise is another issue. Netdata ships with hundreds of pre-configured alarms. Many are useful. Many fire constantly on metrics that don’t matter for your specific workload. Tuning these alarms means editing configuration files on every node or managing them through Netdata Cloud, which reintroduces the centralized complexity you were trying to avoid.
Resource usage is higher than lightweight agents. Netdata’s real-time processing and anomaly detection consume CPU and memory. On a beefy server, this is negligible. On a small VPS or a resource-constrained container, it’s noticeable.
Who regrets choosing Netdata
Teams managing large, dynamic fleets where servers come and go frequently. The distributed model means you’re constantly losing historical data as nodes terminate.
Teams who need long-term trend analysis for capacity planning. Netdata’s focus on real-time data makes it poor for answering questions like “how has our average CPU usage changed over the last six months?”
Teams with limited time for alert tuning. The out-of-the-box alarms generate too much noise, and silencing them requires ongoing maintenance.
Zabbix: strengths and operational weight
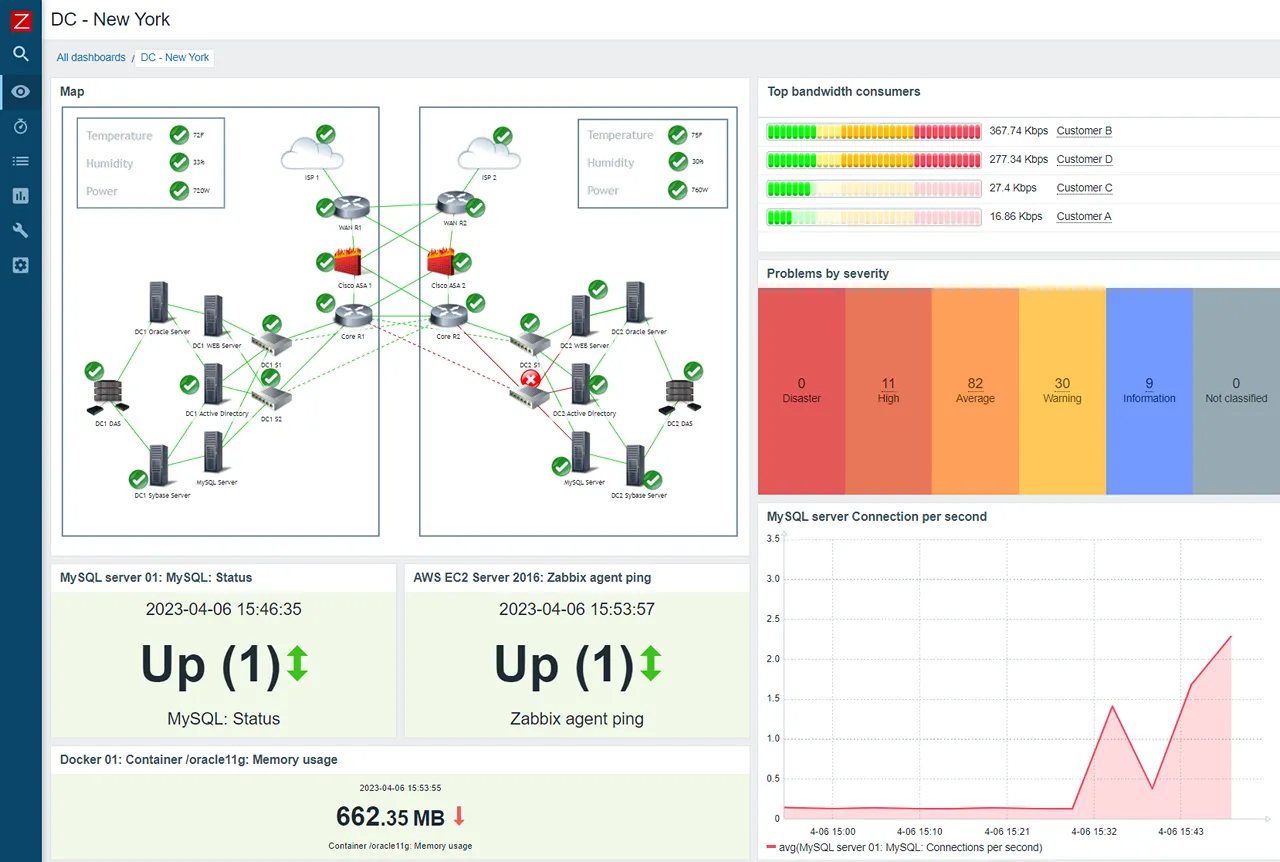
Zabbix is a monitoring platform built for control. You can monitor almost anything, configure exactly how data is collected, define complex trigger logic, and build custom dashboards. It’s powerful because it’s flexible.
What works
The depth is real. Zabbix can monitor SNMP devices, IPMI sensors, Java applications via JMX, databases, log files, and custom scripts. If you need to track the temperature of a switch in a remote data center alongside the response time of a web API, Zabbix handles both.
The template system, once you understand it, allows you to define monitoring logic once and apply it to hundreds of hosts. This is valuable for standardized infrastructure where every web server should be monitored the same way.
Historical data storage is first-class. Zabbix stores everything in a database (PostgreSQL or MySQL). You can query years of historical data, build trend reports, and do capacity planning based on actual usage patterns.
The operational pain
The learning curve is steep. Zabbix has a specific hierarchy: Hosts, Host Groups, Templates, Items, Triggers, Actions. Understanding how these interact takes time. Onboarding a new team member means weeks of training, not hours.
Maintenance overhead is significant. You’re managing a database that grows rapidly. A moderately sized Zabbix deployment can generate gigabytes of data per day. You need to configure partitioning, tune database performance, and plan for storage growth. For small teams, this is a part-time job.
The interface feels dated. It’s functional, but navigating through nested menus to create a simple dashboard is tedious compared to modern tools. The mobile experience is poor.
Configuration is verbose. Creating a new check means defining an Item, then a Trigger, then an Action. For simple monitoring, this is overkill. For complex scenarios, it’s powerful but time-consuming.
Cloud-native support is awkward. Zabbix was designed for static infrastructure. Monitoring auto-scaling groups or ephemeral containers requires complex discovery rules and constant tuning.
Who regrets choosing Zabbix
Small teams without dedicated ops resources. The maintenance burden distracts from building the actual product.
Teams running primarily cloud-native infrastructure. Zabbix works, but it fights against the dynamic nature of containers and auto-scaling.
Teams who need to move fast. Setting up comprehensive monitoring in Zabbix takes weeks, not hours. If you need to ship quickly, this is a bottleneck.
Key differences that actually matter
| Feature | Netdata | Zabbix |
|---|---|---|
| Time to Value | Minutes. Install agent, see dashboard immediately. | Days to weeks. Requires server, DB, templates, and agent config. |
| Maintenance | Minimal. Node-local or cloud-managed. | Significant. DB tuning, partitioning, and template management. |
| Alerting | Automatic & ML-driven. Fast but can be noisy. | Manual & Precise. Powerful logic but high upfront configuration. |
| History | Weak by default. Requires cloud or secondary DB for long-term data. | Strong out-of-the-box. Built on a performance-tuned SQL database. |
| Infrastructure | Best for real-time server & app metrics. | Best for heterogeneous gear (SNMP, IPMI, legacy apps). |
When Netdata is the wrong choice
You need long-term data retention without paying for a SaaS platform. Netdata’s local storage model doesn’t support this well.
You’re managing a large fleet where servers are frequently created and destroyed. The distributed architecture means you’re constantly losing data.
You need comprehensive alerting with complex logic. Netdata’s alerting is simpler and less flexible than Zabbix.
You’re monitoring heterogeneous infrastructure (servers, network gear, IoT devices). Netdata is primarily focused on server and application metrics.
When Zabbix is the wrong choice
You have a small team and limited time for maintenance. Zabbix’s operational overhead will consume resources you don’t have.
You need to move fast. Setting up Zabbix properly takes significant time.
Your infrastructure is primarily cloud-native and dynamic. Zabbix can handle this, but it’s not designed for it. You’ll fight the tool.
You want a modern, intuitive interface. Zabbix works, but it feels like enterprise software from 2010.
What to choose if neither fits your constraints
Some teams find themselves in a gap. Netdata is too limited for their needs, but Zabbix is too heavy for their resources.
For small-to-mid server fleets where the goal is reliable monitoring without operational overhead, a simpler managed approach can make sense. Tools focused on essential metrics and logs, with minimal configuration and predictable costs, serve teams who want monitoring to be infrastructure they don’t think about.
The right choice depends on your constraints: team size, infrastructure complexity, and how much time you can dedicate to maintaining your monitoring system. Neither Netdata nor Zabbix is universally better. They solve different problems and create different kinds of operational pain.
Choose based on which pain you’re equipped to handle.