
Beszel has gained a lot of traction recently, and for good reason. It’s lightweight, built on a modern stack (PocketBase + Go), and provides that “instant visibility” that self-hosters and home lab enthusiasts love. If you just want to see if your CPU is spiking or how much RAM your Docker containers are eating, Beszel is fantastic.
But most people searching for a Beszel alternative eventually hit the same wall.
You realize that “viewing metrics” is not the same as “understanding a system.” You get an alert (or worse, you don’t), and you find yourself jumping between a dashboard, a terminal for logs, and a spreadsheet of historical trends that don’t exist.
Why people look for a Beszel alternative
It usually starts with one of these specific frustrations:
- Surface-level alerting: Beszel can tell you if a node is down or CPU is high, but it lacks the depth to handle complex conditions (like “alert me if disk usage grows by 10% in an hour”).
- Weak historical analysis: Comparing today’s performance to last month’s is difficult or impossible. Understanding long-term trends is crucial for capacity planning.
- The “Log Gap”: Metrics tell you something is wrong; logs tell you what is wrong. Beszel doesn’t integrate logs, meaning you’re always one tool away from finding the root cause.
- Multi-node overhead: While it supports multiple nodes, managing a growing fleet of 10+ servers starts to feel clunky compared to centralized observability platforms.
Not all alternatives are the same
If Beszel isn’t enough, the “right” direction depends entirely on why it’s failing you. Don’t just jump to the biggest tool you can find; match the tool to the trade-off you’re willing to make.
1. The “Stay Lightweight” Path: Glances
If you love Beszel because it’s fast and resource-light, Glances is the closest philosophical neighbor. It’s a Python-based system monitor that can run in a terminal or as a web server.
- The Trade-off: It’s still primarily a “right now” tool. While it has an export feature (to InfluxDB or Prometheus), setting up historical data and alerting makes it significantly more complex than the base install. Use this if you just want more raw data points than Beszel provides.
2. The “Docker Specialist” Path: Dozzle
If your entire world is Docker containers and you mostly use Beszel to see container stats, Dozzle might be the missing piece. It’s not a full system monitor, but a real-time log viewer for Docker.
- The Trade-off: It’s narrow. It won’t tell you about your server’s disk health or network throughput, but it solves the “Log Gap” perfectly. Many people actually run Dozzle alongside Beszel, but that still leaves you with two disconnected UIs.
3. The “Step Up” Path: Real Observability
When your infrastructure starts handling actual “production” workloads (even in a home lab), you need a system that unifies metrics, logs, and actionable signals.
This usually means moving to a stack like Prometheus + Grafana + Loki.
- The Trade-off: Overhead. You’ll spend more time managing the monitoring stack than the actual apps you’re supposed to be monitoring. YAML configuration, data retention policies, and dashboard templating become a part-time job.
What actually changes when you move beyond Beszel?
The shift from a lightweight dashboard to a true observability platform isn’t just about “more charts.” It’s about a change in workflow:
- From “Viewing Metrics” → “Understanding Systems”: You stop looking at CPU percentages and start looking at why requests are slow by correlating metrics with logs.
- From “Single Node” → “Infrastructure”: You gain a birds-eye view where the health of the entire cluster is more important than any single server.
- From “No Alerts” → “Actionable Signals”: Instead of getting a “CPU High” notification at 3 AM, you get an alert that actually correlates a disk growth trend with an upcoming failure.
Simple Observability: Hosted Observability That Actually Covers the Gaps
Simple Observability is a hosted observability platform covering the three things Beszel doesn’t: centralized log search, cron job monitoring, and threshold-based alerting — plus the system metrics you’re already used to.
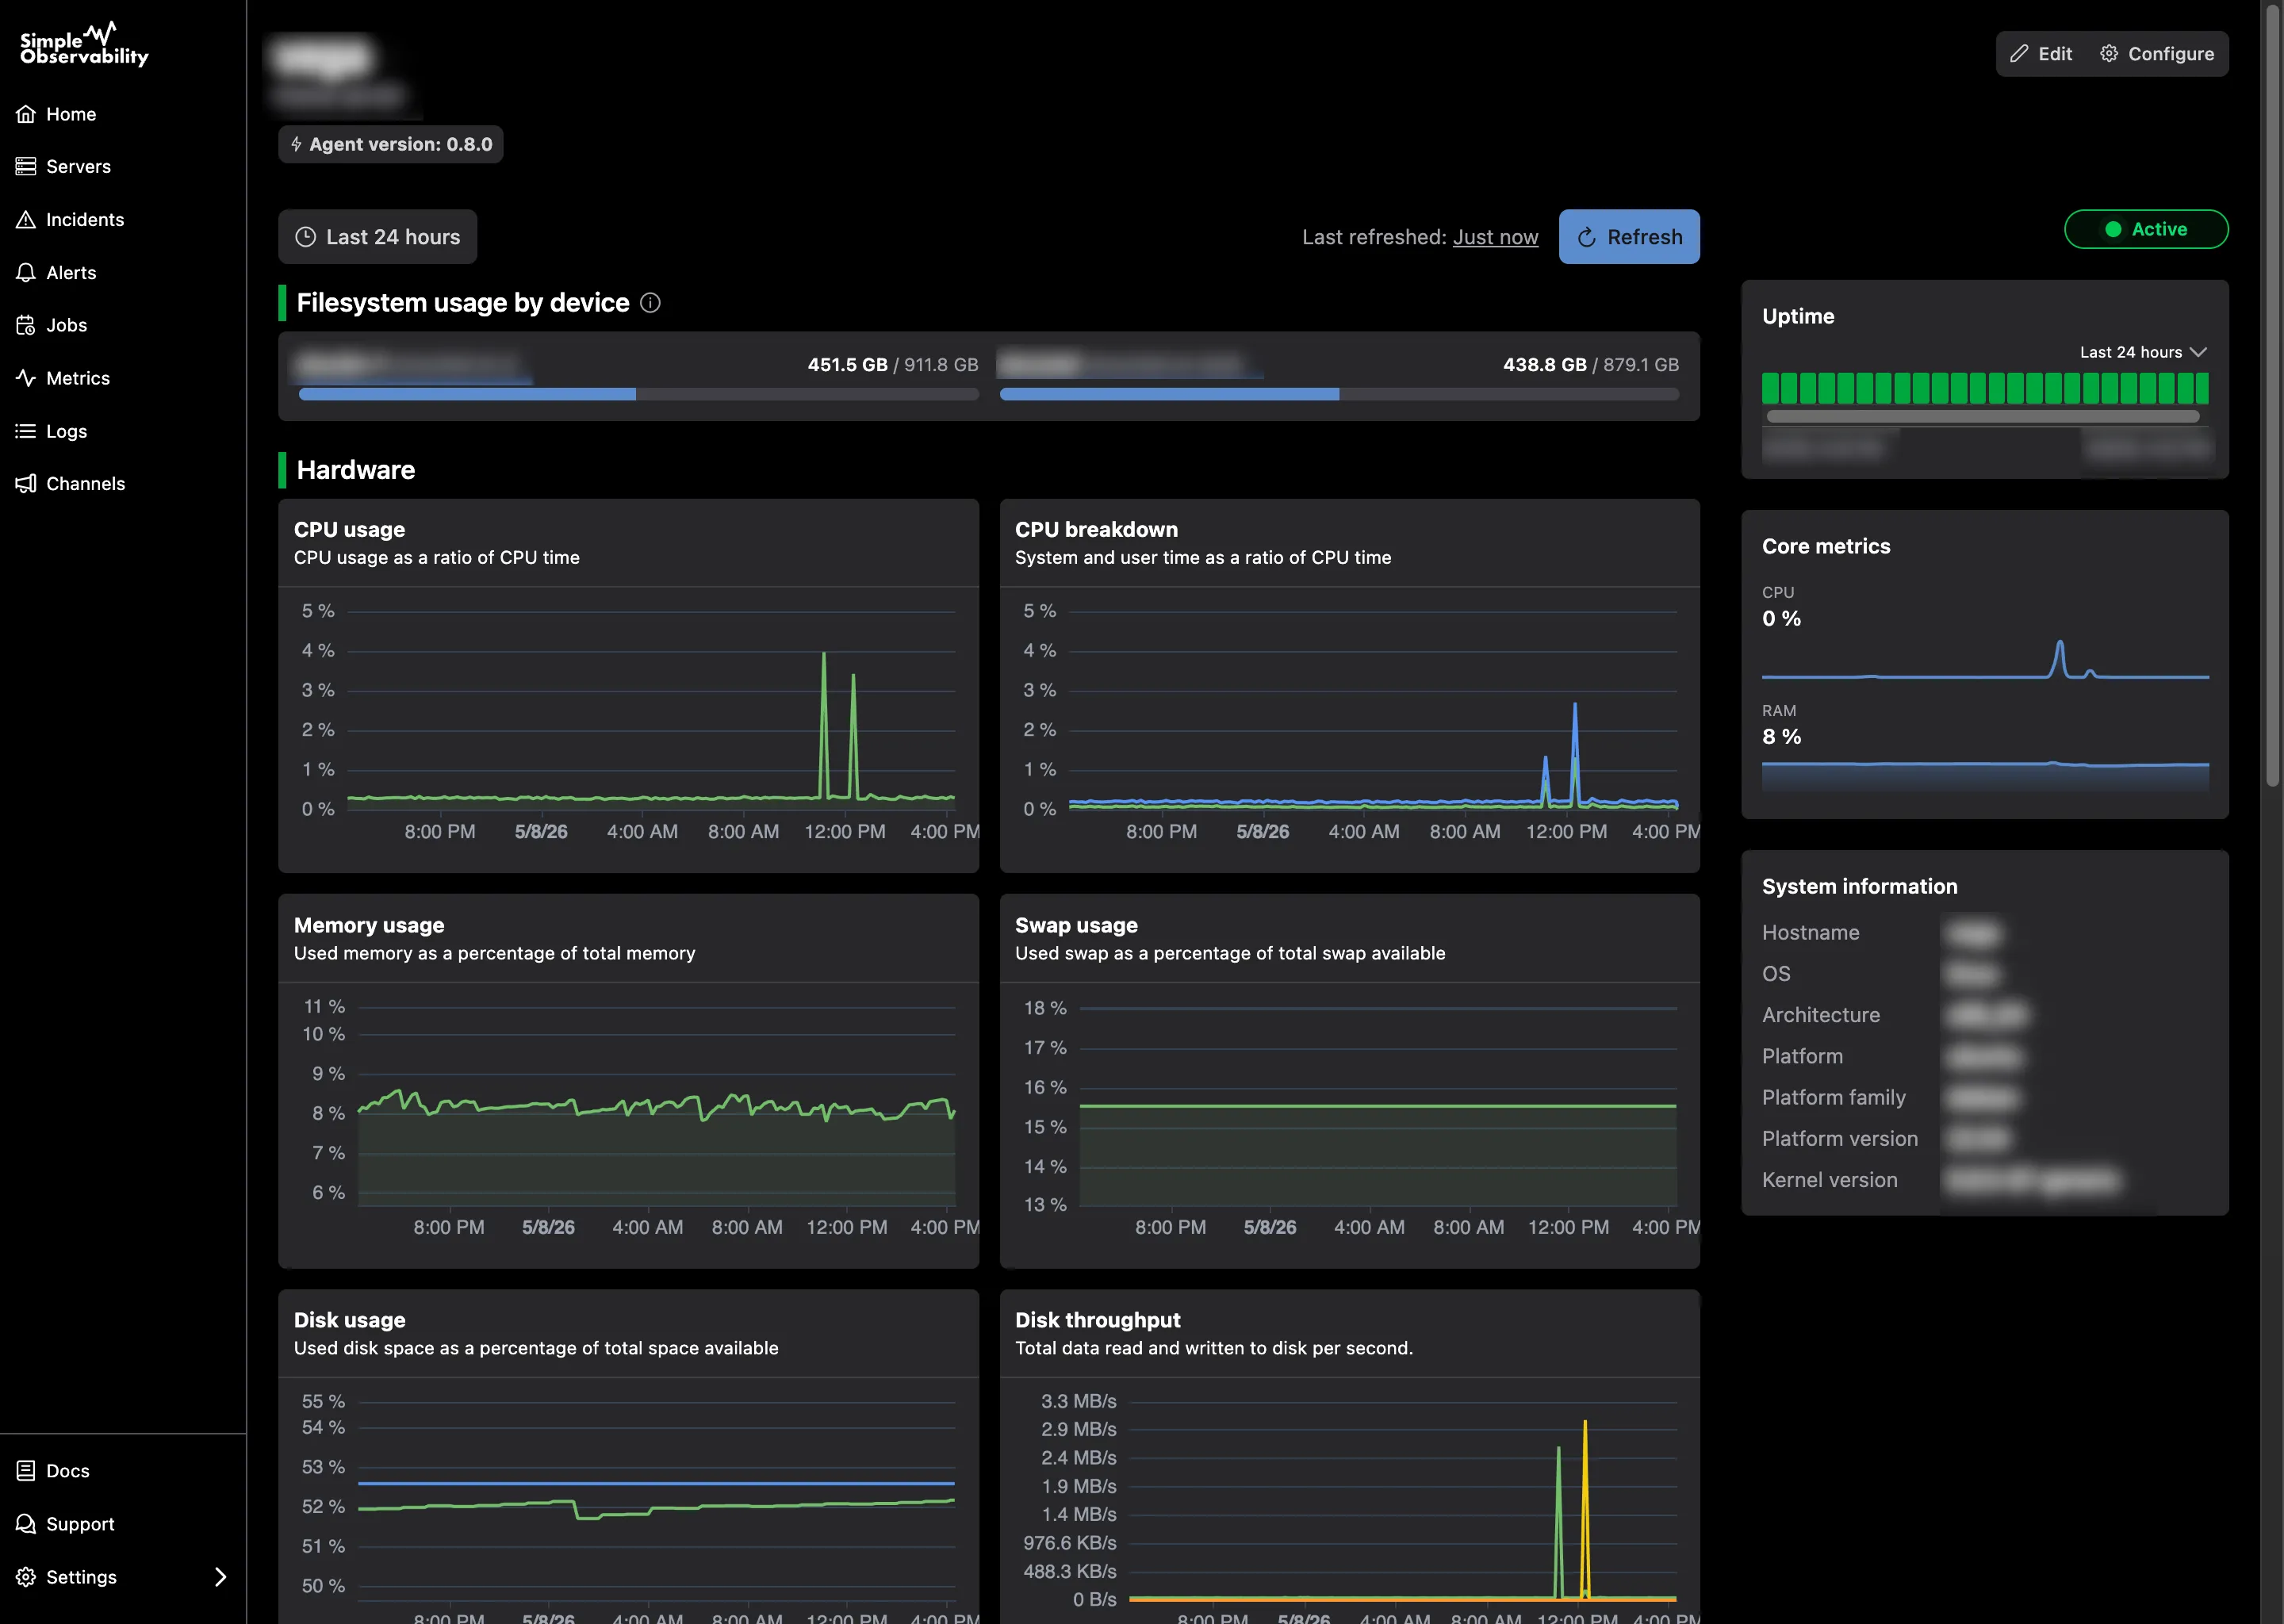
It runs externally to your infrastructure: a single binary agent installs on each server, pushes data out over HTTPS, and requires no inbound ports. Your monitoring doesn’t share a failure domain with the servers it’s watching.
- Metrics + Logs in one place: CPU, RAM, disk, and network — alongside your logs. When a metric spikes, your logs are right there. No terminal switching.
- Cron monitoring: Track execution, duration, and exit codes for your scheduled jobs. Get alerted on failures or missed runs — something Beszel has no concept of.
- Threshold-based alerts: Set conditions and get notified on Slack, Discord, or other channels. Works out of the box, with no YAML to write.
- Zero maintenance: We handle storage, retention, and upgrades. Your monitoring stack won’t need its own sysadmin.
If Beszel has been useful but you’ve hit the log gap, wasted time on alerts that don’t fire, or run a cron job silently fail — Simple Observability is the next step. One command, no config files.